

Abstract
Superantigens (SAGs) bind simultaneously to major histocompatibility complex (MHC) and T-cell receptor (TCR) molecules, resulting in the massive release of inflammatory cytokines that can lead to toxic shock syndrome (TSS) and death. A major causative agent of TSS is toxic shock syndrome toxin-1 (TSST-1), which is unique relative to other bacterial SAGs owing to its structural divergence and its stringent TCR specificity. Here, we report the crystal structure of TSST-1 in complex with an affinity-matured variant of its wild-type TCR ligand, human T-cell receptor β chain variable domain 2.1. From this structure and a model of the wild-type complex, we show that TSST-1 engages TCR ligands in a markedly different way than do other SAGs. We provide a structural basis for the high TCR specificity of TSST-1 and present a model of the TSST-1-dependent MHC–SAG–TCR T-cell signaling complex that is structurally and energetically unique relative to those formed by other SAGs. Our data also suggest that protein plasticity plays an exceptionally significant role in this affinity maturation process that results in more than a 3000-fold increase in affinity.
Keywords: protein–protein interaction, superantigen, surface plasmon resonance, T-cell activity, X-ray crystallography
Introduction
Bacterial superantigens (SAGs) comprise a large family of disease-associated proteins that are produced primarily by Staphylococcus aureus and Streptococcus pyogenes (McCormick et al, 2001). SAGs function by simultaneously interacting with major histocompatibility complex (MHC) class II and T-cell receptor (TCR) molecules on antigen-presenting cells (APCs) and T lymphocytes, respectively (Sundberg et al, 2002b). Contrary to processed antigenic peptides, SAGs bind to MHC molecules outside of their peptide-binding grooves and interact only with the Vβ domains of TCRs, resulting in the stimulation of up to 20% of the entire T-cell population. In this way, SAGs initiate a systemic release of inflammatory cytokines that results in a condition known as toxic shock syndrome (TSS) and can ultimately lead to multi-organ failure and death.
Toxic shock syndrome toxin-1 (TSST-1), an exotoxin secreted by S. aureus, was identified as a major causative agent of TSS some 25 years ago (Bergdoll et al, 1981; Schlievert et al, 1981). TSST-1 is unique in several respects in relation to other members of the family of SAGs, including its structural divergence and its TCR Vβ specificity. TSST-1 interacts almost exclusively with the human T-cell receptor β chain variable domain 2.1 (hVβ2) family (Choi et al, 1989), and a significant fraction of patients with TSS exhibit substantially expanded hVβ2+ T-cell populations (Choi et al, 1990). Although TSST-1 has been characterized extensively, the molecular mechanism by which it interacts specifically with TCR molecules and initiates the onset of TSS remains unclear.
The binding sites on MHC molecules with which SAGs interact are diverse and can be classified into three distinct groups: (i) a site on the MHC α subunit entirely peripheral to the MHC-bound peptide; (ii) a zinc-mediated site on the MHC β subunit that extends over the MHC-bound peptide; and (iii) a site on the MHC α subunit that extends over the MHC-bound peptide. These three binding modes have been characterized crystallographically and are most readily exemplified by the SAGs staphylococcal enterotoxin B (SEB) (Jardetzky et al, 1994), streptococcal pyrogenic exotoxin C (SpeC) (Li et al, 2001) and TSST-1 (Kim et al, 1994), respectively. Crystal structures of SEB (Li et al, 1998) and SpeC (Sundberg et al, 2002a) with their respective TCR Vβ ligands have revealed that SAG-Vβ interactions are also structurally diverse. These structures have allowed for the construction of models of the ternary MHC–SAG–TCR supramolecular complexes required for SAG-mediated T-cell activation, which have been verified biochemically (Andersen et al, 1999) and characterized energetically (Andersen et al, 2002). As there is not a structure of the complex formed between TSST-1 (the only representative of the third MHC binding mode described above) and its Vβ ligand, the compendium of MHC–SAG–TCR signaling complexes that initiate SAG-induced disease remains incomplete.
Despite the intense research efforts that have been directed toward the characterization of SAGs, therapeutics capable of neutralizing SAG-mediated T-cell activation in humans are unavailable. Intravenously administered pooled human immunoglobulin (IVIG) has been used with some success, but its supply is limited and its effectiveness is variable (Kaul et al, 1999; LeClaire and Bavari, 2001). Mouse monoclonal antibodies have been generated against SEB (Hamad et al, 1994; Pang et al, 2000), but have not been humanized for clinical use. A potentially more general anti-inflammatory agent, a recombinant cell-penetrating form of the suppressor of cytokine signaling 3, has exhibited some efficacy in protecting mice challenged with lethal doses of SEB (Jo et al, 2005).
Thus, we have pursued a strategy of using affinity-matured forms of TCR Vβ domains, the natural receptors of the toxins, as potential therapeutics. To date, we have engineered Vβ domain-derived SAG antagonists that bind to their SAG targets, including staphylococcal enterotoxin C3 (SEC3), SEB and TSST, with affinities up to a million-fold higher than the wild-type SAG-Vβ interactions (Kieke et al, 2001; Buonpane et al, 2005). One of these Vβ variants completely neutralizes the lethal activity of SEB in animal models (unpublished results). Beyond engineering anti-SAG therapeutics, the affinity maturation of a drug target's natural ligand to create a competitive inhibitor may constitute a generally applicable approach to therapeutic development.
An additional benefit of such an approach to developing therapeutics is that they provide model systems for understanding the molecular basis of protein–protein interactions generally. Energetic and structural dissection of the affinity maturation pathways defined by these evolved protein complexes provides insights into the molecular determinants that govern the specificities and affinities of molecular interactions. As the affinity maturation process required for such large differences in SAG affinity between the wild-type and penultimate variant Vβ domains is necessarily dependent on combinations of mutations, these model systems are especially useful for quantifying those biophysical parameters that are combinatorial in nature, such as cooperativity and plasticity (i.e., conformational flexibility), and therefore beyond the scope of investigations using standard site-directed mutagenesis techniques. Accordingly, we have performed structural and thermodynamic analyses of affinity-matured Vβ-SAG molecular systems that have provided novel insights into the molecular bases of energetic cooperativity and additivity in protein–protein interactions (Yang et al, 2003; Cho et al, 2005; Moza et al, 2006).
Here, we present the X-ray crystal structure of TSST-1 in complex with D10, the penultimate affinity-matured variant of the hVβ2.1 whose affinity for TSST-1 is three orders of magnitude higher than that of wild-type hVβ2.1 (Buonpane et al, 2005). From this structure, we have modeled the wild-type TSST-1–hVβ2.1 complex structure, which is completely consistent with mutational analysis of wild-type residues in both TSST-1 (McCormick et al, 2003) and hVβ2.1 (Buonpane et al, 2005). These structures show that TSST-1 engages its TCR ligand in a structurally unique way relative to other SAGs. Additionally, they provide a molecular basis for the stringent specificity of TSST-1 and a model of the MHC–TSST-1–TCR ternary complex that is a structural and energetic hybrid of the SpeC- and SEB-dependent supramolecular T-cell signaling complexes. Finally, these data suggest that instead of increases in intermolecular contacts and buried surface area, protein plasticity may be primarily responsible for this greater than 3000-fold increase in affinity for a protein–protein interaction.
Results and discussion
Unique TCR engagement by a bacterial superantigen
We have determined the X-ray crystal structure of TSST-1 in complex with the high-affinity hVβ2.1 variant D10 (Figure 1A, left panel). The structure was solved by molecular replacement methods using the wild-type TSST-1 (Prasad et al, 1997) and hVβ2.1 (Sundberg et al, 2002a) structures as search models. The structure of the complex has been refined to a resolution of 2.25 Å. Data collection and refinement statistics are shown in Table I. The docking orientation of the two molecules in this complex is similar to that of a model of this interaction that we proposed previously based on mutagenesis analysis (Moza et al, 2006). Not only does the high-resolution X-ray crystal structure of the TSST-1–D10 complex reported here verify our previous model, but it also provides details of the molecular contacts within the interface at the atomic level and reveals the flexible nature of this region of the hVβ2.1 molecule. These observations are critical for understanding SAG–TCR specificity and cross-reactivity, as well as the role of protein plasticity in SAG–TCR engagement, respectively.
Figure 1.
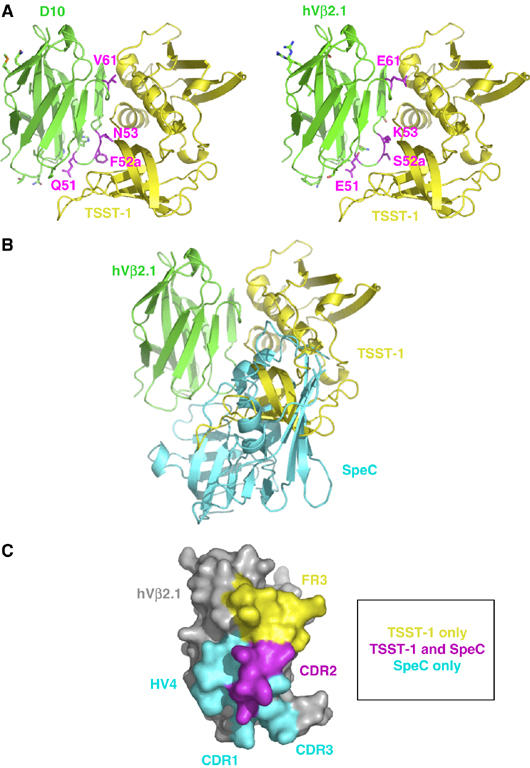
Distinct SAG-binding sites on a common ligand. (A) Crystal structure of the TSST-1–D10 complex (left panel) and a model of the wild-type TSST-1–hVβ2.1 complex (right panel). TSST-1 is in yellow; hVβ2.1 is in green. The side chains of the residues that are mutated in D10 relative to wild-type hVβ2.1 are shown. Those mutations that are energetically significant are in magenta; the remaining mutations are in green. (B) Superposition of the TSST-1–hVβ2.1 and SpeC–hVβ2.1 complexes. The hVβ2.1 molecule belonging to the SpeC–hVβ2.1 complex has been removed for clarity. Color coding is as in (A); SpeC is in cyan. (C) Molecular surface of hVβ2.1 buried uniquely by TSST-1 (yellow) or SpeC (cyan) and the shared portion of the epitope (magenta). The hVβ2.1 molecule in (C) has been rotated approximately 90° clockwise about the vertical axis of the page relative to its orientation in (A) and (B).
Table 1.
Structure determination and refinement statistics
| Data collection and processing | |
| Space group | C2 |
| Unit cell dimensions | |
| a (Å) | 190.9 |
| b (Å) | 68.4 |
| c (Å) | 53.5 |
| b (deg) | 106.2 |
| Resolution (Å) | 2.25 |
| Molecules/asymmetric unit | 2 TSST-1/2 D10 |
| Observations | 180 278 |
| Unique reflections | 32 180 |
| Completeness (%)a | 99.4 (99.1) |
| Redundancya | 5.6 (5.3) |
| Rsym (%)b | 7.4 (25.0) |
| Mean I/σ(I) | 21.5 (7.2) |
| Refinement | |
| Rcryst (%)c | 24.23 |
| Rfree (%)d | 25.16 |
| Protein residues | 612 |
| Water molecules | 237 |
| Ramachandran plot statistics | |
| Core (%) | 85.8 |
| Allowed (%) | 11.4 |
| Generous (%) | 2.6 |
| Disallowed (%) | 0.2 |
| R.m.s. deviations from ideality | |
| Bonds (Å) | 0.019 |
| Angles (deg) | 1.807 |
| Values in parentheses are for the highest resolution shell (2.29–2.25 Å). | |
| Rsym=∑∣((Ihkl−I(hkl))∣/(∑Ihkl), where I(hkl) is the mean intensity of all reflections equivalent to hkl by symmetry. | |
| Rcryst=∑∣∣FO∣−∣FC∣/∑∣FO∣∣, where FC is the calculated structure factor. | |
| Rfree is calculated over reflections in a test set not included in atomic refinement using 4.6% of the reflections chosen at random and omitted from the refinement calculations. | |
D10 binds TSST-1 with an affinity more than 3000-fold tighter than wild-type hVβ2.1 (KD=180 pM and 600 nM, respectively), and was engineered by yeast display as a potential protein therapeutic for TSST-1-mediated disease (Buonpane et al, 2005). D10 contains 13 mutations, but only four of these (E51Q, S52aF, K53N and E61V) have been shown to be energetically significant (Moza et al, 2006). Although we and others have previously crystallized the wild-type TSST-1–hVβ2.1 complex, the quality of such crystals has not been sufficient to allow the determination of its atomic structure. Thus, using the TSST-1–D10 crystal structure, we produced a molecular model of the complex between TSST-1 and wild-type hVβ2.1 using CNS (Brunger et al, 1998), as described in the Materials and methods section. The modeled TSST-1–hVβ2.1 complex structure is shown (Figure 1A, right panel). The docking orientation of the two molecules that comprise the TSST-1–D10 and TSST-1–hVβ2.1 complexes is virtually identical, and has been independently verified by numerous mutagenesis studies (McCormick et al, 2003; Buonpane et al, 2005; Moza et al, 2006).
TSST-1 engages hVβ2.1 primarily through intermolecular contacts with residues from the second complementarity determining region (CDR2) loop and the third framework region (FR3). No contacts with residues from the CDR1, CDR3 or HV4 loops are made with TSST-1. Although D10 incorporated four mutations relative to wild-type hVβ2.1 in its CDR1 loop (Buonpane et al, 2005), none of these mutations affected binding to TSST-1 significantly (Moza et al, 2006), in accordance with the complex structure. In total, the modeled wild-type TSST-1–hVβ2.1 complex includes 1917 Å2 of buried surface area, which is similar to the SpeC–hVβ2.1 complex (Sundberg et al, 2002a), but significantly greater than that buried by either SEB, SEC3 or streptococcal pyrogenic exotoxin A (SpeA) with murine T-cell receptor β chain variable domain 8.2 (mVβ8.2) (Fields et al, 1996; Li et al, 1998; Sundberg et al, 2002a).
Of the other SAGs that are known to bind hVβ2.1, only the co-crystal structure with SpeC has been determined (Sundberg et al, 2002a). TSST-1 and SpeC have been shown previously to compete for binding to wild-type hVβ2.1 (Buonpane et al, 2005). The overlap between the TSST-1- and SpeC-binding interfaces with their mutual TCR ligand, however, is minimal (Figure 1B and C). The common residues engaged by TSST-1 and SpeC numbers only five, out of a total of 13 and 18 hVβ2.1 residues contacted by these two SAGs, respectively. All of these common residues reside in the CDR2 loop. The only other region of hVβ2.1 that TSST-1 binds is FR3. In fact, TSST-1 interacts with a single contiguous stretch of the hVβ2.1 sequence, spanning from residues 51 to 64 and including the CDR2 loop, the c″ β-strand and FR3. In contrast, SpeC engages discreet stretches of the hVβ2.1 sequence, namely those that comprise the apical regions of the CDR1, CDR2, HV4 and CDR3 loops. Additionally, SpeC makes no intermolecular contacts with FR3 residues in the apex of the loop situated between the CDR2 and HV4 loops (i.e., residues 58–64). Instead, SpeC contacts only those FR3 residues that are contiguous with and adjacent to the CDR2 (i.e., position 55) and HV4 (i.e., positions 67 and 68) loops.
The consequence of these differential intermolecular contacts between TSST-1 and SpeC for their common TCR ligand is that TSST-1 binds the surface of hVβ2.1 that is shifted away from the major hypervariable elements that bind peptide-MHC (pMHC) complexes (Hahn et al, 2005), and distinct from the surface that binds SpeC, which is more toward the Cβ domain of the TCR. The docking orientation of TSST-1 on hVβ2.1 is also markedly different than that of SEB binding to mVβ8.2, which is more similar to the SpeC–hVβ2.1 complex (Li et al, 1998). This unique TCR engagement by TSST-1 has important ramifications for its TCR specificity and the formation of the TSST-1-dependent supramolecular T-cell signaling complex, as discussed below.
Chemical basis of the stringent TCR specificity of TSST-1
TSST-1 is the most specific bacterial SAG known, stimulating only Vβ2+ T cells (Choi et al, 1990). Our structure of the TSST-1–D10 complex, and subsequent model of the TSST-1 complex with wild-type hVβ2.1, reveals the molecular basis for this binding specificity.
It seems counterintuitive that, among known SAG–TCR structures, TSST-1 utilizes contacts involving the smallest proportion of hypervariable sequences of the TCR Vβ domain (Figure 1C), but is nonetheless the most specific of any SAG–TCR complex. The complete lack of influence on binding of the CDR1 loop, as shown by our structure, previous mutagenesis (Buonpane et al, 2005) and binding analyses (Moza et al, 2006), is particularly surprising because this CDR loop contains a noncanonical single residue insertion unique to the highly homologous hVβ2 and hVβ4 domains. Conversely, T cells bearing both of these TCR Vβ domains are efficiently stimulated by SpeC (Li et al, 1997), and contacts with CDR1 loop residues specifically have been shown to be important for such T-cell activation (Rahman et al, 2006). The CDR2 loops of hVβ2 and hVβ4 are nearly identical in sequence. If TSST-1-mediated T-cell activation was dependent only on the sequence and structure of the CDR and HV loops of the TCR β chain, as it is with pMHC complexes and other SAGs, then why does TSST-1 not stimulate many other subsets of T cells and what dictates the fine specificity of TSST-1 such that it does not activate even hVβ4+ T cells?
Beyond the CDR2 loop, many of the intermolecular contacts formed by TSST-1 in this complex (Figure 2A) are made with residues that are unique to hVβ2.1. These residues reside primarily in the FR3 loop, which connects the c″ and d β-strands in TCR Vβ domains. In hVβ2.1, this loop is longer than it is in most TCR Vβ domains and consequently adopts a conformation that is structurally distinct relative to other simple β-turn elements that comprise other FR3 loops (Figure 2B). This is the case whether the Vβ domain exhibits the conventional immunoglobulin (Ig) fold β-strand topology in which the c″ β-strand is hydrogen bonded to the preceding c′ β-strand, and is found in hVβ2.1 and mVβ8.2 (Figure 2B, left panel), or in strand-swapped Vβ domains in which the c″ β-strand hydrogen bonds to the succeeding d β-strand, as in murine T-cell receptor β chain variable domain 2.3 (mVβ2.3) (Figure 2B, right panel). Within the c″ β-strand, one residue, Tyr56, which is unique to hVβ2.1 and hVβ4.1 among all Vβ domains, was found to have the most significant effect on TSST-1 binding when mutated to alanine (Buonpane et al, 2005).
Figure 2.
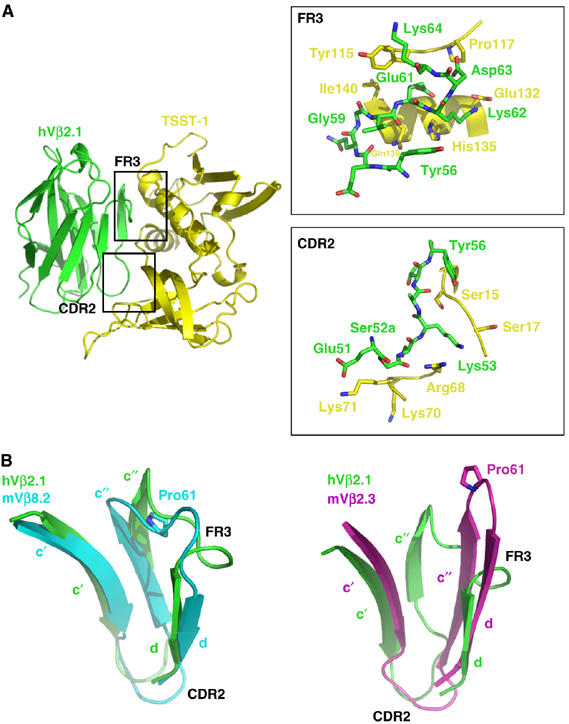
Structural features responsible for SAG–TCR specificity. (A) The TSST-1–hVβ2.1 complex with the CDR2 and FR3 hot regions demarcated. Upper inset, close-up of the molecular interactions in the FR3 hot region. Lower inset, close-up of the molecular interactions in the CDR2 hot region. Only residues that form contacts are drawn. Color coding is as in Figure 1A. (B) Superposition of the c′, c″ and d β-strands including the CDR2 and FR3 of hVβ2.1 with mVβ8.2 (left panel) and with mVβ2.3 (right panel). The side chains of Pro61 in both mVβ8.2 and mVβ2.3 are shown. Colors are as follows: hVβ2.1, green; mVβ8.2, cyan; mVβ2.3, magenta.
Two residues in particular in the hVβ2.1 FR3, Glu61 and Lys62, which are known hot spots for TSST-1 interaction (Buonpane et al, 2005; Moza et al, 2006), are critical for the stringent specificity of TSST-1. Approximately three quarters of all human TCR Vβ domains contain a proline residue at position 61, which disallows the unique conformation adopted by the FR3 loop of hVβ2.1 (Figure 2B). Additionally, half of all human TCR Vβ domains lack a residue at position 62. Together, these sequence differences in, and their resulting constraints on, FR3 explain why TSST-1 does not bind the great majority of Vβ domains nor stimulate those T cells bearing such.
The fine specificity of TSST-1, by which it distinguishes between hVβ2 and hVβ4, depends, instead, on which amino acids are indeed present at positions 61 and 62. In hVβ4, residue 61 is a Val, as opposed to a Glu in hVβ2. Surprisingly, this is a mutation that is found in D10 as well, and we have shown previously that this single-site mutation in the hVβ2.1 wild-type background significantly enhances affinity for TSST-1 (Moza et al, 2006). Thus, TSST-1 would be expected to bind hVβ4 exceptionally well on account of the similarity of the CDR2 loop and this sequence difference at position 61. However, residue 62 is an Ile in hVβ4 instead of a Lys in hVβ2. Residue Lys62 is arguably one of the most important residues for TSST-1 interaction (the other being Tyr56) as it is a known hot spot residue (Buonpane et al, 2005). In our modeled wild-type TSST-1–hVβ2.1 complex, Lys62 makes 20 van der Waals interactions and three hydrogen bonds with numerous TSST-1 residues, and buries a total of 116 Å2 surface area, all of which are by far the most of any residue in hVβ2.1. Thus, we propose that the fine specificity of TSST-1 for TCR Vβ domains is dependent primarily on the presence of a Lys residue at position 62.
The selective engagement of TSST-1 with hVβ2.1 is further dependent on the particular arrangement of these intermolecular contacts, namely the alignment of hot regions (i.e., clusters or modules of hot spot residues; Keskin et al, 2005; Reichmann et al, 2005) from these two proteins. Numerous mutagenesis studies have been carried out involving this protein–protein interaction, leading to a detailed mapping of the energetic contributions of residues found within the molecular interface (McCormick et al, 2003; Buonpane et al, 2005; Moza et al, 2006). The structure of the TSST-1–hVβ2.1 complex reveals the perfect juxtaposition of hot regions from each side of the interface: TSST-1 residues within a hot region composed primarily of residues from the central α-helix contact hVβ2.1 hot spots clustered in the apical loop of FR3 (Figure 2A, upper close-up); TSST-1 hot spots in the α1–β1 and β5–β6 loops contact the hVβ2.1 CDR2 loop hot region (Figure 2A, lower close-up). Specificity of the TSST-1–hVβ2.1 complex is further enhanced by the fact that each of the TSST-1 contact residues shares essentially no homology with residues at the same positions in other SAGs. Even analogous residues from TSST-1 and SpeC that both form intermolecular contacts with hVβ2.1, their common TCR ligand, are entirely dissimilar.
Whereas wild-type hVβ2.1 binds both TSST-1 and SpeC, the affinity-matured hVβ2.1 variant D10 binds only to TSST-1. In the SpeC–hVβ2.1 complex, the SpeC residues Tyr15 and Arg181 each make hydrogen-bonding interactions with the hVβ2.1 residue Ser52a, sandwiching this noncanonical CDR2 insertion residue (Sundberg et al, 2002a). Essentially all of the binding energy of the SpeC–hVβ2.1 complex is concentrated in the particular structural arrangement of these three residues (Rahman et al, 2006). D10, with its S52aF mutation, could not be sterically accommodated by the Tyr15SpeC and Arg181SpeC hot spot residues.
Structural basis of superantigen cross-reactivity and specificity
Our TSST-1–hVβ2.1 structure provides a key addition to the still small database of SAG–TCR complex structures (Fields et al, 1996; Li et al, 1998; Sundberg et al, 2002a). As TSST-1 exhibits the highest TCR Vβ domain specificity of any SAG, our analysis contributes significantly to the growing model of SAG cross-reactivity and specificity. Although all SAGs bind the Vβ CDR2 loop, how structural changes within this and other hypervariable, as well as certain framework, regions of TCR Vβ domains dictate the specificity of SAG–TCR interactions is beginning to emerge.
The least specific SAGs (including SEB and SEC3) depend primarily on a common conformation adopted by the CDR2 and HV4 loops in many Vβ domains (Fields et al, 1996; Li et al, 1998). In these complexes, hydrogen bonds are made only to Vβ main-chain atoms, such that numerous combinations of amino-acid sequences in CDR2 and HV4 can satisfy the binding requirements for these SAGs, as long as they do not change the lengths of these hypervariable loops nor disrupt the common structural conformation adopted.
As TCR specificity increases (e.g., SpeA), the number of hypervariable loops with which the SAG interacts increases beyond CDR2 and HV4. Additionally, the interface becomes increasingly populated by hydrogen bonds formed directly between side-chain atoms from both SAG and TCR (Sundberg et al, 2002a).
As TCR Vβ domain-binding partners become restricted even further (e.g., SpeC), the engagement of the entire repertoire of TCR hypervariable elements is observed. The CDR loops with which the SAG interacts also have incorporated noncanonical residue insertions that alter both their length and conformation to provide highly unique binding sites (Sundberg et al, 2002a).
SAG–TCR specificity is thus accomplished with increased side-chain to side-chain hydrogen bond interactions, an expanded set of hypervariable elements engaged, and an accumulation of noncanonical CDR loop structures is effectively exhausted at this point. In order to exhibit even greater specificity than SpeC, TSST-1 appears to target a structural element, the FR3 loop connecting the c″ and d β-strands, that adopts a common conformation in all but a few Vβ domains at the expense of interacting with each of the hypervariable structures. The fine specificity of TSST-1 for TCR Vβ domains is enhanced by requiring a particular residue (Lys) at a particular position (62) in order to bind and efficiently activate T cells. This targeting of rarely variable regions, at the expense of canonical hypervariable regions, in Vβ domains as a mechanism for TCR specificity may constitute a general rule in SAG–TCR recognition, as the structural analysis of SEK in complex with its sole Vβ ligand, hVβ5.1, shows similar characteristics (unpublished results).
A hybrid supramolecular architecture for superantigen-dependent T-cell activation
There exist three known binding modes for SAGs to interact with pMHC complexes. These binding modes are exemplified by the following SAGs: SEB, which binds pMHC exclusively to its α subunit with no contacts made with the antigenic peptide (Jardetzky et al, 1994); SpeC, which binds the pMHC-II β subunit through coordination of a zinc ion and makes numerous contacts with the displayed peptide (Li et al, 2001); and TSST-1, which binds predominantly to the pMHC-II α subunit at a site that overlaps with that of SEB but also extends over the surface of the peptide to make contacts with the β subunit (Kim et al, 1994). Crystal structures of SEB and SpeC in complex with their TCR β chain ligands (Li et al, 1998; Sundberg et al, 2002a) have allowed the modeling of those MHC–SAG–TCR ternary complexes that are necessary for efficient T-cell activation. The structure of the TSST-1–hVβ2.1 complex reported here allows the assembly of a model of the TSST-1–dependent T-cell signaling complex, which exhibits structural and energetic properties from each of the previously modeled MHC–SAG–TCR ternary T-cell signaling complexes. This expands the known diversity of supramolecular architectures that are capable of efficient T-cell activation.
In the SEB-dependent T-cell signaling complex (Figure 3A), SEB acts as a wedge between the pMHC and TCR molecules, effectively rotating the TCR about a contact point between the MHC β subunit and the TCR α chain. This removes the antigenic peptide from any possible contacts with the TCR. The relative orientation of the TCR and pMHC is such that a plane that passes through both the TCR α and β chains and one that is aligned with the MHC-displayed peptide are approximately perpendicular to one another. In this supramolecular complex, there exist three protein–protein interfaces: SEB–MHC, SEB–TCR and MHC–TCR. The presence of the direct MHC–TCR interaction (as indicated by the filled arrow in Figure 3A) has been verified biochemically (Andersen et al, 1999). This interface is also necessary energetically for effective T-cell signaling. The respective affinities (KD) of the SEB–MHC and SEB–TCR interactions are 54 and 150 μM (Malchiodi et al, 1995; Andersen et al, 1999), below the range required of pMHC–TCR interactions for the initiation of T-cell activation (Davis et al, 1998). The MHC–TCR interface acts in a cooperative energetic manner in order to increase the affinity of the MHC–SEB–TCR ternary complex to 1.4 μM (Andersen et al, 2002), sufficient for T-cell signaling.
Figure 3.
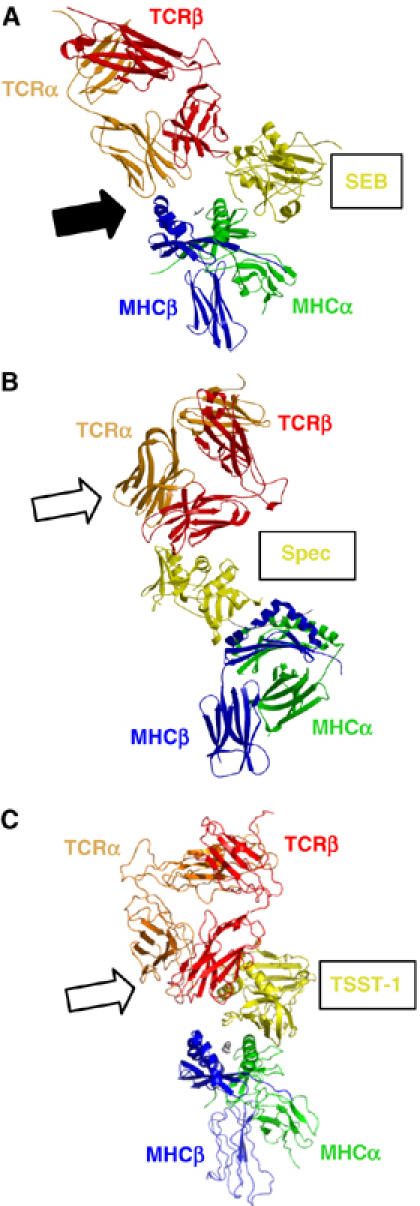
MHC–SAG–TCR T-cell signaling complexes. (A) The SEB-mediated T-cell signaling complex. The filled arrow indicates the direct MHCβ–TCRα interface. In this orientation, the APC would be situated below the complex; the T cell above. (B) The SpeC-mediated T-cell signaling complex. The unfilled arrow indicates that no direct MHC–TCR interaction occurs in this complex. (C) The TSST-1-mediated T-cell signaling complex. The unfilled arrow indicates that no direct MHC–TCR interaction occurs in this complex. For all panels, colors are as follows: SAG, yellow; TCRα, orange; TCRβ, red; MHCα, green; MHCβ, blue; peptide, gray.
SpeC, conversely, bridges the MHC and TCR molecules (Figure 3B). There exists no direct interaction between MHC and TCR (as indicated by the unfilled arrow in Figure 3B), and thus only two distinct protein–protein interfaces (i.e., SAG–MHC and SAG–TCR) comprise this complex. The TCR and pMHC are oriented such that planes passing through the TCR α and β chains and the antigenic peptide are approximately parallel to one another. The energetics of the SpeC-dependent T-cell signaling complex are markedly different from that of the SEB-dependent complex. SpeC binds pMHC through a high affinity (KD⩾0.1 μM) site on the polymorphic β subunit concomitant with the coordination of a zinc ion. The interaction of SpeC with hVβ2.1 has an affinity of 13 μM (Rahman et al, 2006). Together, these affinities allow the overall MHC–SpeC–TCR complex to achieve an affinity within the range for efficient T-cell activation.
The MHC–TSST-1–TCR signaling complex is a hybrid, both structurally and energetically, of the SEB- and SpeC-dependent complexes. Similar to SpeC, TSST-1 bridges the pMHC and TCR molecules such that only two protein–protein interfaces, SAG–MHC and SAG–TCR, are formed (Figure 3C). Accordingly, no direct MHC–TCR contacts are made (as indicated by the unfilled arrow in Figure 3C). Nonetheless, the relative orientation of pMHC and TCR is akin to that found in the SEB-dependent ternary complex. The affinities of TSST-1 for pMHC and TCR are 1 μM (Figure 4A) and 0.6 μM (Buonpane et al, 2005), respectively. The overall sub-micromolar affinity of the MHC–TSST-1–TCR complex is within the range exhibited by most pMHC–TCR interactions (Davis et al, 1998). Because it is intermediate to that of the SpeC- and SEB-dependent (in the absence of energetic cooperativity) T-cell signaling complexes, we determined whether allosteric effects could be transmitted energetically through the TSST-1 molecule, such that the overall affinity of the TSST-1-dependent ternary complex would be augmented relative to the sum of the individual bi-molecular interactions. This, however, is not the case, as the affinity of TSST-1 for pMHC in the absence (Figure 4A) or presence (Figure 4B) of a saturating concentration of TCR is unchanged. Thus, TSST-1 is able to efficiently activate T cells even though the overall affinity of the supramolecular complex that it forms with pMHC and TCR is weaker than that of the SpeC-dependent complex and lacks the cooperative energetics exhibited by the SEB-dependent complex.
Figure 4.
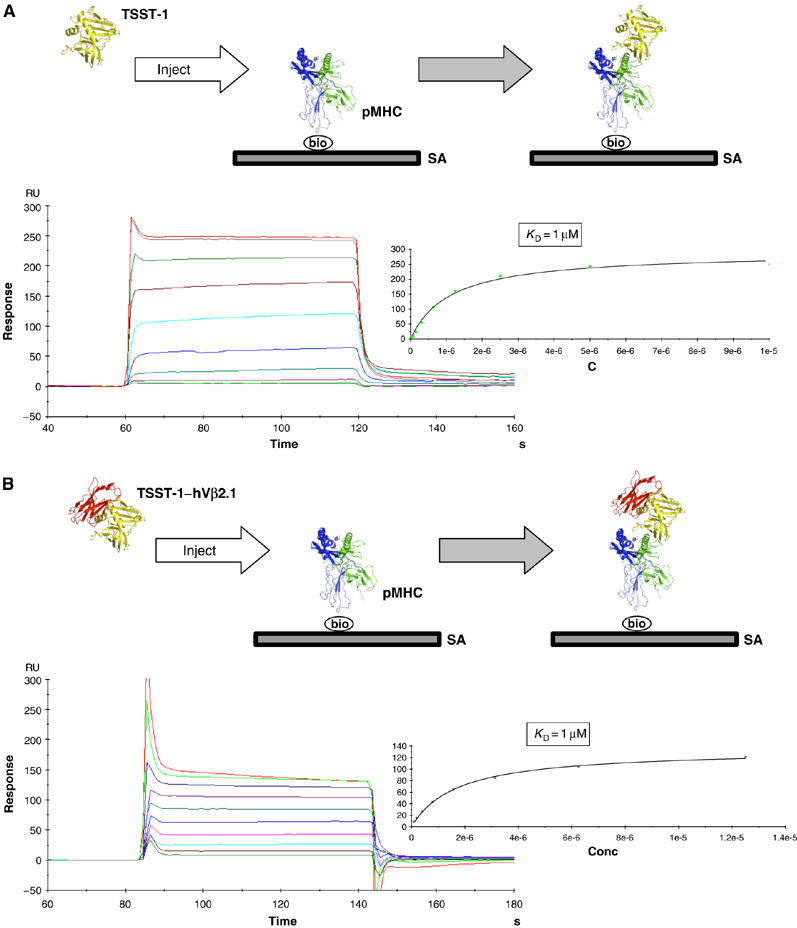
No through-SAG cooperativity exhibited in the TSST-1-dependent T-cell signaling complex. (A) SPR sensorgram of the interaction between TSST-1 and immobilized pMHC. Nonlinear regression analysis of maximal responses versus concentration is shown to the right of the sensorgram. The experimental design is depicted in the box at the top of the panel. (B) SPR sensorgram of the interaction the TSST-1–D10 complex and immobilized pMHC. Nonlinear regression analysis of maximal responses versus concentration is shown to the right of the sensorgram. The experimental design is depicted in the box at the top of the panel. SA, streptavidin; bio, biotin.
Structural changes that commonly drive affinity maturation are absent in the evolved TSST-1–hVβ2.1 complex
The structural changes that commonly accompany the affinity maturation of protein complexes include increased hydrogen bonds, van der Waals contacts, buried surface area, the proportion of apolar to polar buried surface area, as well as improved shape complementarity (Wedemayer et al, 1997a; Li et al, 2003; Cauerhff et al, 2004; De Genst et al, 2004). Although the wild-type model that we have generated is certainly less accurate than a high-resolution X-ray crystal structure of this complex, the starting model (i.e., the TSST-1–D10 crystal structure) is necessarily grossly similar in structure to the modeled complex, and the docking orientation of hVβ2.1 and TSST-1 has been independently verified by numerous mutational analyses (McCormick et al, 2003; Buonpane et al, 2005; Moza et al, 2006). A comparison of this model and the TSST-1–D10 crystal structure shows that in the 103-fold affinity maturation from the wild-type hVβ2.1 to D10, none of these biophysical factors normally associated with affinity maturation is substantially different (Table II). Only the proportion of apolar to polar surface area and shape complementarity are slightly elevated in the affinity-matured complex, relative to the wild-type interaction.
Table 2.
Molecular characteristics of TSST-1–hVβ2.1 complexes
| TSST-1–hVβ2.1 model | TSST-1–D10 | |
|---|---|---|
| Binding parameters | ||
| KD (M) | 6.0 × 10⁻⁷ | 1.8 × 10⁻¹⁰ |
| ΔΔGb (kcal/mol) | 0 | −5.16 |
| Intermolecular interactions | ||
| Hydrogen bonds | 16 | 16 |
| van der Waals contacts | 98 | 87 |
| Buried surface areas | ||
| ΔASAtotal (Å2) | 1917 | 1833 |
| ΔASApolar (Å2) | 982 | 888 |
| ΔASAapolar (Å2) | 935 | 945 |
| ΔASAapolar/ΔASAtotal (%) | 49 | 52 |
| Shape complementarity | ||
| SC | 0.63 | 0.71 |
In a structural study analyzing the affinity maturation of a germ line to hypersomatically mutated antibody (Li et al, 2003), the affinity for a protein antigen increased 36-fold and was ascribed to an increase in buried hydrophobic surface at the expense of polar surface, as well as improved shape complementarity. In this antibody affinity maturation process, an increase in the proportion of buried apolar surface area of 20% (ΔASAapolar=663 versus 820 Å2) and a somewhat elevated shape complementarity (SC=0.69 versus 0.78) were observed. These changes are quantitatively much greater than and roughly equivalent to, respectively, those observed in the wild-type hVβ2.1 to D10 affinity maturation process, which itself exhibits a significantly greater maturation of affinity (>3000-fold) for its binding partner. There is no indication, therefore, from changes in any of these parameters that D10 should bind TSST-1 with such an increased affinity relative to wild-type hVβ2.1.
TSST-1 targets a flexible TCR ligand
An additional biophysical effect observed previously to correlate with affinity maturation is the reduction of binding site plasticity, especially in the maturation of antibodies from germ line to hypersomatically mutated versions (Wedemayer et al, 1997b; Manivel et al, 2000; Yin et al, 2003). If the changes in intermolecular contacts, buried surface and/or shape complementarity are not the primary driving factor in the affinity maturation of hVβ2.1 to TSST-1, it is possible that altered conformational flexibility of the Vβ domain is the major determinant of this molecular evolution. Our previous analysis of this affinity maturation pathway (Moza et al, 2006) indicated that a significant proportion of the augmented affinity came about owing to positive cooperative energetics between mutations in the CDR2 and FR3 hot regions. We proposed that this cooperativity was the result of a dynamic structural network linking these two regions of the molecular interface.
A comparison of the structures of the residues spanning CDR2, the c″ β-strand and FR3 from independently determined structures, including the crystal structure of the TSST-1–D10 complex, the SpeC–hVβ2.1 complex (Sundberg et al, 2002a), and an autoimmune TCR–pMHC complex (Hahn et al, 2005), reveals significant conformational diversity in this portion of hVβ2.1 that comprises the majority of the molecular interface with TSST-1 (Figure 5A). The different main-chain conformations result in hydrogen bonds between the c′ and c″ β-strands that are altered in number, length and angle, as well as donor and acceptor contributing residues.
Figure 5.
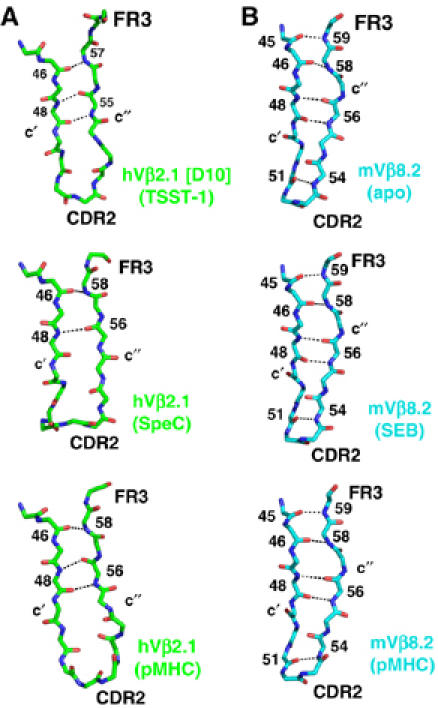
Relative conformational flexibility of the hVβ2.1-binding site for TSST-1. (A) Structure of the affinity-matured hVβ2.1 variant D10 in the region encompassing the c′ β-strand, CDR2, c″ β-strand and FR3 in complex with TSST-1 (top panel), or of the same region of wild-type hVβ2.1 in complex with SpeC (middle panel) or pMHC (bottom panel). (B) Structure of mVβ8.2 in the region encompassing the c′ β-strand, CDR2, c″ β-strand and FR3 either uncomplexed (top panel), in complex with SEB (middle panel) or with pMHC (bottom panel). Residues involved in main-chain hydrogen-bonding interactions that noncovalently bind the c′ and c″ β-strands together are indicated in each panel.
This structural divergence stands in stark contrast to other TCR Vβ domains, as exemplified by crystal structures of the murine Vβ8.2 domain by itself (Bentley et al, 1995) or in complex with SEB (Li et al, 1998) or pMHC (Garcia et al, 1998), in which this region of the TCR is essentially inflexible (Figure 5B). Hydrogen bonds between the c′ and c″ β-strands in these structures are, accordingly, unchanged. Furthermore, if the hVβ2.1 domain from the SpeC-hVβ2.1 co-crystal structure is simply superimposed with D10 in the D10–TSST-1 complex structure, significant steric clashes between hVβ2.1 residues (in particular, residue Y56, a known hot spot for TSST-1 binding; Buonpane et al, 2005) and TSST-1 are observed.
Although protein plasticity in this region of hVβ2.1 has been proposed to play a role in regulating cooperative energetics between the CDR2 and FR3 hot regions in a mutational analysis (Moza et al, 2006), flexibility may also be a requirement for wild-type TSST-1–hVβ2.1 complex formation. Several possibilities exist for how protein plasticity may contribute to the affinity maturation of this complex. For instance, if D10 is less flexible than wild-type hVβ2.1, and in its unbound form already in the proper conformation for binding TSST-1, its affinity could be relatively elevated. Conversely, D10 may require a greater degree of flexibility in order to adopt a conformation that is required for high-affinity binding and that cannot be attained by wild-type hVβ2.1. Determining the correlation between protein plasticity and affinity will require further structural data, as well as thermodynamic analysis. Whether SAGs discriminate between binding partners according to the relative flexibility, or rigidity, of the TCR target is presently unclear, but if this were the case, it would provide significant insight into SAG–TCR specificity and cross-reactivity specifically, as well as the mechanisms of molecular recognition between proteins generally.
Materials and methods
Protein expression, purification and crystallization
TSST-1 and D10, the affinity-matured variant of hVβ2.1, were expressed and purified as described (Moza et al, 2006). The TSST-1–D10 complex was crystallized by hanging drop vapor diffusion in 0.1 M sodium cacodylate, pH 6.5, 0.2 M magnesium acetate tetrahydrate and 20% polyethylene glycol 8000. HLA-DR4(CLIP) was prepared as described previously (Day et al, 2003).
Structure determination and refinement
A complete data set to a nominal resolution of 2.25 Å was collected at CHESS, beam line A-1 and processed using HKL2000 (Otwinowski and Minor, 1997). A molecular replacement solution was found using the program PHASER (Storoni et al, 2004) with TSST-1 (PDB accession code 2TSS) and hVβ2.1 (PDB accession code 1KTK) as search models. The structure was refined using CNS (Brunger et al, 1998) interspersed with manual model building in COOT (Emsley and Cowtan, 2004). Crystallographic data collection, processing and refinement statistics are listed in Table I. The atomic coordinates and structure factors for the TSST-1–D10 crystal structure have been deposited in the Protein Data Bank (PDB ID code 2IJ0).
Molecular modeling
The complex between TSST-1 and hVβ2.1 was modeled on the TSST-1–D10 crystal structure. The 13 residues that are mutated in D10 relative to wild-type hVβ2.1 were changed to the wild-type amino acids and allowed to adopt their preferred orientation in XTALVIEW (McRee, 1999). The resulting wild-type complex was then subjected to conjugate gradient minimization using CNS (Brunger et al, 1998). In this process, only those residues that comprised the binding site for TSST-1 (i.e., the contiguous residues at positions 50–64 in hVβ2.1) were allowed to adopt alternative conformations. The resulting energy-minimized model was inspected visually and rotamer conformations that best satisfied hydrogen bonding constraints and intermolecular contacts were chosen for each interface residue using XTALVIEW (McRee, 1999). Only the intermolecular contacts were refined, as described above, and not the orientation of the two molecules in the wild-type complex, as mutagenesis studies (Buonpane et al, 2005; Moza et al, 2006) have indicated no significant alteration of their relative orientation in TSST-1 complexes made with either D10 or wild-type hVβ2.1.
Binding analysis
Affinity measurements were made using a Biacore 3000 surface plasmon resonance (SPR) instrument (Biacore, Piscataway, NJ). Biotinylated HLA-DR4(CLIP) was immobilized on a streptavidin-coated sensor chip to an immobilization density of approximately 1000 response units. Biotinylated ephrin-B2 (R&D Systems, Minneapolis, MN) was immobilized to an equivalent density as a negative control surface. A concentration gradient of TSST-1 in the presence or absence of saturating levels of the hVβ2.1 variant D10 was injected over both surfaces and the net maximal responses were recorded for steady-state analysis. Affinity values were derived by nonequilibrium regression analysis using the BiaEvaluation 4.1 software (Biacore, Piscataway, NJ).
Acknowledgments
We thank the staff at the Cornell High Energy Synchrotron Source and Sebastian Günther for help with data collection. This work was supported in part by National Institutes of Health Grants AI064177 (to KWW), AI064611 (to DMK), AI55882 (to EJS) and T32 GM 07283 (to RAB), Canadian Institutes of Health Research Operating Grant MOP-64176 and New Investigator Award (to JKM), and a Boston Biomedical Research Institute Scholar Award (to BM).
References
- Andersen PS, Lavoie PM, Sekaly RP, Churchill H, Kranz DM, Schlievert PM, Karjalainen K, Mariuzza RA (1999) Role of the T cell receptor alpha chain in stabilizing TCR–superantigen–MHC class II complexes. Immunity 10: 473–483 [DOI] [PubMed] [Google Scholar]
- Andersen PS, Schuck P, Sundberg EJ, Geisler C, Karjalainen K, Mariuzza RA (2002) Quantifying the energetics of cooperativity in a ternary protein complex. Biochemistry 41: 5177–5184 [DOI] [PubMed] [Google Scholar]
- Bentley GA, Boulot G, Karjalainen K, Mariuzza RA (1995) Crystal structure of the beta chain of a T cell antigen receptor. Science 267: 1984–1987 [DOI] [PubMed] [Google Scholar]
- Bergdoll MS, Crass BA, Reiser RF, Robbins RN, Davis JP (1981) A new staphylococcal enterotoxin, enterotoxin F, associated with toxic-shock-syndrome Staphylococcus aureus isolates. Lancet 1: 1017–1021 [DOI] [PubMed] [Google Scholar]
- Brunger AT, Adams PD, Clore GM, DeLano WL, Gros P, Grosse-Kunstleve RW, Jiang JS, Kuszewski J, Nilges M, Pannu NS, Read RJ, Rice LM, Simonson T, Warren GL (1998) Crystallography and NMR system: a new software suite for macromolecular structure determination. Acta Crystallogr, D 54: 905–921 [DOI] [PubMed] [Google Scholar]
- Buonpane RA, Moza B, Sundberg EJ, Kranz DM (2005) Characterization of T cell receptors engineered for high affinity against toxic shock syndrome toxin-1. J Mol Biol 353: 308–321 [DOI] [PubMed] [Google Scholar]
- Cauerhff A, Goldbaum FA, Braden BC (2004) Structural mechanism for affinity maturation of an anti-lysozyme antibody. Proc Natl Acad Sci USA 101: 3539–3544 [DOI] [PMC free article] [PubMed] [Google Scholar]
- Cho S, Swaminathan CP, Yang J, Kerzic MC, Guan R, Kieke MC, Kranz DM, Mariuzza RA, Sundberg EJ (2005) Structural basis of affinity maturation and intramolecular cooperativity in a protein-protein interaction. Structure (Camb) 13: 1775–1787 [DOI] [PMC free article] [PubMed] [Google Scholar]
- Choi Y, Lafferty JA, Clements JR, Todd JK, Gelfand EW, Kappler J, Marrack P, Kotzin BL (1990) Selective expansion of T cells expressing V beta 2 in toxic shock syndrome. J Exp Med 172: 981–984 [DOI] [PMC free article] [PubMed] [Google Scholar]
- Choi YW, Kotzin B, Herron L, Callahan J, Marrack P, Kappler J (1989) Interaction of Staphylococcus aureus toxin ‘superantigens' with human T cells. Proc Natl Acad Sci USA 86: 8941–8945 [DOI] [PMC free article] [PubMed] [Google Scholar]
- Davis MM, Boniface JJ, Reich Z, Lyons D, Hampl J, Arden B, Chien Y (1998) Ligand recognition by alpha beta T cell receptors. Annu Rev Immunol 16: 523–544 [DOI] [PubMed] [Google Scholar]
- Day CL, Seth NP, Lucas M, Appel H, Gauthier L, Lauer GM, Robbins GK, Szczepiorkowski ZM, Casson DR, Chung RT, Bell S, Harcourt G, Walker BD, Klenerman P, Wucherpfennig KW (2003) Ex vivo analysis of human memory CD4 T cells specific for hepatitis C virus using MHC class II tetramers. J Clin Invest 112: 831–842 [DOI] [PMC free article] [PubMed] [Google Scholar]
- De Genst E, Handelberg F, Van Meirhaeghe A, Vynck S, Loris R, Wyns L, Muyldermans S (2004) Chemical basis for the affinity maturation of a camel single domain antibody. J Biol Chem 279: 53593–53601 [DOI] [PubMed] [Google Scholar]
- Emsley P, Cowtan K (2004) Coot: model-building tools for molecular graphics. Acta Crystallogr D 60: 2126–2132 [DOI] [PubMed] [Google Scholar]
- Fields BA, Malchiodi EL, Li H, Ysern X, Stauffacher CV, Schlievert PM, Karjalainen K, Mariuzza RA (1996) Crystal structure of a T-cell receptor beta-chain complexed with a superantigen. Nature 384: 188–192 [DOI] [PubMed] [Google Scholar]
- Garcia KC, Degano M, Pease LR, Huang M, Peterson PA, Teyton L, Wilson IA (1998) Structural basis of plasticity in T cell receptor recognition of a self peptide-MHC antigen. Science 279: 1166–1172 [DOI] [PubMed] [Google Scholar]
- Hahn M, Nicholson MJ, Pyrdol J, Wucherpfennig KW (2005) Unconventional topology of self peptide-major histocompatibility complex binding by a human autoimmune T cell receptor. Nat Immunol 6: 490–496 [DOI] [PMC free article] [PubMed] [Google Scholar]
- Hamad AR, Herman A, Marrack P, Kappler JW (1994) Monoclonal antibodies defining functional sites on the toxin superantigen staphylococcal enterotoxin B. J Exp Med 180: 615–621 [DOI] [PMC free article] [PubMed] [Google Scholar]
- Jardetzky TS, Brown JH, Gorga JC, Stern LJ, Urban RG, Chi YI, Stauffacher C, Strominger JL, Wiley DC (1994) Three-dimensional structure of a human class II histocompatibility molecule complexed with superantigen. Nature 368: 711–718 [DOI] [PubMed] [Google Scholar]
- Jo D, Liu D, Yao S, Collins RD, Hawiger J (2005) Intracellular protein therapy with SOCS3 inhibits inflammation and apoptosis. Nat Med 11: 892–898 [DOI] [PubMed] [Google Scholar]
- Kaul R, McGeer A, Norrby-Teglund A, Kotb M, Schwartz B, O'Rourke K, Talbot J, Low DE (1999) Intravenous immunoglobulin therapy for streptococcal toxic shock syndrome—a comparative observational study. The Canadian Streptococcal Study Group. Clin Infect Dis 28: 800–807 [DOI] [PubMed] [Google Scholar]
- Keskin O, Ma B, Nussinov R (2005) Hot regions in protein–protein interactions: the organization and contribution of structurally conserved hot spot residues. J Mol Biol 345: 1281–1294 [DOI] [PubMed] [Google Scholar]
- Kieke MC, Sundberg E, Shusta EV, Mariuzza RA, Wittrup KD, Kranz DM (2001) High affinity T cell receptors from yeast display libraries block T cell activation by superantigens. J Mol Biol 307: 1305–1315 [DOI] [PubMed] [Google Scholar]
- Kim J, Urban RG, Strominger JL, Wiley DC (1994) Toxic shock syndrome toxin-1 complexed with a class II major histocompatibility molecule HLA-DR1. Science 266: 1870–1874 [DOI] [PubMed] [Google Scholar]
- LeClaire RD, Bavari S (2001) Human antibodies to bacterial superantigens and their ability to inhibit T-cell activation and lethality. Antimicrob Agents Chemother 45: 460–463 [DOI] [PMC free article] [PubMed] [Google Scholar]
- Li H, Llera A, Tsuchiya D, Leder L, Ysern X, Schlievert PM, Karjalainen K, Mariuzza RA (1998) Three-dimensional structure of the complex between a T cell receptor beta chain and the superantigen staphylococcal enterotoxin B. Immunity 9: 807–816 [DOI] [PubMed] [Google Scholar]
- Li PL, Tiedemann RE, Moffat SL, Fraser JD (1997) The superantigen streptococcal pyrogenic exotoxin C (SPE-C) exhibits a novel mode of action. J Exp Med 186: 375–383 [DOI] [PMC free article] [PubMed] [Google Scholar]
- Li Y, Li H, Dimasi N, McCormick JK, Martin R, Schuck P, Schlievert PM, Mariuzza RA (2001) Crystal structure of a superantigen bound to the high-affinity, zinc-dependent site on MHC class II. Immunity 14: 93–104 [DOI] [PubMed] [Google Scholar]
- Li Y, Li H, Yang F, Smith-Gill SJ, Mariuzza RA (2003) X-ray snapshots of the maturation of an antibody response to a protein antigen. Nat Struct Biol 10: 482–488 [DOI] [PubMed] [Google Scholar]
- Malchiodi EL, Eisenstein E, Fields BA, Ohlendorf DH, Schlievert PM, Karjalainen K, Mariuzza RA (1995) Superantigen binding to a T cell receptor beta chain of known three- dimensional structure. J Exp Med 182: 1833–1845 [DOI] [PMC free article] [PubMed] [Google Scholar]
- Manivel V, Sahoo NC, Salunke DM, Rao KV (2000) Maturation of an antibody response is governed by modulations in flexibility of the antigen-combining site. Immunity 13: 611–620 [DOI] [PubMed] [Google Scholar]
- McCormick JK, Tripp TJ, Llera AS, Sundberg EJ, Dinges MM, Mariuzza RA, Schlievert PM (2003) Functional analysis of the TCR binding domain of toxic shock syndrome toxin-1 predicts further diversity in MHC class II/superantigen/TCR ternary complexes. J Immunol 171: 1385–1392 [DOI] [PubMed] [Google Scholar]
- McCormick JK, Yarwood JM, Schlievert PM (2001) Toxic shock syndrome and bacterial superantigens: an update. Annu Rev Microbiol 55: 77–104 [DOI] [PubMed] [Google Scholar]
- McRee DE (1999) XtalView/Xfit—a versatile program for manipulating atomic coordinates and electron density. J Struct Biol 125: 156–165 [DOI] [PubMed] [Google Scholar]
- Moza B, Buonpane RA, Zhu P, Herfst CA, Rahman AK, McCormick JK, Kranz DM, Sundberg EJ (2006) Long-range cooperative binding effects in a T cell receptor variable domain. Proc Natl Acad Sci USA 103: 9867–9872 [DOI] [PMC free article] [PubMed] [Google Scholar]
- Otwinowski Z, Minor W (1997) Processing X-ray diffraction data collected in oscillation mode. Methods Enzymol 276: 307–326 [DOI] [PubMed] [Google Scholar]
- Pang LT, Kum WW, Chow AW (2000) Inhibition of staphylococcal enterotoxin B-induced lymphocyte proliferation and tumor necrosis factor alpha secretion by MAb5, an anti-toxic shock syndrome toxin 1 monoclonal antibody. Infect Immun 68: 3261–3268 [DOI] [PMC free article] [PubMed] [Google Scholar]
- Prasad GS, Radhakrishnan R, Mitchell DT, Earhart CA, Dinges MM, Cook WJ, Schlievert PM, Ohlendorf DH (1997) Refined structures of three crystal forms of toxic shock syndrome toxin-1 and of a tetramutant with reduced activity. Protein Sci 6: 1220–1227 [DOI] [PMC free article] [PubMed] [Google Scholar]
- Rahman AKMN, Herfst CA, Moza B, Chau LA, Bueno C, Madrenas J, Sundberg EJ, McCormick JK (2006) Molecular basis of T cell receptor selectivity, cross-reactivity and allelic discrimination by a bacterial superantigen: integrative functional and energetic mapping of the SpeC–Vb2.1 molecular interface. J Immunol 177: 8595–8603 [DOI] [PubMed] [Google Scholar]
- Reichmann D, Rahat O, Albeck S, Meged R, Dym O, Schreiber G (2005) The modular architecture of protein–protein binding interfaces. Proc Natl Acad Sci USA 102: 57–62 [DOI] [PMC free article] [PubMed] [Google Scholar]
- Schlievert PM, Shands KN, Dan BB, Schmid GP, Nishimura RD (1981) Identification and characterization of an exotoxin from Staphylococcus aureus associated with toxic-shock syndrome. J Infect Dis 143: 509–516 [DOI] [PubMed] [Google Scholar]
- Storoni LC, McCoy AJ, Read RJ (2004) Likelihood-enhanced fast rotation functions. Acta Crystallogr D 60: 432–438 [DOI] [PubMed] [Google Scholar]
- Sundberg EJ, Li H, Llera AS, McCormick JK, Tormo J, Schlievert PM, Karjalainen K, Mariuzza RA (2002a) Structures of two streptococcal superantigens bound to TCR beta chains reveal diversity in the architecture of T cell signaling complexes. Structure 10: 687–699 [DOI] [PubMed] [Google Scholar]
- Sundberg EJ, Li Y, Mariuzza RA (2002b) So many ways of getting in the way: diversity in the molecular architecture of superantigen-dependent T-cell signaling complexes. Curr Opin Immunol 14: 36–44 [DOI] [PubMed] [Google Scholar]
- Wedemayer GJ, Patten PA, Wang LH, Schultz PG, Stevens RC (1997a) Structural insights into the evolution of an antibody combining site. Science 276: 1665–1669 [DOI] [PubMed] [Google Scholar]
- Wedemayer GJ, Wang LH, Patten PA, Schultz PG, Stevens RC (1997b) Crystal structures of the free and liganded form of an esterolytic catalytic antibody. J Mol Biol 268: 390–400 [DOI] [PubMed] [Google Scholar]
- Yang J, Swaminathan CP, Huang Y, Guan R, Cho S, Kieke MC, Kranz DM, Mariuzza RA, Sundberg EJ (2003) Dissecting cooperative and additive binding energetics in the affinity maturation pathway of a protein–protein interface. J Biol Chem 278: 50412–50421 [DOI] [PubMed] [Google Scholar]
- Yin J, Beuscher AE, Andryski SE, Stevens RC, Schultz PG (2003) Structural plasticity and the evolution of antibody affinity and specificity. J Mol Biol 330: 651–656 [DOI] [PubMed] [Google Scholar]