

Abstract
PPAR involvement in cell growth was investigated “in vivo” and “in vitro” and was correlated with cell proliferation and apoptotic death. “In vivo” PPARγ and α were evaluated in colon cancer specimens and adjacent nonneoplastic colonic mucosa. PPARγ increased in most cancer specimens versus mucosa, with a decrease in c-Myc and in PCNA proteins, suggesting that colon cancer growth is due to increased cell survival rather than increased proliferation. The prevalence of survival over proliferation was confirmed by Bcl-2 or Bcl-XL increase in cancer versus mucosa, and by decreased PPARα. “In vitro” PPARγ and PPARα were evaluated in human tumor and normal cell lines, treated with natural or synthetic ligands. PPARγ was involved in inhibiting cell proliferation with a decrease in c-Myc protein, whereas PPARα was involved in inducing apoptosis with modulation of Bcl-2 and Bad proteins. This involvement was confirmed using specific antagonists of two PPARs. Moreover, the results obtained on treating cell lines with PPAR ligands confirm observations in colon cancer: there is an inverse correlation between PPARα and Bcl-2 and between PPARγ and c-Myc.
1. INTRODUCTION
Nuclear receptors are attractive targets for novel therapeutic approaches to cancer. Treating malignant tumors by inducing cell differentiation is an attractive concept, but the clinical development of differentiation-inducing agents to treat malignant tumors, especially for solid tumors, has been limited to date [1].
Among the large group of nuclear receptors, a special place is occupied by peroxisome proliferator-activated receptors (PPARs), which are involved in controlling metabolism, growth, and immune and inflammatory responses [2]. In addition to these metabolic and anti-inflammatory properties, PPARs have been indicated as both tumor suppressors and tumor promoters [3, 4]. Upon activation by specific agonists, these receptors form dimers with RXR receptors and translocate to the nucleus, where they act as agonist-dependent transcription factors and regulate gene expression by binding to specific promoter regions of target genes [5, 6].
PPARγ is expressed in many cancers, including colon, breast, and prostate, and specific PPARγ agonists, such as thiazolidinediones, are generally considered antiproliferative in these settings [7]. However, although PPARγ acts as a tumor suppressor in colon cancer, colon tumors with mutations in the APC gene appear to be exceptions, since thiazolidinediones promote growth in these tumors [8, 9].
Less is known about the role of PPARα in human tumors. Generally, activation of this PPAR by exogenous agonists causes inhibition of tumor cell growth [10–12]. Among specific agonists of PPARα, fibrates, a widely used class of hypolipidemic drugs, act by modulating transcription of genes encoding proteins that control lipid transport and metabolism, and also exert pleiotropic anti-inflammatory effects by downregulating the expression of genes encoding inflammatory cytokines and acute-phase response proteins [13]. These combined actions translate into clinical benefits, as demonstrated by reduced cardiovascular morbidity and mortality in primary and secondary intervention trials [14].
The physiological and pharmacological roles of PPARβ (also referred to as PPARδ) are just beginning to emerge. It has recently become clear that PPARβ has a function in epithelial tissues, but inconsistent reports leave the situation controversial. There is strong evidence that activation of PPARβ by ligands such as di(2-ethylhexyl) phthalate can induce terminal differentiation of keratinocytes, with concomitant inhibition of cell proliferation [15, 16]. However, the role of PPARβ in keratinocyte-specific apoptosis is less clear, and its role in colonic epithelium is also unclear due to conflicting evidence suggesting that its ligand activation can both potentiate and attenuate intestinal cancer [16].
PPAR isoforms are receptors for several ligands, some of which are natural, such as PUFAs and their derivatives, while others are synthetic, such as the above-mentioned fibrates and phthalates. The ligands have different affinities for the receptors. All three isoforms can be activated by n-3 and n-6 PUFAs, although the affinity of PUFAs for the receptors varies, which suggests a role for site-specific availability and metabolism of particular fatty acids and differences in their affinities for specific PPAR subtypes [17].
Our interest is to demonstrate the different involvements of PPARs in cell growth, with particular attention to the carcinogenic process, and to correlate them to cell proliferation and death by apoptosis. Investigations have been carried out both “in vivo” and “in vitro.” “In vivo” PPAR protein content was evaluated in several colon cancer specimens from patients undergoing surgery to remove tumors. “In vitro” PPAR protein content was evaluated in the human lung-tumor A549 cell line and in the normal human proliferating NCTC 2544 cell line. These two cell lines were chosen because the first does not express PPARα, whereas the second does not express PPARγ. They thus appeared to be a good choice to show the importance of PPARγ and PPARα in cell proliferation and apoptosis. To induce PPARs, docosahexaenoic acid (DHA) was chosen as ligand for PPARγ and clofibrate for PPARα.
2. MATERIALS AND METHODS
2.1. Colon tissue samples
Specimens of colon cancer and adjacent nonneoplastic colonic mucosa were obtained from surgically excised material of 24 patients at the Oncological Center, Molinette Hospital, Turin, Italy. Adjacent connective tissue was in all cases stripped to eliminate fat contamination, and colonic cancer specimens were without nonneoplastic colon mucosa; specimens were immediately frozen and stored at −80°C.
2.2. Culture conditions
A549 human lung adenocarcinoma cells (ATCC, USA) were seeded (25 000 cells/cm2) and maintained for 24 hours in Ham's F-12K medium supplemented with 2 mM glutamine, 1% (v/v) antibiotic/antimycotic solution (medium A), and 10% (v/v) fetal bovine serum (FBS). Human keratinocyte NCTC 2544 cells (kind gift from Dr.Bassi, University of Genoa, Italy) were seeded (20 000 cells/cm2) in DMEM (low glucose medium) plus 2 mM glutamine, 1% (v/v) antibiotic/antimycotic solution, 1% nonessential amino acids, and 10% (v/v) fetal bovine serum. All cells were maintained at 37°C in a humidified atmosphere of 5% CO2 in air.
2.3. Treatment of A549 cells with docosahexaenoic acid
A stock solution of free fatty acid (100 mM in FBS) was prepared and stored at −20°C until use. Fatty acid was purchased from Sigma Chemical Co. (St. Louis, Mo).
Twenty four hours after cell seeding (time 0), culture medium was removed and replaced by medium B (medium A plus 0.4% serum bovine albumin (fatty-acid free), 1% ITS (insulin, transferrin, sodium selenite), 1% vitamin solution) supplemented or not with DHA. Stock solution of DHA was diluted to the final concentrations, reported in the figures, directly in medium B, used to replace medium A. FBS was added to control cells.
Forty eight hours after DHA addition, treated and control cells were trypsinized after collecting culture media, harvested and centrifuged at 600 g for 10 minutes to carry out the assays listed below.
2.4. Treatment of A549 cells with docosahexaenoic acid and PPARγ antagonist
Twenty four hours after cell seeding (time 0), culture medium was removed and replaced by medium B supplemented with 50 μM DHA and 10 μM GW9662. The cells were processed as explained above.
2.5. Treatment of NCTC 2544 with clofibrate
Twenty four hours after cell seeding, clofibrate dissolved in DMSO (maximum final concentration 0.05%) was added to cells at the concentrations reported in the figures. Solvent alone was added to control cells. At 24- or 48-hour treatment, the cells were trypsinized after collecting culture media, and centrifuged at 600 g for 10 minutes. Cells and culture media were used for the assays listed below.
2.6. Treatment of NCTC 2544 with clofibrate and PPARα antagonist
Twenty four hours after cell seeding, 250 μM clofibrate and 5 μM MK886 were added to cells. The cells were processed as explained above.
2.7. Cell proliferation
Cell proliferation was determined as by Martinasso et al. [15].
2.8. Apoptosis
Apoptosis was determined by evaluating the presence of a sub-G0/G1 peak in flow cytometric analysis as by Martinasso et al. [15], and by TUNEL staining. For flow cytometric analysis, briefly, cells were washed in PBS, fixed in ice-cold 70% ethanol for at least 30 minutes, incubated at room temperature in PBS containing DNase-free RNase (type II-A) and propidium iodide, respectively, at final concentrations of 0.4 and 0.18 mg/mL, and then analyzed with a FACScan flow cytometer (Becton & Dickinson, Mountain View, Calif, USA) equipped with a 488 nm argon laser and 2 filters, transmitting at 585 nm (FL2) and above 620 nm (FL3), respectively. Data were recorded on a Hewlett Packard computer (HP 9000, model 300), using CellFit software (Becton & Dickinson).
TUNEL staining was performed using the DeadEnd Colorimetric TUNEL System (Promega, Madison, Wis, USA) following the manufacturer's instructions.
2.9. Western blot analysis
For each specimen, about 50 mg of tissue were washed twice in cold PBS and then homogenized by sonication in 150 μL of lysis buffer (Totex buffer (pH 7.9) containing 20 mM Hepes, 350 mM NaCl, 20% glycerol, 1% NP-40 substitute, 1 mM MgCl2, 0.5 mM EDTA, 0.1 mM EGTA, 1 mM Na-orthovanadate, 1 mM phenyl methyl sulfonyl fluoride, 15 μg/mL leupeptin). The homogenates were kept on ice for 1 hour and then centrifuged in a microfuge at 13 500 rpm, for 25 minutes. Collected cells were washed twice in cold PBS, suspended to 50% (w/v) in the same lysis buffer, incubated in ice for 30 minutes, and sonicated. The homogenates were centrifuged in a microfuge at 12 000 rpm, for 10 minutes.
The supernatants containing the extracted proteins were then collected and used for Western blot analysis.
After SDS-polyacrylamide gel electrophoresis, the proteins were electrotransferred to a PVDF membrane, which was then blocked overnight with TBS containing 10% nonfat dried milk. The membranes were then rinsed and incubated with polyclonal anti-PPARγ, anti-PPARα, anti-PPARβ, anti-PCNA (proliferating cell nuclear antigen), anti-Bcl-2, or anti-Bcl-XL antibodies, with monoclonal anti-Bad, anti-c-Myc (all from Santa Cruz Biotechnology, Germany), or anti-β-actin antibodies (from Sigma Chemical Co., St. Louis, Mo, USA). Protein bands were visualized using a chemiluminescent detection system (Immun-Star HRP, Bio-Rad, Calif, USA).
2.10. Protein determination
Protein content was determined with the Protein Assay Kit 2 (Bio-Rad).
2.11. Statistical analysis
All data are expressed as means ± SD. The significance of differences between group means was assessed by variance analysis, followed by the Newman-Keuls test or by the student t test.
3. RESULTS
3.1. PPARγ and PPARα protein content in colon cancers
“In vivo” PPARγ and PPARα proteins content was evaluated in cancer specimens from patients undergoing surgery to remove colon tumors. Samples of adjacent nonneoplastic colonic mucosa from the same patients were also collected for comparison. In 19 of 24 patients, PPARγ protein content was higher in cancer specimens than in mucosa specimens, showing that PPARγ was generally increased in cancer versus mucosa (Figure 1(a)). Protein contents in each mucosa specimen were set arbitrarily to 1, and values relating to tumor specimens referred to the corresponding mucosa specimen.
Figure 1.


PPARγ, c-Myc, PCNA, PPARα, Bcl-2, and Bcl-XL protein contents in colon cancer specimens.Values are means ± SD of 19 patients for PPARγ, 20 patients for PCNA and c-Myc (a), 21 patients for PPARα, 13 patients for Bcl-2, and 18 patients for Bcl-XL (b). The densitometry value of each protein for each patient was normalized to the corresponding β-actin value and was expressed as related to that of the corresponding mucosa specimen, set arbitrarily to 1. ∗ t test, colon cancer versus nonneoplastic mucosa (P < .05).
The PPARγ increase was coupled with a decrease in c-Myc and in PCNA (Figure 1(a)), suggesting that colon cancer growth is due to increased survival rather than due to increased cell proliferation. In 20 of 24 patients, the protein content of c-Myc and of PCNA in cancer specimens was above that in mucosa specimens. The prevalence of cell survival over cell proliferation was confirmed by the increase of Bcl-2 or Bcl-XL, both antiapoptotic proteins, in cancer versus mucosa specimens, and by the decrease of PPARα (Figure 1(b)). PPARα was decreased in 21 patients, Bcl-2 was increased in 13 patients, and Bcl-XL was increased in 18 patients of 24 patients. Only in 2 patients were both Bcl-2 and Bcl-XL decreased. In all patients, an inverse correlation between PPARα and antiapoptotic proteins was observed. No univocal changes were observed for PPARβ (data not reported).
3.2. Apoptosis in colon cancers
Apoptosis was evaluated by TUNEL staining, as shown in Figure 2. In nonneoplastic colonic mucosa, a large number of TUNEL-positive nuclei were evident, whereas in cancer specimens the number of TUNEL-positive nuclei was lower than in corresponding mucosa.
Figure 2.

Apoptosis evaluated in mucosa and colon cancer by TUNEL staining.
3.3. PPAR protein contents in human cell lines
“In vitro” PPARγ, β and α protein contents were evaluated in tumor (lung adenocarcinoma A549) and normal (keratinocytes NCTC 2544) human cell lines, treated with natural or synthetic ligands (DHA or clofibrate). DHA was used as ligand of PPARγ, whereas clofibrate was used as specific ligand of PPARα.
Figure 3 shows the increase of protein content of PPARγ inversely correlated with the inhibition of cell proliferation, as evidenced by the decrease of cell numbers and of c-Myc in cells treated with PUFA at different concentrations for 48 hours in comparison with control cells. The protein content of PPARγ and c-Myc in treated cells referred to content of control cells, set arbitrarily to 1. No cells in apoptosis or in necrosis were found after treating A549 cells with this ligand (data not shown). With regard to PPARβ and α protein contents, in A549 cells only PPARβ was increased, as it is also shown in Figure 3(b), since PPARα was not expressed (data not shown).
Figure 3.

Cell growth, and PPARγ, PPARβ, and c-Myc protein contents, in human lung tumor A549 cells treated with DHA. (a) Cell growth: 24 hours after seeding, cells were treated with 50 μM of DHA for a further 48 hours. Control cells were treated with vehicle alone. The number of cells/cm2 counted in the monolayer is represented as mean ± SD of 3 experiments. (b) Protein content of PPARγ, PPARβ, and (c) c-Myc: protein content was determined by Western blot analysis. The densitometry value given for each protein referred to the corresponding β-actin value and was expressed by arbitrarily normalizing the control value to 1. Means with different letters are significantly different from one another (P < .05) as determined by analysis of variance followed by post hoc Newman-Keuls analysis.
PPARγ was also found to be involved in the signal transduction pathway inhibiting cell proliferation, for example in HepG2 treated with CLA and in A549 treated with arachidonic acid [18, 19].
PPARα has been reported to be involved in the signal transduction pathway inducing apoptosis [18, 20]. As Figure 4 shows, PPARα protein content (Figure 4(b)) was increased in NCTC 2544 cells treated with clofibrate, at different concentrations for 48 hours, in comparison with control cells; apoptosis increased in parallel (Figure 4(a)). PPARγ and β were also evaluated: the former was not expressed, whereas the latter (Figure 4(b)) was decreased by treatment with clofibrate.
Figure 4.

Apoptosis, and PPARα, PPARβ, Bcl-2, and Bad protein contents, in human keratinocytes NCTC 2544 treated with clofibrate. (a) Apoptosis: 24 hours after seeding, cells were treated with 250 μM clofibrate (CLOF) for a further 48 hours. Control cells were treated with vehicle alone. Apoptosis was determined by flow cytometric analysis. The percentages of apoptotic cells are presented as means ± SD of 3 experiments. (b) and (c) Protein content of PPARα, PPARβ, Bcl-2, and Bad: protein content was determined by Western blot analysis. The densitometry value given for each protein and for each patient referred to the corresponding β-actin value and was expressed by arbitrarily normalizing the control value to 1. Means with different letters are significantly different from one another (P < .05) as determined by analysis of variance followed by post hoc Newman-Keuls analysis. ∗ t test, treated cells versus untreated cells (P < .05).
Apoptosis was evaluated by flow cytofluorimetric analysis, and TUNEL staining was also carried out to confirm the presence of cells in apoptosis. Figure 5 shows that NCTC 2544 cells treated with 250 μM clofibrate were positive to TUNEL staining, indicating DNA fragmentation (Figure 5(b)); untreated cells (Figure 5(a)) were all negative to TUNEL staining.
Figure 5.
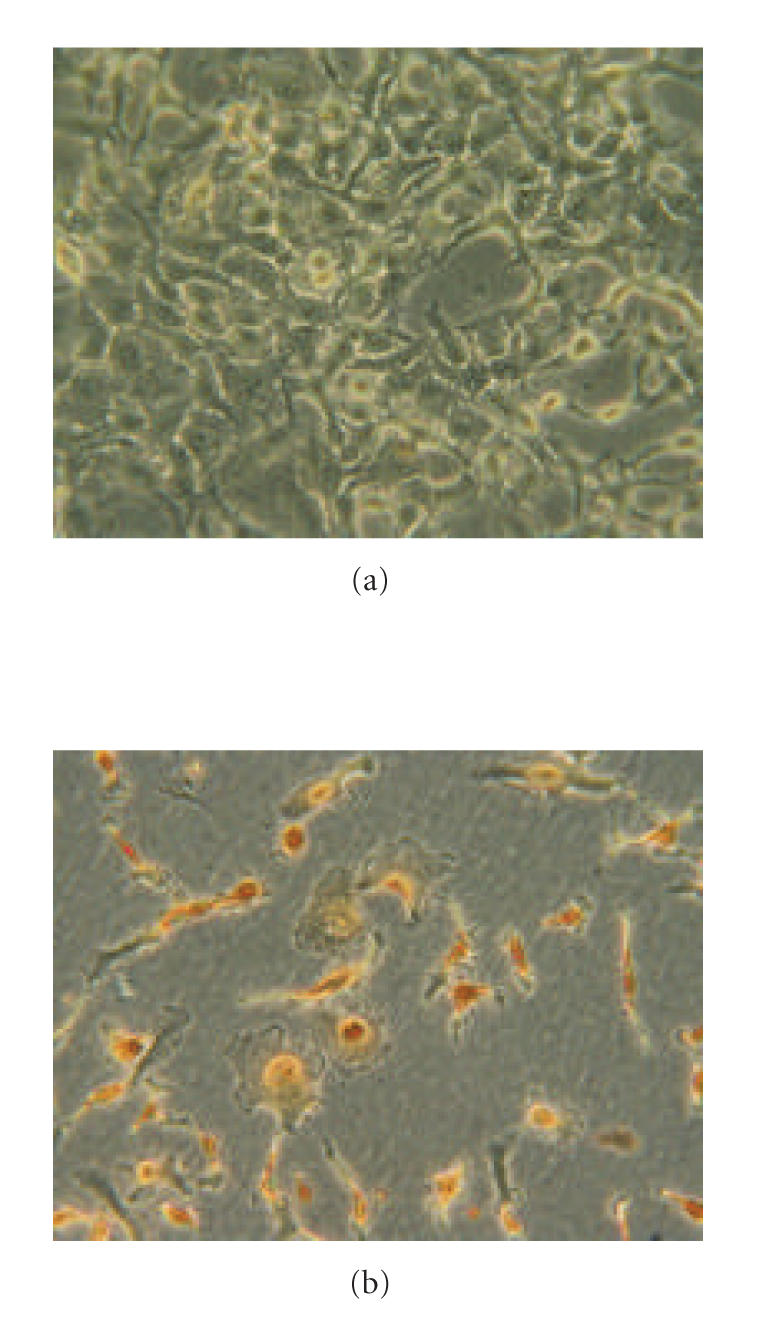
Apoptosis in human keratinocytes NCTC 2544 treated with clofibrate. Twenty four hours after seeding, cells were treated with 250 μM clofibrate for a further 48 hrs. Control cells were treated with vehicle alone. Apoptosis was determined by TUNEL staining. Panel A, control cells; Panel B, cells treated with clofibrate.
The increase in PPARα observed in NCTC 2544 cells (Figure 4) was accompanied by a decrease in Bcl-2 and by an increase in Bad (Figure 4(c)). The content of the different proteins in treated cells referred to the corresponding content in control cells, set arbitrarily to 1.
The concentrations of PUFA and fibrates were shown not to be cytotoxic, by determining the activity of lactate dehydrogenases in the medium; no increase of enzyme release occurred (data not shown).
3.4. Effect of PPARγ or PPARα antagonist on cell proliferation or apoptosis
To demonstrate the involvement of PPARs in cell proliferation or apoptosis, a specific antagonist for each PPAR studied was added to cells at the same time as the PPAR ligand.
Figure 6 shows that the PPARγ antagonist, GW9662, completely prevented the inhibition induced by DHA on A549 cell proliferation (Figure 6(a)), and that the PPARα antagonist, MK886, almost completely prevented the induction of apoptosis induced by clofibrate in NCTC 2544 cells (Figure 6(b)).
Figure 6.

Cell growth and apoptosis, respectively, in A549 and NCTC 2544 cells after treatment with antagonist and ligand of PPARs. (a) Cell growth in A549 cells: 24 hours after seeding, cells were treated with 50 μM of DHA and/or 10 μM GW9662 for a further 48 hours. Control cells were treated with vehicle alone. The number of cells/cm2 counted in the monolayer is represented as mean ± SD of 3 experiments. (b) Apoptosis in NCTC 2544 cells: 24 hours after seeding, cells were treated with 250 μM clofibrate (CLOF) and/or 5 μM MK886 for a further 48 hours. Control cells were treated with vehicle alone. Apoptosis was determined by flow cytometric analysis. The percentages of apoptotic cells are presented as means ± SD of 3 experiments. Means with different letters are significantly different from one another (P < .05) as determined by analysis of variance followed by post hoc Newman-Keuls analysis.
4. DISCUSSION
PPARs are transcription factors that may be involved in the modulation of cell proliferation and apoptosis; to strengthen this observation, their expression was evaluated “in vivo” in colon cancer and “in vitro” in human lung-tumor A549 cells and keratinocytes NCTC 2544. These cell lines were chosen, having previously been shown to lack, respectively, PPARα expression and PPARγ expression.
From our observations, it appears that PPARγ is correlated with an inhibition of cell proliferation that is not accompanied by any increase of apoptosis: in specimens of colon cancer from patients undergoing surgery, the expression of PPARγ was higher than in mucosa specimens. Together with this increase, reduced c-Myc and PCNA protein contents were observed, indicating lower cell proliferation in tumor than in mucosa specimens. PPARγ is overexpressed not only in colon cancer but also in other tumor types, such as in primary human lung tumors. The increased expression of PPARγ in these tumors versus the corresponding normal tissue has been demonstrated both by immunochemical staining and by Western blotting [21].
An increased PPARγ expression has also been reported in lung-tumor A549 cells, when cell proliferation was reduced by treating them with the PPAR ligand, DHA. Also in this case, the increase was accompanied by a reduction of c-Myc content compared to controls. At the PUFA concentrations used, neither necrosis nor apoptosis was evidenced. In these A549 cells treated with PUFA, the increase in PPARγ expression was paralleled by an increase in PPARβ, possibly indicating that this PPAR is also important, whereas the modification of PPARα was not significant, since it failed to occur in this type of cell.
In previous work, we reported the involvement of PPARγ in tumor-cell proliferation and differentiation in hepatoma and lung tumor cells [18, 19, 22–24]. Other groups have also determined this involvement: exposure of cultured human colorectal cancer cell lines to PPARγ agonists inhibits growth, associated with G1 cell cycle arrest, and it increases several markers of differentiation [25, 26]. Moreover, resveratrol has also been found to inhibit cell growth of both Caco-2 and HCT-116 cells in a dose- and time-dependent manners, inducing PPARγ and p38 MAPK [27]. Similarly, treatment of lung adenocarcinoma cells (A549) with troglitazone inhibits cell growth in a dose-dependent manner, due to inhibited cell proliferation [28]. The cell cycle profile reveals an arrest at G0-G1 with a concomitant downregulation of G0-G1 cyclins D and E. Similar to troglitazone, nonsteroidal anti-inflammatory drugs (NSAIDs) mediate cyclooxygenase-independent inhibition of lung cancer cell growth through PPARγ activation [29].
Unlike our work, others have found that PPARγ activation not only inhibits lung-cancer cell growth, increases cell differentiation, and induces cell-cycle arrest, but that it also induces apoptosis [30].
With regard to PPARα, the results reported here show that changes in the expression of this transcription factor are probably involved in modulating apoptosis. Determination of PPARα “in vivo” in specimens of colon cancer showed it to be decreased in comparison with mucosa specimens, alongside an increase in the antiapoptotic proteins Bcl-2 and Bcl-XL. It can be confirmed that the PPARα decrease and the antiapoptotic-protein increase are involved in reducing apoptosis by determining cells in apoptosis through TUNEL staining; this showed fewer stained nuclei in cancer specimens than in the corresponding mucosa. Other authors have also reported a significant decrease in PPARα expression in human tubular adenomas compared to normal human colonic epithelial cells, and this observation has raised interest in investigating PPARα as a therapeutic target to prevent adenoma formation [31]. PPARα and PPARγ ligands have also been shown to play a potential role in suppressing both hyperlipidemia and polyp formation in Apc gene-deficient mice, an animal model for human familial adenomatous polyposis [28].
To strengthen the hypothesis of the involvement of PPARα in apoptosis, tests were run on keratinocytes NCTC 2544, since they lack PPARγ. The specific PPARα ligand, clofibrate, induced apoptosis in these cells, the effect being accompanied by PPARα induction and modulation of apoptotic proteins.
In the tumor cell line SK-HEP-1 treated with PPARα ligands, such as CLA or Wy-14643, apoptosis was also induced accompanied by PPARα induction, Bcl-2 decrease, and Bad increase (see [18] and other data submitted for publication). Fibrates have also been demonstrated to induce apoptosis in glioblastoma cell lines [32] and in other hepatoma cells [33].
On the contrary, other studies have shown that activation of PPARα with Wy-14643 inhibited proliferation and migration of smooth muscle cells (SMCs) rather than inducing apoptosis. These results are supported by the finding that the PPARα ligand clofibrate, which is used clinically to reduce serum triglyceride levels, as well as the ligand GW7647, prevented DNA synthesis by SMCs [34].
Unlike our results, others have reported that rodents develop tumors in response to exposure to a wide range of PPARα ligands, suggesting that the causal events are activation of PPARα, increase of cell proliferation, and inhibition of apoptosis. However, the same study found that human cells are not susceptible to these effects [35, 36].
The induction of apoptosis in NCTC 2544 cells was accompanied, alongside the increased expression of PPARα, also by decreased PPARβ expression. These results are in agreement with the finding that PPARβ is involved in cell survival [37].
The involvement of PPARγ especially in cell proliferation, and of PPARα especially in apoptosis, was demonstrated by using specific antagonists, which had the effect, respectively, of preventing inhibition of cell proliferation by DHA, and of preventing induction of apoptosis by clofibrate.
The reason for the different effects of PPAR ligands, that is, decrease of cell proliferation in some tumor cells inducing PPARγ, or induction of apoptosis in others inducing PPARα, is not yet clear. Moreover, the results obtained on treating cell lines with PPAR ligands confirm observations in colon cancer: there is an inverse correlation between PPARα and Bcl-2 and between PPARγ and c-Myc.
ACKNOWLEDGMENTS
This work was supported by grants from Compagnia di San Paolo, Regione Piemonte, and University of Turin, Italy.
References
- 1.Kawamata H, Tachibana M, Fujimori T, Imai Y. Differentiation-inducing therapy for solid tumors. Current Pharmaceutical Design. 2006;12(3):379–385. doi: 10.2174/138161206775201947. [DOI] [PubMed] [Google Scholar]
- 2.Chinetti G, Fruchart J-C, Staels B. Peroxisome proliferator-activated receptors (PPARs): nuclear receptors at the crossroads between lipid metabolism and inflammation. Inflammation Research. 2000;49(10):497–505. doi: 10.1007/s000110050622. [DOI] [PubMed] [Google Scholar]
- 3.Girnun GD, Smith WM, Drori S, et al. APC-dependent suppression of colon carcinogenesis by PPARγ . Proceedings of the National Academy of Sciences of the United States of America. 2002;99(21):13771–13776. doi: 10.1073/pnas.162480299. [DOI] [PMC free article] [PubMed] [Google Scholar]
- 4.Gupta RA, DuBois RN. Controversy: PPARγ as a target for treatment of colorectal cancer. American Journal of Physiology. Gastrointestinal and Liver Physiology. 2002;283(2):G266–G269. doi: 10.1152/ajpgi.00486.2001. [DOI] [PubMed] [Google Scholar]
- 5.Bernando A, Minghetti L. PPAR-γ agonists as regulators of microglial activation and brain inflammation. Current Pharmaceutical Design. 2006;12(1):93–109. doi: 10.2174/138161206780574579. [DOI] [PubMed] [Google Scholar]
- 6.Kostadinova R, Wahli W, Michalik L. PPARs in diseases: control mechanisms of inflammation. Current Medicinal Chemistry. 2005;12(25):2995–3009. doi: 10.2174/092986705774462905. [DOI] [PubMed] [Google Scholar]
- 7.Wang T, Xu J, Yu X, Yang R, Han ZC. Peroxisome proliferator-activated receptor γ in malignant diseases. Critical Reviews in Oncology/Hematology. 2006;58(1):1–14. doi: 10.1016/j.critrevonc.2005.08.011. [DOI] [PubMed] [Google Scholar]
- 8.Yang K, Fan K-H, Lamprecht SA, et al. Peroxisome proliferator-activated receptor γ agonist troglitazone induces colon tumors in normal C57BL/6J mice and enhances colonic carcinogenesis in Apc1638 N/+ Mlh1+/- double mutant mice. International Journal of Cancer. 2005;116(4):495–499. doi: 10.1002/ijc.21018. [DOI] [PubMed] [Google Scholar]
- 9.Lehrke M, Lazar MA. The many faces of PPARγ . Cell. 2005;123(6):993–999. doi: 10.1016/j.cell.2005.11.026. [DOI] [PubMed] [Google Scholar]
- 10.Grau R, Punzón C, Fresno M, Iñiguez MA. Peroxisome-proliferator-activated receptor α agonists inhibit cyclo-oxygenase 2 and vascular endothelial growth factor transcriptional activation in human colorectal carcinoma cells via inhibition of activator protein-1. Biochemical Journal. 2006;395(1):81–88. doi: 10.1042/BJ20050964. [DOI] [PMC free article] [PubMed] [Google Scholar]
- 11.Grabacka M, Plonka PM, Urbanska K, Reiss K. Peroxisome proliferator-activated receptor α activation decreases metastatic potential of melanoma cells in vitro via down-regulation of Akt. Clinical Cancer Research. 2006;12(10):3028–3036. doi: 10.1158/1078-0432.CCR-05-2556. [DOI] [PubMed] [Google Scholar]
- 12.Strakova N, Ehrmann J, Bartos J, Malikova J, Dolezel J, Kolar Z. Peroxisome proliferator-activated receptors (PPAR) agonists affect cell viability, apoptosis and expression of cell cycle related proteins in cell lines of glial brain tumors. Neoplasma. 2005;52(2):126–136. [PubMed] [Google Scholar]
- 13.Kota BP, Huang TH-W, Roufogalis BD. An overview on biological mechanisms of PPARs. Pharmacological Research. 2005;51(2):85–94. doi: 10.1016/j.phrs.2004.07.012. [DOI] [PubMed] [Google Scholar]
- 14.Cunard R. The potential use of PPARα agonists as immunosuppressive agents. Current Opinion in Investigational Drugs. 2005;6(5):467–472. [PubMed] [Google Scholar]
- 15.Martinasso G, Maggiora M, Trombetta A, Canuto RA, Muzio G. Effects of di(2-ethylhexyl) phthalate, a widely used peroxisome proliferator and plasticizer, on cell growth in the human keratinocyte cell line NCTC 2544. Journal of Toxicology and Environmental Health, Part A. 2006;69(5):353–365. doi: 10.1080/15287390500227522. [DOI] [PubMed] [Google Scholar]
- 16.Burdick AD, Kim DJ, Peraza MA, Gonzalez FJ, Peters JM. The role of peroxisome proliferator-activated receptor-β/δ in epithelial cell growth and differentiation. Cellular Signalling. 2006;18(1):9–20. doi: 10.1016/j.cellsig.2005.07.009. [DOI] [PubMed] [Google Scholar]
- 17.Sampath H, Ntambi JM. Polyunsaturated fatty acid regulation of genes of lipid metabolism. Annual Review of Nutrition. 2005;25:317–340. doi: 10.1146/annurev.nutr.25.051804.101917. [DOI] [PubMed] [Google Scholar]
- 18.Maggiora M, Bologna M, Cerù MP, et al. An overview of the effect of linoleic and conjugated-linoleic acids on the growth of several human tumor cell lines. International Journal of Cancer. 2004;112(6):909–919. doi: 10.1002/ijc.20519. [DOI] [PubMed] [Google Scholar]
- 19.Muzio G, Trombetta A, Maggiora M, et al. Arachidonic acid suppresses growth of human lung tumor A549 cells through down-regulation of ALDH3A1 expression. Free Radical Biology and Medicine. 2006;40(11):1929–1938. doi: 10.1016/j.freeradbiomed.2006.01.020. [DOI] [PubMed] [Google Scholar]
- 20.Muzio G, Martinasso G, Trombetta A, Di Simone D, Canuto RA, Maggiora M. HMG-CoA reductase and PPARα are involved in clofibrate-induced apoptosis in human keratinocytes. Apoptosis. 2006;11(2):265–275. doi: 10.1007/s10495-006-3559-y. [DOI] [PubMed] [Google Scholar]
- 21.Keshamouni VG, Reddy RC, Arenberg DA, et al. Peroxisome proliferator-activated receptor-γ activation inhibits tumor progression in non-small-cell lung cancer. Oncogene. 2004;23(1):100–108. doi: 10.1038/sj.onc.1206885. [DOI] [PubMed] [Google Scholar]
- 22.Muzio G, Maggiora M, Trombetta A, et al. Mechanisms involved in growth inhibition induced by clofibrate in hepatoma cells. Toxicology. 2003;187(2-3):149–159. doi: 10.1016/s0300-483x(03)00055-6. [DOI] [PubMed] [Google Scholar]
- 23.Canuto RA, Maggiora M, Trombetta A, Martinasso G, Muzio G. Aldehyde dehydrogenase 3 expression is decreased by clofibrate via PPAR gamma induction in JM2 rat hepatoma cell line. Chemico-Biological Interactions. 2003;143-144:29–35. doi: 10.1016/s0009-2797(02)00169-2. [DOI] [PubMed] [Google Scholar]
- 24.Canuto RA, Ferro M, Salvo RA, et al. Increase in class 2 aldehyde dehydrogenase expression by arachidonic acid in rat hepatoma cells. Biochemical Journal. 2001;357(3):811–818. doi: 10.1042/0264-6021:3570811. [DOI] [PMC free article] [PubMed] [Google Scholar]
- 25.Brockman JA, Gupta RA, DuBois RN. Activation of PPARγ leads to inhibition of anchorage-independent growth of human colorectal cancer cells. Gastroenterology. 1998;115(5):1049–1055. doi: 10.1016/s0016-5085(98)70072-1. [DOI] [PubMed] [Google Scholar]
- 26.Gupta RA, Brockman JA, Sarraf P, Willson TM, DuBois RN. Target genes of peroxisome proliferator-activated receptor γ in colorectal cancer cells. Journal of Biological Chemistry. 2001;276(32):29681–29687. doi: 10.1074/jbc.M103779200. [DOI] [PubMed] [Google Scholar]
- 27.Ulrich S, Loitsch SM, Rau O, et al. Peroxisome proliferator-activated receptor γ as a molecular target of resveratrol-induced modulation of polyamine metabolism. Cancer Research. 2006;66(14):7348–7354. doi: 10.1158/0008-5472.CAN-05-2777. [DOI] [PubMed] [Google Scholar]
- 28.Mutoh M, Niho N, Wakabayashi K. Concomitant suppression of hyperlipidemia and intestinal polyp formation by increasing lipoprotein lipase activity in Apc-deficient mice. Biological Chemistry. 2006;387(4):381–385. doi: 10.1515/BC.2006.051. [DOI] [PubMed] [Google Scholar]
- 29.Li M-Y, Lee TW, Yim APC, Chen GG. Function of PPARγ and its ligands in lung cancer. Critical Reviews in Clinical Laboratory Sciences. 2006;43(2):183–202. doi: 10.1080/10408360600552587. [DOI] [PubMed] [Google Scholar]
- 30.Chang T-H, Szabo E. Induction of differentiation and apoptosis by ligands of peroxisome proliferator-activated receptor γ in non-small cell lung cancer. Cancer Research. 2000;60(4):1129–1138. [PubMed] [Google Scholar]
- 31.Matthiessen MW, Pedersen G, Albrektsen T, Adamsen S, Fleckner J, Brynskov J. Peroxisome proliferator-activated receptor expression and activation in normal human colonic epithelial cells and tubular adenomas. Scandinavian Journal of Gastroenterology. 2005;40(2):198–205. doi: 10.1080/00365520410009573. [DOI] [PubMed] [Google Scholar]
- 32.Strakova N, Ehrmann J, Bartos J, Malikova J, Dolezel J, Kolar Z. Peroxisome proliferator-activated receptors (PPAR) agonists affect cell viability, apoptosis and expression of cell cycle related proteins in cell lines of glial brain tumors. Neoplasma. 2005;52(2):126–136. [PubMed] [Google Scholar]
- 33.Clemencet M-C, Muzio G, Trombetta A, et al. Differences in cell proliferation in rodent and human hepatic derived cell lines exposed to ciprofibrate. Cancer Letters. 2005;222(2):217–226. doi: 10.1016/j.canlet.2004.09.016. [DOI] [PubMed] [Google Scholar]
- 34.Zahradka P, Wright B, Fuerst M, Yurkova N, Molnar K, Taylor CG. Peroxisome proliferator-activated receptor α and γ ligands differentially affect smooth muscle cell proliferation and migration. Journal of Pharmacology and Experimental Therapeutics. 2006;317(2):651–659. doi: 10.1124/jpet.105.096271. [DOI] [PubMed] [Google Scholar]
- 35.Roberts RA, Chevalier S, Hasmall SC, James NH, Cosulich SC, Macdonald N. PPARα and the regulation of cell division and apoptosis. Toxicology. 2002;181-182:167–170. doi: 10.1016/s0300-483x(02)00275-5. [DOI] [PubMed] [Google Scholar]
- 36.Klaunig JE, Babich MA, Baetcke KP, et al. PPARα agonist-induced rodent tumors: modes of action and human relevance. Critical Reviews in Toxicology. 2003;33(6):655–780. doi: 10.1080/713608372. [DOI] [PubMed] [Google Scholar]
- 37.Icre G, Wahli W, Michalik L. Functions of the peroxisome proliferator-activated receptor (PPAR) α and β in skin homeostasis, epithelial repair, and morphogenesis. Journal of Investigative Dermatology. 2006;126:30–35. doi: 10.1038/sj.jidsymp.5650007. [DOI] [PubMed] [Google Scholar]