

Abstract
The Goto-Kakizaki (GK) rat is a spontaneously diabetic animal model of non-insulin-dependent diabetes mellitus, which is characterized by progressive loss of β cells in the pancreatic islets with fibrosis. In the present study, we examined the effects of sucrose feeding on the islet pathology in this model. Six-week-old GK rats were fed with 30% sucrose for 6 weeks to induce severe hyperglycemia, and their condition was compared with that of nontreated rats. Age-matched normal Wistar rats were also given sucrose for the same periods and used for comparison. The sucrose-treated GK rats showed elevated blood glucose levels on oral glucose tolerance tests at 60 minutes and 120 minutes, representing 123% and 127% of values in untreated GK rats, respectively. At the end of the study, the mean β-cell volume density in GK rats was 50% less than that in untreated Wistar rats. Sucrose feeding further reduced the volume densities of β cells to only 50% of the levels of age-matched GK rats. Apoptotic cells were found in islet β cells only in GK rats fed sucrose (mean 0.067%). There appeared to be more islets that immunohistochemically stained strongly positive with 8-hydroxy-deoxyguanosine as a marker of oxidative damage of DNA in GK rats fed sucrose compared with those not given sucrose. GK rats not fed sucrose showed significantly lower proliferative activity of β cells measured by 5-bromo-2′-deoxyuridine uptake and intensified expression of Bcl-2 immunoreactivities at 6 weeks of age compared with those in age-matched Wistar rats. These two indices were reduced in both GK and Wistar rats with increasing age and were not affected by sucrose feeding in either group. The present study thus indicated that sucrose feeding promoted the apoptosis of β cells in GK rats through increased oxidative stress without altering their proliferative activity.
Non-insulin-dependent diabetes mellitus (NIDDM) is a hyperglycemic syndrome mediated mainly by insulin resistance and impaired insulin secretion. 1,2 In line with its heterogeneous etiology, the pathological lesions of pancreatic islets are not uniform in NIDDM. Whereas some autopsy studies have reported decreased islet β-cell mass in NIDDM patients, others have failed to detect significant changes in the islet cell population. 3-6 It is also unclear whether histopathological changes in islets described as β-cell loss or islet hyalinization are the primary cause for hyperglycemia or whether they occur as a consequence of metabolic alterations. 6,7
The Goto-Kakizaki (GK) rat is a spontaneous animal model of NIDDM without obesity. 8 This model was produced by repeated selective breeding of rats with glucose intolerance starting from a nondiabetic Wistar rat colony. 8 The GK rats exhibit mild hyperglycemia at fast and an impaired glucose tolerance on glucose load. 9-11 With progression of the disease, this diabetic model develops characteristic complication-like tissue damage in the peripheral nerves as well as kidneys, recapitulating systemic manifestations encountered in human NIDDM. 8 The exploration of islet changes in this model is, therefore, extremely important to clarifying the pathogenesis of human NIDDM.
Histopathological changes in the endocrine pancreas in GK rats include irregular shape, fibrosis, and progressive depletion of islet β cells commencing at 8 weeks of age in the Stockholm colony 8,12 or, soon after birth, at 4 days of age in the Paris colony. 13,14 In our preceding studies, we found islet-cell degeneration and reduction of islet β-cell volume in GK rats of the Japanese colony from 8 weeks of age, which had further progressed with aging. 15 We also found that the reduction of β-cell volume was inhibited by the correction of hyperglycemia with the administration of α-glucosidase inhibitor. 15 These results led us to hypothesize that glucose toxicity (continuous hyperglycemia) may accelerate β-cell reduction in GK rats. To explore the mechanisms of progressive loss of islet β cells in GK rats, we examined whether continuous elevation of hyperglycemia under sucrose feeding accelerates the depletion of pancreatic β cells and whether the β-cell loss is related to oxidative stress, proliferative activity, and oncogenic expression of Bcl-2 and Bax.
Materials and Methods
Animals
GK rats were obtained from the colony bred in the Takeda Research Institute (Takeda Chemical Industries, Ltd., Osaka, Japan), which originated from the colony at Tohoku University. 8 Nondiabetic Wistar rats were obtained from the same laboratory and used as controls. All animals had free access to tap water and standard rat chow (Oriental Yeast, Tokyo, Japan) until the experiment. At 6 weeks of age, both GK rats and control Wistar rats were randomly allocated to one of two groups, with and without sucrose feeding. For treatment groups, 30% sucrose in drinking water (w/v) was given for 2 and 6 weeks after 6 weeks of age.
During the experimental period, body weights and nonfasting blood glucose concentrations were regularly measured. Blood samples were obtained by tail snipping, and nonfasting blood glucose values were determined by the glucose oxidase method (Toecho Super II, Kagawa, Japan). An oral glucose tolerance test was performed at 6, 8, and 12 weeks of age. To examine the proliferative activity of the islet cells, rats were fasted overnight and injected intraperitoneally with 5-bromo-2′-deoxyuridine (BrdU) (Boehringer Mannheim GmbH, Mannheim, Germany) dissolved in phosphate-buffered saline at a dose of 100 mg/kg body weight. 16 After 4 hours, the pancreata were dissected free from adjacent tissues under deep anesthesia with 50 mg/kg pentobarbital (Abbott Laboratories, Chicago, IL). The whole pancreas was cleared of extraneous fat and lymph nodes and weighed. All specimens surgically obtained were fixed in 10% formalin solution and embedded in paraffin.
Glucose Tolerance Test and Fasting Plasma Insulin Levels
After an overnight fast, all animals were orally given a glucose solution (2 g/kg body weight), and their blood glucose levels were determined from the tail blood at 0, 30, 60, and 120 minutes afterwards with the glucose oxidase method using Toecho Super II. Levels of immunoreactive insulin in the plasma during fasting were estimated using an insulin kit (Morinaga, Yokohama, Japan).
Immunohistochemistry and Morphometry of Islet β and α Cells
After reviewing the slides stained with hematoxylin and eosin, contiguous paraffin sections 4 μm thick were prepared for immunocytochemical staining and morphometric analysis of islet β and α cells. To identify the areas of α and β cells in the islets, immunoperoxidase double staining was performed using the Histostain DS kit (Zymed Laboratories, San Francisco, CA). Briefly, deparaffinized sections were first incubated with rabbit anti-glucagon antibody (diluted 1:2000, raised in our laboratory) for 1 hour at room temperature preceded by inhibition of endogenous peroxidase activity with 0.3% hydrogen peroxide for 30 minutes. Then, the slides were incubated at room temperature with biotinylated anti-rabbit immunoglobulin antibody and alkaline phosphatase-conjugated streptavidin for 30 minutes in each. The alkaline phosphatase reaction was detected by a new fuchsin method using naphthol-AS-BI-phosphate (Sigma Chemical Co., St. Louis, MO) as a substrate and hexazotized new fuchsin (Sigma Chemical Co.) as a coupler. Before the incubation of the second antigen detection, the sections were treated with double staining enhancer (Zymed Laboratories) for 30 minutes at room temperature. After rinsing with phosphate-buffered saline, followed by treatment with normal goat serum for 15 minutes, the sections were incubated with rabbit anti-insulin antibody (1:200, raised in our laboratory) for 1 hour at 37°C. They were incubated again with biotinylated immunoglobulin and peroxidase-conjugated streptavidin (Histofine, Nichirei, Tokyo, Japan). Finally, the secondary reaction products were visualized with nickel-diaminobenzidine (0.02% 3,3′-diaminobenzidine (Wako, Osaka, Japan), 0.05% NiCl2, and 0.03% H2O2). Nuclei were counterstained lightly with hematoxylin.
Quantitative evaluation of the islet cell areas was performed using a computer-assisted point-counting method on an Olympus AX80 microscope connected to a personal computer system using NIH Image (version 1.56). Calculation of the volume density of α and β cells with the point-counting method was based on previously described methods. 4,17 First, even distribution of islets was confirmed, and fields for morphometric analysis were randomly selected in all experimental animals. A high-magnification (×200) image of double immunostaining sections was overlaid with a grid consisting of 875 points. In each animal, 25 to 80 fields (average, 45) were subjected for the quantitation of endocrine cells. Total number of the points hit on β or α cells ranged from 21,875 to 70,000 (average, 40,000). Volume densities of β and α cells were determined by division of total points hit on insulin- or glucagon-stained cells divided by total points hit on pancreatic parenchyma, respectively. Areas of blood vessels, nerves, fat, and connective tissues were excluded from the measurement. During the process of morphometric analysis, the identity of the samples was masked to the examiners.
Proliferative Activity of Pancreatic β Cells
To examine proliferative activity of β cells, BrdU-insulin double immunostaining was carried out. First, deparaffinized sections were incubated with rabbit anti-insulin antibody (1:200) for 1 hour at 37°C, followed by incubation with the second biotinylated rabbit immunoglobulin and then with alkaline phosphatase-conjugated streptavidin. After visualization with naphthol AS-BI phosphate and a thorough rinsing with phosphate-buffered saline, the sections were treated with microwave irradiation (H2500 microwave processor, Bio-Rad Laboratories, Hercules, CA) in 0.01 mol/L citrate buffer (pH 6.0) for antigen retrieval. They were then treated with pepsin in 0.1 N HCl (50 mg/ml, Sigma Chemical Co.) for 30 minutes at 37°C. The sections were finally incubated with monoclonal antibody to BrdU (diluted 1:1, Zymed Laboratories) overnight at 4°C, followed by incubation with the second biotinylated mouse immunoglobulin and third peroxidase-conjugated streptavidin and visualized with nickel-diaminobenzidine as described above. In each section, the number of positive cells among approximately 4000 insulin-positive cells (BrdU/insulin index) were counted at high magnification (×400) as an index of proliferative activity and are expressed as a percentage.
In Situ Detection of Apoptotic Cells
The deparaffinized sections were incubated with the terminal deoxynucleotide transferase-mediated nick end labeling (TUNEL) method using the ApopTag in situ apoptosis detection kit (Oncor, Inc., Gaithersburg, MD). 18 After visualization of apoptotic cells with nickel-diaminobenzidine, immunostaining for insulin was performed as described above. The cells showing black nuclei and red cytoplasm were defined as apoptotic β cells. In each sample, the number of apoptotic cells among approximately 4000 cells as an apoptotic index (TUNEL/insulin index) was counted at a high magnification (×400) and is expressed as a percentage.
Immunostaining of 8-Hydroxy-Deoxyguanosine, Bcl-2, and Bax
To evaluate the location of oxidative stress, the deparaffinized sections were incubated with monoclonal antibody to 8-hydroxy-deoxyguanosine (8-OH-dG; diluted 1:1; Jika, Shizuoka, Japan) using a catalyzed signal amplification system (DAKO, Tokyo, Japan). 19 For the detection of apoptosis-related oncogenic proteins, the deparaffinized sections were treated with microwave irradiation in 0.01 mol/L citrate buffer (pH 6.0) for antigen retrieval. The sections were first incubated with antibodies to 8-OH-dG. For the detection of Bcl-2 and Bax, the sections were first incubated with antibodies to Bcl-2 (diluted 1:50, Santa Cruz Biotech, Inc., Santa Cruz, CA) or Bax (diluted 1:50; Santa Cruz) overnight at 4°C, followed by incubation with the second biotinylated rabbit immunoglobulin and third alkaline phosphatase-conjugated streptavidin as described above. The reactions were colorized with new fuchsin. The immunoreactions of Bcl-2 and Bax were similar in most of the islets in each animal, and intensity of the Bcl-2 staining reaction on the islet was graded semiquantitatively, as follows: −, negative; +, weakly positive (lightly stained but clearly differentiated from negative background); 2+, moderately positive (between weak and strong); and 3+, strongly positive (bright red with high contrast).
Statistical Analysis
Results are expressed as means ± SD. Comparisons were made using a one-way analysis of variance, followed by post-hoc Bonferroni’s corrections. Statistical significance was obtained when P values were less than 0.05.
Results
Body Weight and Blood Glucose Level
During the observation period, mean body weights were significantly (P < 0.01) lower in GK rats than those in age-related nondiabetic Wistar rats (Table 1) ▶ . There were significant reductions in body weight in both 8-week-old (P < 0.01) and 12-week-old Wistar rats (P < 0.01) when they were given sucrose for 2 and 6 weeks, whereas sucrose feeding for 6 weeks did not affect body weights in GK rats (Table 1) ▶ .
Table 1.
Body Weight and Blood Glucose Levels of Experimental Animals
| Group | Body weight (g) | Non-fasted blood glucose (mmol/L) | ||||
|---|---|---|---|---|---|---|
| 6 weeks | 8 weeks | 12 weeks | 6 weeks | 8 weeks | 12 weeks | |
| Wistar rats | 174 ± 5 (10) | 281 ± 10 (7) | 389 ± 5 (4) | 5.6 ± 0.6 (10) | 4.9 ± 0.4 (7) | 4.7 ± 0.6 (4) |
| Sucrose-fed Wistar rats | 263 ± 12 (8)* | 339 ± 11 (4)* | 5.4 ± 0.6 (8) | 4.9 ± 0.4 (4) | ||
| GK rats | 149 ± 7 (10)* | 240 ± 10 (7)* | 308 ± 16 (3)* | 11.9 ± 1.1 (10)* | 6.6 ± 0.6 (7)* | 7.7 ± 0.9 (3)* |
| Sucrose-fed GK rats | 241 ± 9 (8)† | 321 ± 7 (3) | 6.6 ± 0.7 (8)† | 7.0 ± 0.2 (3)† |
Values are expressed as mean ± SD. The number of animals is shown in parentheses.
*P < 0.01 versus Wistar rats.
†P < 0.01 versus sucrose-fed Wistar rats.
Mean nonfasting blood glucose levels were significantly (P < 0.01) higher in GK rats than those in control Wistar rats throughout the experimental period. These values were not influenced by sucrose treatment in both GK rats and Wistar rats (Table 1) ▶ .
Glucose Tolerance Test
On oral glucose tolerance tests, blood glucose levels after glucose load were markedly elevated in GK rats compared with Wistar rats. With sucrose feeding for 6 weeks, there was further elevation of glucose levels, representing 123% and 127% of 60-minute and 120-minute values of untreated GK rats, respectively (Figure 1) ▶ .
Figure 1.

Serial changes of blood glucose levels on the oral glucose tolerance test (2 g/kg) at 6, 8, and 12 weeks of age in experimental animals. At 12 weeks of age, sucrose-fed GK rats showed marked hyperglycemia after glucose load. ○, Wistar rats; •, sucrose-fed Wistar rats; □, GK rats; ▪ sucrose-fed GK rats.
Plasma Insulin Level
Mean basal plasma insulin levels in GK rats were nearly twice the values of age-matched Wistar controls. These values were increased twofold in both GK and Wistar rats with sucrose treatment (Table 2) ▶ .
Table 2.
Fasting Plasma Insulin Levels of Experimental Animals
| Group | Plasma insulin (ng/ml) | ||
|---|---|---|---|
| 6 weeks | 8 weeks | 12 weeks | |
| Wistar rats | 0.37 ± 0.23 (5) | 0.41 ± 0.22 (7) | 0.49 ± 0.20 (10) |
| Sucrose-fed Wistar rats | 0.93 ± 0.39 (7)* | 1.91 ± 0.84 (4)† | |
| GK rats | 0.92 ± 0.33 (9)† | 0.73 ± 0.29 (8)* | 0.72 ± 0.18 (10)* |
| Sucrose-fed GK rats | 1.58 ± 0.74 (7)‡ | 1.45 ± 0.45 (3)‡ |
Values are expressed as mean ± SD. The number of animals is shown in parentheses.
*P < 0.05 versus Wistar rats.
†P < 0.01 versus Wistar rats.
‡P < 0.01 versus GK rats.
Islet Structure and Morphometry
The pancreas of GK rats was free from the changes of pancreatitis or insulitis. Islets of GK rats were oval or round with smooth circumference at 6 and 8 weeks of age, whereas they became fibrotic with irregular contour at 12 weeks of age (Figure 2) ▶ . Sucrose-fed GK rats showed vacuolated degeneration of islet cells, and many islets underwent marked fibrosis with vacuolar degeneration of endocrine cells in 12-week-old GK rats treated with sucrose for 6 weeks (Figure 2) ▶ .
Figure 2.
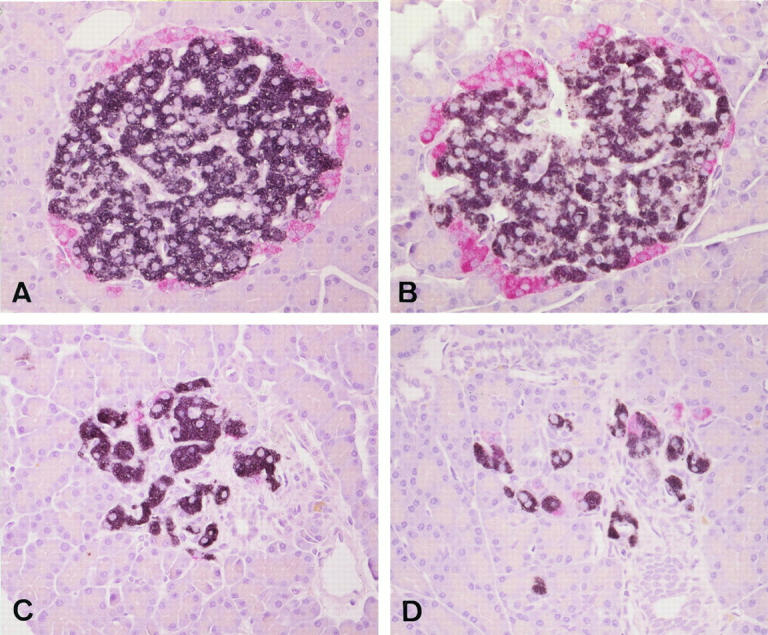
Islet structures and distribution of immunoreactive insulin-positive cells (black) and glucagon-positive cells (red) in Wistar rat (A), sucrose-fed Wistar rat (B), GK rat (C), and sucrose-fed GK rat (D) at 12 weeks of age. There is marked islet fibrosis with β-cell depletion in GK and sucrose-fed GK rats, in which the latter showed more severe changes. Double immunostaining for insulin and glucagon. Magnification, ×300 (A to D).
Mean volume density of β cells in GK rats was 19% lower than that in normal Wistar rats at 8 weeks of age. It was 49% lower in 12-week-old GK rats than that in Wistar rats (P < 0.05). With sucrose treatment for 2 and 6 weeks, the reduction of mean β-cell volume densities was more conspicuous, representing 78% and 52% of age-matched, untreated GK rats, respectively (P < 0.05 at 12 weeks of age) (Table 3) ▶ . On the other hand, there was no significant difference in the mean volume density of α cells between GK rats and Wistar rats during the observation period (Table 3) ▶ .
Table 3.
Morphometric Data of Islet β and α Cells of the Pancreas in Experimental Animals
| Group | Volume density of β cells (%) | Volume density of α cells (%) | ||||
|---|---|---|---|---|---|---|
| 6 weeks | 8 weeks | 12 weeks | 6 weeks | 8 weeks | 12 weeks | |
| Wistar rats | 0.54 ± 0.17 (5) | 1.14 ± 0.29 (5) | 1.14 ± 0.43 (5) | 0.19 ± 0.10 (5) | 0.30 ± 0.09 (5) | 0.25 ± 0.13 (5) |
| Sucrose-fed Wistar rats | 1.14 ± 0.45 (5) | 1.32 ± 0.77 (5) | 0.28 ± 0.16 (5) | 0.30 ± 0.14 (5) | ||
| GK rats | 0.57 ± 0.33 (5) | 0.92 ± 0.49 (5) | 0.58 ± 0.26 (5)* | 0.16 ± 0.10 (5) | 0.28 ± 0.24 (5) | 0.21 ± 0.11 (5) |
| Sucrose-fed GK rats | 0.72 ± 0.36 (5) | 0.29 ± 0.12 (5)† | 0.17 ± 0.09 (5) | 0.20 ± 0.12 (5) |
Values are expressed as mean ± SD. The number of animals is shown in parentheses.
*P < 0.05 versus Wistar rats.
†P < 0.05 versus GK rats.
Proliferative Activity of Pancreatic β Cells
The mean labeling index (LI) of islet cells as measured by BrdU uptake became smaller in normal Wistar rats as they grew (Table 4) ▶ . The mean LI in 8- and 12-week-old Wistar rats was only 28% and 5.7% of that in 6-week-old ones, respectively. GK rats showed significantly smaller LI at both 6 and 8 weeks of age by 67% and 61% compared with those in age-matched Wistar rats, respectively (P < 0.05 and P < 0.01). With aging, the LI in 8- and 12-week-old GK rats was reduced further, to 25% and 6.7% of the mean value of that in 6-week-old GK rats. Sucrose feeding elicited a slight but insignificant increase in the LI in both normal Wistar rats and GK rats.
Table 4.
Proliferative Activity of Islet β Cells in Experimental Animals
| Group | BrdU LI (%) | ||
|---|---|---|---|
| 6 weeks | 8 weeks | 12 weeks | |
| Wistar rats | 2.47 ± 0.36 (3) | 0.69 ± 0.04 (5) | 0.14 ± 0.09 (4) |
| Sucrose-fed Wistar rats | 0.88 ± 0.11 (2) | 0.20 ± 0.12 (4) | |
| GK rats | 1.65 ± 0.30 (5)* | 0.42 ± 0.05 (4)† | 0.11 ± 0.07 (3) |
| Sucrose-fed GK rats | 0.45 ± 0.05 (4)‡ | 0.20 ± 0.09 (3) |
Values are expressed as mean ± SD. The number of animals is shown in parentheses.
*P < 0.05 versus Wistar rats.
†P < 0.01 versus Wistar rats.
‡P < 0.01 versus sucrose-fed Wistar rats.
In Situ Detection of Apoptotic Cells
There were no TUNEL-positive (apoptotic) cells in the islets of both GK and Wistar rats at all of the ages examined (Table 5) ▶ . Sucrose feeding did not induce apoptosis in control Wistar rats. By contrast, GK rats treated with sucrose for 2 and 6 weeks showed the presence of apoptosis in 0.023 to 0.038% and 0.034 to 0.091% of β cells, respectively (Figure 3) ▶ .
Table 5.
Incidence of β-Cell Apoptosis in the Islets of Experimental Animals
| Apoptotic index of β cells (%) | ||||
|---|---|---|---|---|
| 8 weeks | 12 weeks | |||
| GK rats | Sucrose-fed GK rats | GK rats | Sucrose-fed GK rats | |
| Values | 0.000 | 0.000 | 0.000 | 0.091 |
| 0.000 | 0.032 | 0.000 | 0.034 | |
| 0.000 | 0.038 | 0.000 | 0.077 | |
| 0.000 | 0.024 | 0.000 | ||
| 0.000 | 0.000 | |||
| Mean | 0.000 | 0.024 | 0.000 | 0.067 |
Figure 3.

Apoptotic β cells (arrow) (black nucleus) in sucrose-fed GK rat at 12 weeks of age detected by the TUNEL method. Apoptotic β cells were only found in sucrose-fed GK rats but not in GK and Wistar rats. Double staining is shown for β cells positive for insulin (red) and apoptosis (black). Magnification, ×480.
8-OH-dG, Bcl-2, and Bax
There were weakly positive staining reactions of 8-OH-dG in ductal epithelial cells, smooth muscle cells of the ductal walls, and islet cells in normal Wistar rats at all ages examined. Although the reactions were not uniform among islets, they appeared to be stronger in ductal cells and islet cells in GK rats compared with age-matched Wistar rats, in particular, of 8 and 12 weeks of age (Figure 4) ▶ . The fibrotic islets showed the most conspicuous reactions. The staining reactions were further intensified in some islets of sucrose-fed GK rats, whereas no apparent alterations were found in sucrose-fed Wistar rats (Figure 4) ▶ .
Figure 4.

Detection of immunoreactive 8-OH-dG in Wistar rat (A), sucrose-fed Wistar rat (B), GK rat (C), and sucrose-fed GK rat (D). Pancreatic islets showed diffuse positive reactions in both Wistar and GK rats. Sucrose feeding appeared to increase the intensities of 8-OH-dG reactions in both Wistar and GK rats; the latter showed stronger reactions in some islets. Magnification, ×300 (A to D).
Islets were stained weakly positive with Bcl-2 in Wistar rats, and their staining reactions were consistent throughout the experimental period (Figure 5) ▶ . Six-week-old GK rats showed intensified staining reactions of islets with Bcl-2, and these reactions lessened with increasing age. Semiquantitative estimation of Bcl-2 immunostaining on the islet sections revealed about a 2.5-fold increase in staining intensities on average in 6-week-old GK rats compared with age-matched control Wistar rats (Table 6) ▶ . Eight- and 12-week-old GK rats exhibited smaller intensities than that detected in 6-week-old GK rats. At 8 and 12 weeks of age, Bcl-2 reactions were not different between GK and Wistar rats. Sucrose feeding did not significantly influence these reactions. On the other hand, islets were also positively stained with Bax in both GK and Wistar rats, and the staining intensities did not alter with aging. There was no difference in the Bax reactions between GK and Wistar rats. No significant changes of staining reactions with Bax after sucrose feeding were detected in either GK or Wistar rats.
Figure 5.

Immunohistochemical detection of Bcl-2 in the islets of Wistar (A) and GK (B) rats at 6 weeks of age. The staining reactions were strongly positive in the islets of GK rats, whereas Wistar rats showed only weakly positive reactions. Magnification: ×300.
Table 6.
Semiquantitative Analysis of Immunoreactive Bcl-2 in the Islets of Experimental Animals
| Intensity of staining | 6 weeks | 8 weeks | ||||
|---|---|---|---|---|---|---|
| W | GK | W | W+S | GK | GK+S | |
| Bcl-2 score | ||||||
| 3+ | 0 | 5 | 1 | 0 | 0 | 0 |
| 2+ | 1 | 0 | 1 | 3 | 2 | 2 |
| 1+ | 4 | 0 | 3 | 2 | 3 | 3 |
| 0 | 0 | 0 | 0 | 0 | 0 | 0 |
| Mean± SD | 1.2 ± 0.4 | 3.0 ± 0.0 | 1.6 ± 0.8 | 1.6 ± 0.5 | 1.4 ± 0.5 | 1.4 ± 0.5 |
W, Wistar rats; W+S, sucrose-fed Wistar rats; GK, GK rats; GK+S, sucrose-fed GK rats. Immunohistochemical reactions for Bcl-2 are graded as follows: 0, negative; 1+, weakly positive; 2+, moderately positive; and 3+, strongly positive.
Discussion
In this study, sucrose-treated GK rats relative to untreated GK rats had higher blood glucose levels on glucose load, suggesting the presence of stronger hyperglycemic stress in treated GK rats. It is of note that plasma insulin levels in both GK and Wistar rats treated with sucrose were almost twice the levels of untreated groups. Sucrose feeding thus forced islet β cells to secrete high insulin levels to compensate for high glucose. Such hyperglycemic stress was reflected structurally by vacuolation and degranulation of islet β cells and reduced immunoreactions to insulin, showing structural but not functional deficits of β cells.
We confirmed the progressive depletion of islet β cells in the GK rat. With increasing age, the reduction of β cells was more pronounced and was associated with diabetic syndrome, characterized by hyperglycemia and impaired glucose tolerance on glucose load. The commencement of apparent pancreatic pathology on hematoxylin and eosin sections at 8 weeks of age was in agreement with our previous findings, as well as with the data from the Stockholm colony. 12,15 Further, the reduction of β cells was found to be accelerated in rats with sucrose feeding. With 30% sucrose, 22% and 50% augmentation of β-cell loss occurred, suggesting that continuous hyperglycemia by sucrose feeding had caused more severe cell injury to β cells. Combined with our previous results that correction of hyperglycemia with α glucosidase inhibitor treatment prevented the loss of β cells, 15 the current findings provide evidence that sucrose-induced metabolic abnormalities resulted in the augmented β-cell loss in this model.
Our structural studies clearly demonstrated the presence of apoptosis specific to β cells in sucrose-fed GK rats. This is the first demonstration of the in vivo occurrence of apoptosis in β cells in diabetic rats, in particular under augmented hyperglycemia. Given that the β-cell mass is determined by proliferation and death of β cells, the enhanced reduction of the β-cell mass by sucrose overload may not be dependent on proliferative activity, but may be related to an increased rate of apoptosis of β cells. This is accounted for by the fact obtained from the present study that there was no significant difference in proliferative activity of islet β cells between untreated and sucrose-fed GK rats and that apoptotic cells were significantly more frequent in sucrose-fed GK rats. The cellular injury to β cells by sucrose-induced hyperglycemia is in keeping with the previous findings that β cells exposed to high glucose concentrations both in vivo and in vitro show impaired insulin secretion or insulin synthesis, although direct correlation between structural and functional damage of β cells has been difficult to prove. 20-23 The current findings, however, underscore hyperglycemia-induced apoptosis as a major mechanism for the progressive loss of β cells in vivo.
Strong positive reactions of islets with 8-OH-dG in sucrose-fed GK rats suggest that oxidative stress may be a major process for β-cell apoptosis in GK rats. In in vitro experiments, ambient high glucose gives rise to greater oxidative stress and DNA cleavage of β cells, resulting in apoptosis. One of the relevant factors is suggested to be increased glycation. 24 Treatment with aminoguanidine, an inhibitor of glycation production, 25 was demonstrated to inhibit the premature death of β cells. By contrast, the mechanisms of progressive depletion of β cells in untreated GK rats need to be carefully interpreted, because apoptotic cells were not detected during the whole experimental period in these rats. Lower activity of proliferation may be responsible for the loss of β cells in untreated GK rats, which cannot compensate for the age-related increase in the volume of β cells. Proliferative activity of islet β cells as detected by BrdU LI was significantly less in GK rats at 6 weeks and 8 weeks of age; thereafter, there was no difference in LI between GK and Wistar rats. Sucrose feeding did not significantly alter the levels of LI. Thus, the smaller levels of BrdU LI as an innate β-cell deficit in this model may add to the rate of progressive depletion of β-cell loss by apoptosis, yielding a greater total loss of β cells in sucrose-treated GK rats. One may also consider that modest hyperglycemia primarily caused by insulin resistance in this model 26,27 in turn gives rise to oxidative stress to β cells, followed by a lower rate of apoptotic cells in untreated GK rats. Rapid turnover of apoptotic cells may not allow the detection of TUNEL-positive cells at light microscopic levels in this situation. This assumption may be in part supported by the finding that 8-OH-dG staining appeared stronger in untreated GK rats compared with normal Wistar rats. Alternatively, the scavenger system for excessive oxidative stress may be poorly developed or weakened secondarily in islets of GK rats relative to normal Wistar rats and likely to undergo degeneration and loss of β cells even with modest hyperglycemia. 28
Apoptosis is regulated by a complex network, which can include myc, bcl-2, bax, p53, etc. 29,30 In particular, reduced proliferative activity was found to be associated with increased expression of Bcl-2 and subsequent reduction of this gene product in untreated GK rats. Sucrose feeding did not affect the reaction of Bcl-2, which has a unique oncogenic role in cell survival by inhibiting apoptosis. 31,32 Elevated expression of Bcl-2 in GK rats may be an early reactive upregulation of this protein against the ongoing apoptotic processes in this model. By contrast, there were no significant alterations of Bax expression, extensive amino acid homology with Bcl-2, 33 and repressor for Bcl-231. It is likely that Bax has a minor role in the process of sucrose-induced acceleration of β-cell apoptosis.
The natural history of pancreatic islet lesions and β-cell pathology in human NIDDM is still unclear. Heterogeneous pathophysiological states such as impaired insulin secretion or insulin resistance may correlate with the pathological lesions. Unlike other NIDDM animal models such as Otsuka-Long-Evans-Tokushima-fatty (OLETF) and Zucker diabetic fatty (ZDF) rats, as well as Wistar fatty rats, GK rats develop a common type of NIDDM without obesity. 8 The genetic loci of GK rats have been reported to be polygenic for fasting hyperglycemia, glucose intolerance, and decreased basal insulin release. 34,35 Further investigations are warranted for clarification of the basic mechanisms by which β cells undergo apoptosis, so that effective prevention may be developed for the primary prevention of NIDDM.
Acknowledgments
We thank Drs. Hisashi Ikeda and Hiroyuki Kodaka (Takeda Chemical Industries, Ltd.) for the kind supply of GK and Wistar rats used in this study. We are also indebted to Professor Toshihiko Osawa (Faculty of Agriculture, Nagoya University) for providing us antibodies to 8-OH-dG. Technical assistance from Ms. Michiko Sugo is gratefully acknowledged.
Footnotes
Address reprint requests to Dr. Soroku Yagihashi, Department of Pathology, Hirosaki University School of Medicine, 5 Zaifu-cho, Hirosaki, 036 Japan. E-mail: yagihasi@cc.hirosaki-u.ac.jp.
References
- 1.Weir GC, Leahy JL: Pathogenesis of non-insulin-dependent (type II) diabetes mellitus. ed 13 Kahn CR Weir GC eds. Joslin’s Diabetes Mellitus, 1994, :pp 240-263 Lea & Febiger, Philadelphia [Google Scholar]
- 2.Cooppan R: General approach to the treatment of diabetes. ed 13 Kahn CR Weir GC eds. Joslin’s Diabetes Mellitus, 1994, :pp 397-403 Lea & Febiger, Philadelphia [Google Scholar]
- 3.Clark A, Wells CA, Buley ID, Cruickshank JK, Vanhegan RI, Matthews DR, Cooper GJS, Holman RR, Turner RC: Islet amyloid, increased A-cells, reduced B-cells and exocrine fibrosis: quantitative changes in the pancreas in type 2 diabetes. Diabetes Res 1988, 9:151-159 [PubMed] [Google Scholar]
- 4.Saito K, Yaginuma N, Takahashi T: Differential volumetry of A, B and D cells in the pancreatic islets of diabetic and nondiabetic subjects. Tohoku J Exp Med 1979, 129:273-283 [DOI] [PubMed] [Google Scholar]
- 5.Rahier J, Goebbels RM, Henquin JC: Cellular composition of the human diabetes pancreas. Diabetologia 1983, 24:366-371 [DOI] [PubMed] [Google Scholar]
- 6.Stefan Y, Orci L, Malaisse-Lagae F, Perrelet A, Patel Y, Unger RH: Quantitation of endocrine cell content in the pancreas of nondiabetic and diabetic humans. Diabetes 1982, 31:694-699 [DOI] [PubMed] [Google Scholar]
- 7.John LL: Natural history of β-cell dysfunction in NIDDM. Diabetes Care 1990, 13:992-1010 [DOI] [PubMed] [Google Scholar]
- 8.Goto Y, Suzuki K, Sasaki M, Ono T, Abe S: GK rat as a model of nonobese, noninsulin-dependent diabetes: selective breeding over 35 generations. Shafrir E Renold AE eds. Frontiers in Diabetes Research: Lessons from Animal Diabetes II. 1988, :pp 301-303 John Libbey London [Google Scholar]
- 9.Portha B, Serradas P, Bailbe D, Suzuki K, Goto Y, Giroix M-H: β-cell insensitivity to glucose in the GK rat, a spontaneous nonobese model for type II diabetes. Diabetes 1991, 40:486-491 [DOI] [PubMed] [Google Scholar]
- 10.Ostenson C-G, Khan A, Abdel-Halim SM, Guenifi A, Suzuki K, Goto Y, Efendic S: Abnormal insulin secretion and glucose metabolism in pancreatic islets from the spontaneously diabetic GK rat. Diabetologia 1993, 36:3-8 [DOI] [PubMed] [Google Scholar]
- 11.Ostenson C-G, Abdel-Halim SM, Andersson A, Efendic S: Studies on the pathogenesis of NIDDM in the GK (Goto-Kakizaki) rat. Shafrir E eds. Lessons from Animal Diabetes. VI. 1996, :pp 299-315 Birkhäuser, Boston [Google Scholar]
- 12.Guenifi A, Abdel-Halim SM, Hoog A, Falkmer S, Ostenson C-G: Preserved β-cell density in the endocrine pancreas of young, spontaneously diabetic Goto-Kakizaki (GK) rats. Pancreas 1995, 10:148-153 [DOI] [PubMed] [Google Scholar]
- 13.Movassat J, Saulnier C, Portha B: β-cell mass depletion precedes the onset of hyperglycaemia in the GK rat, a genetic model of non-insulin dependent diabetes mellitus. Diabetes Metab 1995, 21:365-370 [PubMed] [Google Scholar]
- 14.Movassat J, Saulnier C, Serradas P, Portha B: Impaired development of pancreatic β-cell mass is a primary event during the progression to diabetes in the GK rat. Diabetologia 1997, 40:916-925 [DOI] [PubMed] [Google Scholar]
- 15.Koyama M, Wada R, Sakuraba Y, Odaka H, Ikeda H, Yagihashi S: Long-term effects of voglibose on pancreatic islets in GK rats: morphometric analysis. Diabetes Frontier 1997, 8:375-376(Abstract in Japanese) [Google Scholar]
- 16.Zhu M, Noma Y, Mizuno A, Sano T, Shima K: Poor capacity for proliferation of pancreatic β-cell in Otsuka-Long-Evans-Tokushima fatty rat: a model of spontaneous NIDDM. Diabetes 1996, 45:941-946 [DOI] [PubMed] [Google Scholar]
- 17.Klöppel G, Drenck CR, Oberholzer M, Heitz PU: Morphometric evidence for a striking B-cell reduction at the clinical onset of type 1 diabetes. Virchows Arch A 1984, 403:441-452 [DOI] [PubMed] [Google Scholar]
- 18.Blume N, Skouv J, Larsson L-I, Holst JJ, Madsen OD: Potent inhibitory effects of transplantable rat glucagonomas and insulinomas on the respective endogenous islet cells are associated with pancreatic apoptosis. J Clin Invest 1995, 96:2227-2235 [DOI] [PMC free article] [PubMed] [Google Scholar]
- 19.Hattori Y, Nishigori C, Tanaka T, Uchida K, Nikaido O, Osawa T, Hiai H, Imamura S, Toyokuni S: 8-Hydroxy-2′-deoxyguanosine is increased in epidermal cells of hairless mice after chronic ultraviolet B exposure. J Invest Dermatol 1997, 107:733-737 [DOI] [PubMed] [Google Scholar]
- 20.Leahy JL, Bonner-Weir S, Weir GC: Minimal chronic hyperglycemia is a critical determinant of impaired insulin secretion after an incomplete pancreatectomy. J Clin Invest 1988, 81:1407-1414 [DOI] [PMC free article] [PubMed] [Google Scholar]
- 21.Ling Z, Kiekens R, Mahler T, Schuit FC, Pipeleers-Marichal M, Sener A, Klöppel G, Malaisse WJ, Pipeleers DG: Effects of chronically elevated glucose levels on the functional properties of rat pancreatic β-cells. Diabetes 1996, 45:1774-1782 [DOI] [PubMed] [Google Scholar]
- 22.Malaisse WJ, Marynissen G, Sener A: Possible role of glycogen accumulation in B-cell glucotoxicity. Metabolism 1992, 41:814-819 [DOI] [PubMed] [Google Scholar]
- 23.Korsgren O, Jansson L, Sandler S, Andersson A: Hyperglycemia-induced B cell toxicity. J Clin Invest 1990, 86:2161-2168 [DOI] [PMC free article] [PubMed] [Google Scholar]
- 24.Tajiri Y, Möller C, Grill V: Long term effects of aminoguanidine on insulin release and biosynthesis, evidence that the formation of advanced glycosylation end products inhibits B cell function. Endocrinology 1997, 138:273-280 [DOI] [PubMed] [Google Scholar]
- 25.Kaneto H, Fujii J, Myint T, Miyazawa N, Islam KN, Kawasaki Y, Suzuki K, Nakamura M, Tatsumi H, Yamasaki Y, Taniguchi N: Reducing sugars trigger oxidative modification and apoptosis in pancreatic β-cells by provoking oxidative stress through the glycation reaction. Biochem J 1996, 320:855-863 [DOI] [PMC free article] [PubMed] [Google Scholar]
- 26.Berthelier C, Kergoat M, Portha B: Lack of deterioration of insulin action with aging in the GK rat: a contrasted adaptation as compared with nondiabetic rats. Metabolism 1997, 46:890-896 [DOI] [PubMed] [Google Scholar]
- 27.Picarel-Blanchot F, Berthelier C, Bailbe D, Portha B: Impaired insulin secretion and excessive hepatic glucose production are both early events in the diabetic GK rat. Am J Physiol 1996, 271:E755-E762 [DOI] [PubMed] [Google Scholar]
- 28.Yoshida K, Hirokawa J, Tagami S, Kawakami Y, Urata Y, Kondo T: Weakened cellular scavenging activity against oxidative stress in diabetes mellitus: regulation of glutathione synthesis and efflux. Diabetologia 1995, 38:201-210 [DOI] [PubMed] [Google Scholar]
- 29.Oltvai ZN, Milliman CL, Korsmeyer SJ: Bcl-2 heterodimerizes in vivo with a conserved homolog, bax, that accelerates programmed cell death. Cell 1993, 74:609-619 [DOI] [PubMed] [Google Scholar]
- 30.Hockenbery DM, Zutter M, Hickey W, Nahm M, Korsmeyer SJ: Bcl2 protein is topographically restricted in tissues characterized by apoptotic cell death. Proc Natl Acad Sci USA 1991, 88:6961-6965 [DOI] [PMC free article] [PubMed] [Google Scholar]
- 31.Iwahashi H, Hanafusa T, Eguchi Y, Nakajima H, Miyagawa J, Itoh N, Tomita K, Namba M, Kuwajima M, Noguchi T, Tsujimoto Y, Matsuzawa Y: Cytokine-induced apoptotic cell death in a mouse pancreatic β-cell line: inhibition by Bcl-2. Diabetologia 1996, 39:530-536 [DOI] [PubMed] [Google Scholar]
- 32.Kroemer G: The proto-oncogene Bcl-2 and its role in regulating apoptosis. Nat Med 1997, 3:614-620 [DOI] [PubMed] [Google Scholar]
- 33.Yin X-M, Oltvai ZN, Korsmeyer SJ: BH1 and BH2 domains of Bcl-2 are required for inhibition of apoptosis and heterodimerization with Bax. Nature 1994, 369:321-323 [DOI] [PubMed] [Google Scholar]
- 34.Galli J, Li L-S, Glaser A, Ostenson C-G, Jiao H, Fakhrai-Rad H, Jacob HS, Lander ES, Luthman H: Genetic analysis of non-insulin dependent diabetes mellitus in the GK rat. Nat Genet 1996, 12:31-37 [DOI] [PubMed] [Google Scholar]
- 35.Gauguier D, Froguel P, Parent V, Bernard C, Bihoreau M-T, Portha B, James MR, Penicaud L, Lathrop M, Ktorza A: Chromosomal mapping of genetic loci associated with non-insulin dependent diabetes in the GK rat. Nat Genet 1996, 12:38-43 [DOI] [PubMed] [Google Scholar]