

Abstract
Nervous system and hair follicle epithelium share a common ectodermal origin, and some neurotrophins (NTs) can modulate keratinocyte proliferation and apoptosis. Therefore, it is reasonable to ask whether NTs are also involved in hair growth control. Here, we show that the expression of NT-3 and its high-affinity receptor, tyrosine kinase C, in the skin of C57BL/6 mice is strikingly hair cycle-dependent, with maximal transcript and protein expression seen during spontaneous hair follicle regression (catagen). During catagen, NT-3 and tyrosine kinase C are co-expressed by terminal deoxynucleotidyl transferase-mediated in situ nick end labeling-positive keratinocytes in the club hair and secondary germ. NT-3-overexpressing transgenic mice show precocious catagen development during the postnatal initiation of hair follicle cycling, whereas heterozygous NT-3 knockout (+/−) mice display a significant catagen retardation. Finally, NT-3 stimulates catagen development in organ culture of normal C57BL/6 mouse skin. These observations suggest that the hair follicle is both a source and target of NT-3 and that NT-3/tyrosine kinase C signaling is functionally important in the control of hair follicle regression. Therefore, tyrosine kinase C agonists and antagonists deserve systematic exploration for the management of hair growth disorders that are related to premature (alopecia/effluvium) or retarded catagen (hirsutism/hypertrichosis).
Increasing evidence suggests that neurotrophic factors not only influence neuronal development, plasticity, and regeneration, as well as target tissue innervation, but also exert multiple effects on nonneuronal tissues, particularly during their morphogenesis. 1,2 For studying the relatively underexplored nonneuronal functions of neurotrophins (NTs) in peripheral tissues, the hair follicle (HF) offers an excellent, easily accessible model system that is ideally suited to dissect the control and molecular characteristics of neuroectodermal-mesenchymal interactions. 3 Because the HF continuously undergoes cyclic switches between stages of relative resting (telogen), rapid morphogenesis coupled with an extremely high proliferation and protein synthesis activity (anagen), and apoptosis-driven organ involution (catagen), 4,5 the HF also provides an instructive model for analyzing the role of NTs in epithelial tissue morphogenesis, remodeling, and regression. 3,6 This notion is supported by the observation that nerve growth factor (NGF) knockout mice appear to display retarded hair growth. 7
NT-3 is a member of the NT family and has approximately 50% homology to NGF, brain-derived neurotrophic factor (BDNF), and NT-4. 8,9 The biological effects of NT-3 are mediated via two types of receptors: the tyrosine kinase receptor TrkC, 10 and the low-affinity NT receptor p75NTR. 11 NT-3 may also bind with low affinity to TrkA and TrkB, the high-affinity receptors for NGF (TrkA) and BDNF/NT-4 (TrkB). 12
NT-3 mRNA and TrkC mRNA are expressed in the epithelium of developing rat vibrissa follicles. 13,14 In adult human skin, NT-3 is reportedly produced by fibroblasts, 15,16 whereas TrkC immunoreactivity (IR) has been reported in the basal and granular layers of the epidermis, on HF keratinocytes, melanocytes, Pacinian corpuscles, nerve fibers, blood vessels, and sweat glands. 16-19 Gene knockout and transgenic mice have shown that skin-derived NT-3 plays an essential role in the development of rapidly and slowly adapting skin mechanoreceptors associated with HFs and Merkel cells, respectively. 20,21 Notably, we have recently found that NT-3 stimulates pelage HF morphogenesis in mice. 6
Potential nonneurotrophic functions of NTs in the skin are mainly thought to be associated with their ability to modulate keratinocyte proliferation and apoptosis. Thus, in vitro, NGF can stimulate human epidermal keratinocyte proliferation and suppress keratinocyte apoptosis via interaction with TrkA. 22,23 In situ, NGF either stimulates or inhibits murine keratinocyte proliferation, dependent on whether all HFs in the examined skin are in telogen or anagen. 24
In addition to the well established antiapoptotic properties of NTs, 22,23,25 NGF may also induce apoptosis via p75NTR- or even via TrkA-signaling pathways. 26-28 This is interesting, given that keratinocytes of the regressing HF compartments (eg, epithelial strand or secondary hair germ) express strong p75NTR IR during catagen development in mice. 29 This raises the possibility that NTs such as NT-3 are involved in the control of apoptosis-driven HF regression (catagen).
To explore the role of NT-3 and its high-affinity receptor in hair biology, we have systematically analyzed NT-3, TrkC, and p75NTR expression during all stages of HF cycling in normal C57BL/6 mice, employing enzyme-linked immunosorbent assay (ELISA), immunocytochemistry, terminal deoxynucleotidyl transferase-mediated in situ nick end labeling (TUNEL), and reverse transcription-polymerase chain reaction (RT-PCR). In addition, HF cycling in heterozygous NT-3 knockout (+/−) 30 and NT-3-overexpressing mice (promoter: K14) 21 was compared with that of their corresponding wild-type littermates by quantitative histomorphometry. Finally, the effects of NT-3 on spontaneous HF regression in situ were studied, using established skin organ culture techniques. 24,31 These studies provide evidence that NT-3 is indeed involved in the control of catagen.
Materials and Methods
Animals and Tissue Collection
C57BL/6 mice were purchased from Charles River (Sulzfeld, Germany) and housed in community cages at the animal facilities of the Charité Hospital (Virchow Campus, Berlin). NT-3-overexpressing transgenic and heterozygous NT-3 knockout (+/−) mice were housed at the animal facilities of the University of Kentucky Medical Center or the Max-Delbrück Center for Molecular Medicine, Berlin-Buch, respectively. All mice were fed water and mouse chow ad libitum.
NT-3-overexpressing transgenic mice were generated as described, 21 using the keratin 14 promoter to target NT-3 overexpression to basal epidermal keratinocytes in murine skin. NT-3 knockout mice were generated using a conventional gene-targeting technique. 30 Genotyping of animals was performed using slot blot analysis of isolated tail DNA as described. 21 Both NT-3-overexpressing and heterozygous (+/−) knockout mice grew normally and displayed no obvious behavioral, skin, or hair growth abnormalities.
Active hair growth (anagen) was induced in the back skin of 6- to 9-week-old C57BL/6 female mice in the telogen phase of the hair cycle (as judged from their homogeneously pink back skin color) by depilation as previously described. 32 All key hair cycle stages 33 were studied in at least five mice per hair cycle stage: telogen (untreated skin), anagen II (3 days after depilation), anagen IV (5 days after depilation), anagen VI (12 days after depilation), and catagen (19 days after depilation). Mice were sacrificed by cervical dislocation. For immunohistochemical analysis, the neck region of back skin was harvested parallel to the vertebral line and was embedded quickly and frozen in liquid nitrogen, using a special technique for obtaining longitudinal cryosections through the HFs from one defined site. 34 Corresponding back skin samples, collected for ELISA and RT-PCR analysis, were shock-frozen in liquid nitrogen and stored at −70°C until used.
RT-PCR of NT-3 and TrkC
Semiquantitative RT-PCR analysis of NT-3, TrkC, and constitutively expressed β-actin was performed as previously described. 35,36 Total RNA was isolated from full-thickness back skin samples, which included the subcutaneous panniculus carnosus muscle layer (homogenized in liquid nitrogen), using a single-step guanidine thiocyanate-phenol-chloroform method with RNAzol B (Biotech Laboratories, Inc., Houston, TX). cDNA was synthesized by reverse transcription of 3 μg total RNA, using a cDNA synthesis kit (Invitrogen, San Diego, CA). The following sets of oligonucleotide primers were used: for β-actin, 5′-TGG AAT CCT GTG GCA TCC ATG AAA C and 5′-TAA AAC GCA GCT CAG TAA CAG TCC G-3′; for NT-3, 5′-GGT GAA CAA GGT GAT GTC CAT C and 5′-GCT GCC CAC GTA ATC CTC CA; and for TrkC, 5′-GGG TCT GTG GTG ATG GGG ATC CAC TC-3′ and 5′-GCC AAG AAT GGT CCA GGT AGA TTG-3′. 37,38
Amplification was performed using Taq polymerase (Life Technologies, Inc., Grand Island, NY) over 34 cycles, using an automated thermal cycler (Perkin-Elmer Corp., Norwalk, CT). Each cycle consisted of the following steps: denaturating at 94°C (1 minute), annealing at 60°C (45 seconds), and extension at 72°C (45 seconds). PCR products were analyzed by agarose gel electrophoresis and enzymatic digestion using standard methods. 39 Staining was densitometrically assessed with a video scanner using Scan Pack 2.0 (Biometra, Göttingen, Germany).
Determination of Skin NT-3 Protein Content by ELISA
For protein extraction, full-thickness samples of C57BL/6 mouse back skin, dissected at the level of the subcutis just below the panniculus carnosus at distinct stages of the induced hair cycle, 32,34 were pulverized in liquid nitrogen. 35,36 Per 100 mg of skin, 0.5 ml lysis buffer (50 mmol/L Tris/HCl, pH 8.0, 150 mmol/L NaCl, 1 mmol/L ethylendiaminetetraacetic acid, 1 mmol/L phenylmethylsulfonyl fluoride, 5 mmol/L iodacetamid, 10 mg/ml aprotinin, 0.2% sodium dodecyl sulfate, 1% Nonidet, and 1% Triton X-100) were added and lysed in an ultrasonic bath for 10 minutes. After a 1-hour shaking at 4°C, the mixture was sonicated again in the ultrasonic bath for 10 minutes. The solution was centrifuged for 30 minutes at 14,000 × g at 4°C, and the supernatants were frozen and stored at −80°C. For quantification of NT-3 protein, a commercially available ELISA kit was used, following the manufacturer’s instructions (Promega, Madison, WI).
Immunohistochemistry
Cryostat sections (8 μm) of adolescent C57BL/6 mouse skin were used for the analysis of NT-3 and TrkC IR after fixation in acetone (−20°C, 10 minutes). In addition, cryosections of skin from NT-3 knockout (−/−) and NT-3-overexpressing transgenic mice were used as negative and positive controls, respectively, for the antiserum against NT-3. For all antisera, incubation of skin sections without primary antisera and cryostat sections of embryonic brain were used as negative and positive controls, respectively. Preabsorption of primary NT-3 or TrkC antisera with 100 μg/ml of the corresponding antigenic peptides (37°C, 60 minutes) was used as an additional negative control.
Incubation steps were interspersed by four washes with Tris-buffered saline (5 minutes each). For immunovisualization of NT-3, rabbit antiserum against amino acids 139 to 158 mapping at the amino terminus of the human NT-3 precursor (identical to the corresponding mouse sequence; Santa Cruz Biotechnology, Santa Cruz, CA), 40 as well as chicken antiserum against human NT-3 41 (Promega), were used. For the analysis of TrkC expression, rabbit antiserum to the amino acids 798 to 812 mapping at the intracellular carboxy terminal domain of TrkC protein, gp140 17,18 (Santa Cruz Biotechnology), was used.
Cryostat sections were incubated with the primary antisera (1:50) overnight at room temperature, followed by an incubation with tetramethylrhodamine-isothiocyanate-conjugated F(ab)2 fragments of a goat anti-rabbit immunoglobulin G or mouse anti-chicken immunoglobulin G (Jackson ImmunoResearch Laboratories, West Grove, PA; 1:200, 30 minutes, 37°C) following previously developed basic protocols. 42 Sections were then counterstained by Hoechst 33342 (Sigma Chemical Co., St. Louis, MO; 10 μg/ml in Tris-buffered saline, 30 minutes, room temperature). 29
For the double immunodetection of TrkC IR on the one hand, and p75NTR IR on the other, the tyramide-amplification method was used as described before. 43,44 Briefly, after blocking of endogenous peroxidase and nonspecific avidin/biotin binding, sections were incubated in TNB buffer (DuPont NEN, Boston, MA) followed by application of rat monoclonal antibody against murine p75NTR 45 (Chemicon International Inc., Temecula, CA) overnight (1:1000). Then the corresponding biotinylated goat anti-rat antiserum (1:200, 30 minutes), diluted in TNB blocking buffer (DuPont NEN), was applied. The product reaction was developed with a commercial tyramide-amplification kit (DuPont NEN): sections were incubated in streptavidin-horseradish peroxidase (1:100 in TNB, 30 minutes) and washed with TNT buffer (DuPont NEN), followed by a 10-minute application of tetramethylrhodamine-isothiocyanate-tyramide (1:50 in Amplification Diluent; DuPont NEN). Then, after blocking nonspecific binding by 10% normal goat serum, sections were incubated with rabbit antiserum against TrkC (1:50, overnight, room temperature), washed in Tris-buffered saline (three times for 5 minutes each), followed by incubation with Cy2-conjugated goat anti-rabbit secondary antibody (Jackson ImmunoResearch Laboratories; 1:20, 37°C, 1 hour). Finally, sections were washed three times with Tris buffer and then counterstained by Hoechst 33342.
Double Immunodetection of TUNEL-Positive Cells and NT-3/TrkC IR
For double immunovisualization of apoptotic cells on the one hand and NT-3 or TrkC IR on the other, a previously established protocol was used. 29 Briefly, TUNEL-positive cells were detected using a commercially available kit (ApopTag; Oncor, Gaithersburg, MD) with anti-digoxigenin fluorescein isothiocyanate-conjugated F(ab)2 fragments; NT-3- or TrkC IR was visualized with application of the corresponding primary antisera, described above, followed by secondary goat anti-rabbit tetramethylrhodamine-isothiocyanate-conjugated antibody. Negative and positive controls for the TUNEL staining were run as reported. 46
After washing in Tris-buffered saline, all sections were mounted with Immunomount medium (Shandon, Pittsburgh, PA). Sections were examined under a Zeiss Axioscope microscope, using the appropriate excitation-emission filter systems for studying the fluorescence induced by Hoechst 33342, fluorescein isothiocyanate, or tetramethylrhodamine-isothiocyanate. Photodocumentation was done with the help of a digital image analysis system (ISIS Metasystems, Altlussheim, Germany).
Histomorphometry and Statistical Analysis
In adolescent skin, IR patterns were scrutinized by studying at least 50 HFs per mouse, and five mice were assessed per hair cycle stage. For each stage of HF cycling, the major IR patterns were recorded in previously prepared, computer-generated schematic representations of murine HF cycling, which allow a standardized, easily reproducible, and systematic comparison of different follicular IR patterns. 47 For the precise identification of the defined stages of HF cycling, histochemical detection of endogenous alkaline phosphatase activity was used, because this allows visualization of dermal papilla morphology as a useful morphological marker for staging HF development and cycling. 48
The percentage of HFs in different stages of growth (anagen), regression (catagen), or resting (telogen) was assessed and calculated on the basis of generally accepted morphological criteria of hair cycle classification. 4,33,47-51 Only every 10th cryosection was used for analysis to exclude repetitive evaluation of the same HF, and two or three cryosections were evaluated from each animal. All together, 200 to 250 follicles in 50 to 60 microscopic fields, derived from three to five animals of distinct age, were analyzed and compared with that of a corresponding number of HFs from the appropriate, age-matched wild-type mice.
The distance between the stratum corneum and the subcutis/panniculus carnosus border was measured for assessing the skin thickness in NT-3-overexpressing, NT-3 (+/−) knockout and corresponding wild-type animals. In total, 40 to 50 such measurements were performed in 50 to 60 microscopic fields derived from three to five animals per mutant and wild-type group. All sections were analyzed at ×100 or ×200 magnification, and means and SEMs were calculated from pooled data. Differences were judged as significant if the P value was lower than 0.05, as determined by the independent Student’s t-test for unpaired samples.
Skin Organ Culture
Punch biopsies (4 mm) were prepared under sterile conditions from adolescent C57BL/6 mouse back skin with all HFs in the late anagen VI to early catagen stage of the induced hair cycle (day 17 after depilation), 51 following previously described basic organ culture protocols, 24,31 with the following modifications. Per experimental group, 8 to 10 randomized skin punches, derived from the back skin of three different mice, were placed dermis down on prehydrated gelatin sponges (Gelfoam, Upjohn Co., Kalamazoo, MI) in 35-mm Petri dishes containing 5 ml Dulbecco’s modified Eagle’s medium supplemented with 10% fetal bovine serum, 50 mg/ml l-glutamine, and antibiotic/antimycotic mixture (Life Technologies, Inc.). After addition of 5 to 50 ng/ml human recombinant NT-3 (Promega), organ cultures were incubated for 48 hours at 37°C in 5% CO2 and 100% humidity. After the end of incubation, all fragments were washed repeatedly in the same medium at 4°C and fixed in 4% paraformaldehyde and embedded in paraffin for routine histology and quantitative histomorphometry. The skin thickness in biopsies was assessed as described above. The percentage of HFs in defined catagen stages was calculated in 8 to 10 biopsies per group at a magnification of ×400 under a Zeiss Axioscope microscope, following accepted morphological criteria. 50,51
Results
NT-3 and TrkC Expression in Normal Mouse Skin Are Hair Cycle Dependent and Peak Shortly Before or During Catagen Development
As an important phenomenological indicator for a possible involvement of NT-3-related signaling in hair growth control, NT-3 and TrkC gene transcription as well as total NT-3 protein content in full-thickness adolescent mouse skin were characterized by semiquantitative RT-PCR analysis and/or ELISA during the induced, highly synchronized murine hair cycle.
High steady-state levels of NT-3 transcripts, as well as of NT-3 protein (0.8 ng/mg protein), were detected in adolescent C57BL/6 murine back skin with all HFs in telogen, whereas no TrkC transcripts were found at this time point (Figure 1, A, D, and E) ▶ . Hair cycle induction and the early stages of anagen development were accompanied by a significant decline of NT-3 transcript levels in anagen II (Figure 1D) ▶ and of NT-3 protein level in back skin with all HFs in anagen III to IV (Figure 1E) ▶ . In anagen VI skin, (ie, days 8 to 12 after depilation), cutaneous steady-state levels of NT-3 mRNA (Figure 1D) ▶ and of NT-3 protein (Figure 1E) ▶ had increased in parallel and reached a maximum at the beginning of spontaneous, synchronized catagen transformation of murine HFs on day 17 (P < 0.01, compared with day 5). In contrast, the steady-state levels of TrkC transcripts were maximal in late anagen (anagen VI) and significantly declined during catagen development (Figure 1C) ▶ . During the subsequent catagen-telogen transformation of HFs (days 19 to 25 after depilation), 50,51 the skin levels of NT-3 and TrkC mRNA, and of NT-3 protein, further declined significantly, compared with the values of late anagen and/or early catagen (Figure 1) ▶ . Taken together, these expression data suggested an involvement of NT-3 signaling chiefly in the control of late anagen, and in the as yet unclear mechanisms that regulate the anagen-catagen transformation of the HF. 4,5,29,47,49,51
Figure 1.

Semiquantitative RT-PCR of TrkC and NT-3 mRNA and of NT-3 protein content (ELISA), during the induced murine hair cycle. TrkC and NT-3 expression were studied in full-thickness back skin from various stages of the depilation-induced hair cycle in adolescent C57BL/6 mice, because it displays the highest degree of hair cycle synchrony. B to E: x axis lists the days after anagen induction by depilation; the corresponding hair cycle stages are indicated in A. A: mRNA steady-state levels during the induced murine hair cycle. At defined time points, total RNA was extracted from full-thickness back skin, including the panniculus carnosus muscle; RNA was reverse transcribed, and semiquantitative RT-PCR was performed using primers specific for β-actin, TrkC, and NT-3. Representative gels from one of three experiments each are shown (days 0 and 25, telogen; days 1 to 12, anagen; and days 17 to 19, catagen). B to D: Densitometric analysis of RT-PCR signals specific for β-actin (B), TrkC (C), and NT-3 (D); (means ± SD; n = 3). *P < 0.05; **P < 0.005. E: At the time points indicated, protein from full-thickness back skin including panniculus carnosus muscle of C57BL/6 mice was extracted, and the content of NT-3 antigen (ng/mg protein) was assayed by ELISA (means ± SD; n = 5). *P < 0.05; **P < 0.01.
Intrafollicular Expression of NT-3 and TrkC Increases during Catagen
To correlate the NT-3 and TrkC gene and protein expression in full-thickness skin homogenates with the intrafollicular expression patterns of NT-3 and TrkC antigens in situ during different stages of HF cycling, NT-3 and TrkC IR was assessed by immunohistochemistry in the back skin of adolescent C57BL/6 mice. The observed expression patterns are documented by representive examples in Figure 2 ▶ and are schematically summarized in Figure 3 ▶ . NT-3 IR patterns were tested with two distinct antisera (see Materials and Methods), which gave highly similar results in all staining protocols, as well as in the positive and negative controls (not shown). For more extensive analyses, an antiserum against amino acids 139 to 158 mapping at the amino terminus of the human NT-3 precursor (which is fully homologous to the corresponding mouse sequence) 40 was selected, because it provided an optimal signal/noise ratio. As an additional control, the patterns of TrkC IR expression were compared with those obtained with different antisera against other Trk receptors (full-length forms of TrkA and TrkB, a truncated form of TrkB), and substantial differences in the IR localization were noted (not shown), attesting to both the specificity and sensitivity of our immunohistochemical results).
Figure 2.

Follicular NT-3 and TrkC expression is hair cycle dependent (compare with Figure 3 ▶ ). Back skin cryostat sections (8 μm) of adolescent C57BL/6 mice with all HFs in defined stages of the induced hair cycle (telogen, unmanipulated skin (day 0); anagen II, 3 days after anagen induction by depilation; anagen IV and VI, catagen II-VIII 5, 8, 17, and 19 days after anagen induction, respectively) were stained with antiserum against NT-3 or TrkC. Telogen: A, NT-3 IR in selected keratinocytes of the innermost outer root sheath close to the hair shaft (arrowheads) and in single perifollicular nerve fibers and/or Schwann cell processes (arrow). The border between dermis and epidermis is indicated by a dotted line, which terminates in the suprainfundibular outer root sheath of the HF. C, TrkC IR is present only in thick nerve bundles (arrow; the dermoepidermal membrane and the outline of the HF are indicated by a dotted line; note that the faint IR visible within the HF epithelium represents background stain). Anagen IV: B, NT-3 IR in single follicle isthmus keratinocytes (small arrowheads), dermal papilla fibroblasts (large arrowhead), and perifollicular nerve fibers (arrow). D, TrkC IR in the outer root sheath keratinocytes (arrow). Anagen VI: E, NT-3 IR expression in the innermost layer of the outer root sheath in the distal HF isthmus region (small arrowheads) and in the bulge (large arrowhead). Insert, higher magnification of NT-3 IR in the innermost outer root sheath in the HF isthmus. F, TrkC IR is not seen in this region. G, HF keratinocytes in the proximal outer root sheath (arrows) and dermal papilla fibroblasts (arrowhead) show NT-3 IR. I, TrkC IR in the hair matrix keratinocytes (arrows) and dermal papilla fibroblasts (arrowhead). Catagen II: H, hair matrix keratinocytes (small arrow) and proximal outer root sheath keratinocytes (arrowhead) have NT-3 IR. *Very strong NT-3 IR in the subcutaneous panniculus carnosus muscle. J, essentially the same patterns as seen for TrkC, with the notable difference that the panniculus carnosus is TrkC negative (*). Catagen VI: K, strikingly prominent NT-3 IR in keratinocytes of the regressing epithelial strand (arrowheads) and the secondary hair germ (arrow). L, TrkC IR in the secondary hair germ (arrow) and the epithelial strand (arrowheads). Abbreviations: APM, arrector pili muscle; B, bulge; CH, club hair; DP, dermal papilla; EP, epidermis; ES, epithelial strand; HS, hair shaft; IRS and ORS, inner and outer root sheath, respectively; SG, sebaceous gland; SHG, secondary hair germ. In E, F, and H, HF compartments are indicated by thick arrows. Scale bars: 50 μm.
Figure 3.

Schematic summary of NT-3 and TrkC IR during the adolescent murine hair cycle. Cell populations with strong NT-3 IR expression are depicted in black, TrkC IR cells are indicated by empty ovals, and cells with a possible co-localization of both antigens are shown in gray. Hair cycle stages are indicated above the epidermis. This summary scheme represents the most consistently reproducible IR patterns, derived from analyzing >50 longitudinally sectioned follicles from the lower back skin of at least five C57BL/6 mice per time point. Abbreviations: APM, arrector pili muscle; B, bulge; CH, club hair; DP, dermal papilla; EP, epidermis; ES, epithelial strand; FNB, follicular network B; HS, hair shaft; IRS and ORS, inner and outer root sheath, respectively; SG, sebaceous gland; SHG, secondary hair germ.
In unmanipulated murine back skin with all HFs in the resting stage of the hair cycle (telogen), NT-3 IR was found in single cells in the innermost outer root sheath, located in close proximity to the hair shaft (Figure 2A) ▶ , as well as in single perifollicular longitudinal fibers, located at the level of the HF isthmus (the so-called follicular neural network B). 52 In contrast, no follicular TrkC IR was found in telogen skin, whereas thick subcutaneous nerve bundles had TrkC IR (Figure 2C) ▶ .
With progressing anagen development (anagen IV), HF-associated NT-3 IR became visible in single cells in the HF isthmus region, in the dermal papilla, and in perifollicular nerve fibers (Figure 2B) ▶ . At the same time, follicular TrkC IR became visible, yet only in the central outer root sheath (Figure 2D) ▶ . Further progression of anagen development (anagen VI) associated with strong NT-3 IR was found in the innermost layer of the outer root sheath, namely in that region of the HF isthmus where the inner root sheath disappears and where the outer root sheath undergoes so-called trichilemmal keratinization 53 (Figure 2E) ▶ . This expression pattern of NT-3 in the upper outer root sheath remained constant throughout the anagen-catagen transformation of the HF (Figure 3) ▶ . Also, a less intense NT-3 IR was seen in the bulge (Figure 2E) ▶ , one major location of epithelial stem cells. 54 Interestingly, no TrkC IR expression was seen in this region (Figure 2F) ▶ . In anagen VI, NT-3 IR was widely expressed by proximal outer root sheath keratinocytes (Figure 2G) ▶ , whereas many hair matrix and outer root sheath keratinocytes displayed TrkC IR (Figure 2I) ▶ . Prominent IR not only for NT-3, but also for TrkC, appeared in the dermal papilla of anagen VI HFs (Figure 2, G and I) ▶ .
The earliest stages of HF regression (catagen I to II) were characterized by a disappearance of TrkC IR from dermal papilla fibroblasts, whereas some of them retained NT-3 IR (not shown). Both antigens were strongly expressed in the proximal outer root sheath and hair matrix keratinocytes of catagen II follicles (Figure 2, H and J) ▶ . With progressing HF regression, ie, during catagen V to VI, very high levels of NT-3 and TrkC IR became visible in keratinocytes of the regressing epithelial strand and the hair germ (Figure 2, K and L) ▶ . TrkC IR was also seen in the regressing inner root sheath (Figure 3 ▶ and Figure 4, F and G ▶ ). Prominent expression of both antigens was also observed in secondary hair germ keratinocytes in catagen VII to VIII follicles. Individual cells in the regressing epithelial strand and the secondary hair germ, located next to the newly developing club hair, showed exceptionally strong NT-3 and/or TrkC IR (Figure 2, K and L) ▶ . During the entire hair cycle, the arrector pili muscle (Figure 2E) ▶ and the subcutaneous panniculus carnosus muscle showed strong NT-3 IR, which was contrasted by an absence of TrkC IR (Figure 2, H and J) ▶ .
Figure 4.

Co-localization of NT-3/TrkC IR and apoptotic markers during spontaneous catagen development. Back skin cryostat sections (8 μm) of adolescent C57BL/6 mice with all HFs in defined stages of spontaneous catagen development (A to G, 17 to 19 days after anagen induction) were processed for the double immunovisualization of NT-3 IR and TUNEL (A to D), TrkC IR and TUNEL (E and F), or TrkC and p75NTR IR G. The sections shown in A to C and E were counterstained by Hoechst 33342 for visualization of cell nuclei. Note that a positive TUNEL stain does not in all cases reflect apoptosis 29,65-67 and that, eg, terminally differentiated TUNEL+ trichocytes in the club hair may lack the ultrastructural features of apoptosis (Tobin and Paus, unpublished observations). NT-3 IR (red) + TUNEL (green): A, co-localization of NT-3 and TUNEL (yellow/orange fluorescence, arrowhead) in one of the innermost outer root sheath keratinocytes in the isthmus region of the HF during catagen II. The other keratinocytes in this region show only NT-3 IR (small arrow). HF compartments are indicated by thick arrows. B, co-expression of NT-3 IR and TUNEL in the hair matrix keratinocyte (yellow fluorescence, arrowhead) during catagen IV. C, numerous NT-3/TUNEL double-positive cells (yellow/orange fluorescence, small arrowheads) in the regressing epithelial strand during catagen VI. Note the presence of single NT-3-positive cells (arrows) in the secondary hair germ and epithelial strand. Single TUNEL-positive cells are indicated by large arrowheads. The insert demonstrates that two of the six NT-3/TUNEL double-positive cells display a dendritic morphology. D, single NT-3 IR (arrows) or TUNEL-positive cells (large arrowheads), as well as double-labeled cells (small arrowheads) in the club hair and secondary hair germ during catagen VI to VII. Inserts in A to D show a higher magnification of NT-3/TUNEL double-positive cells. TrkC (red) + TUNEL (green): E, TrkC IR staining and TUNEL-positive staining are co-localized in some keratinocytes (small arrowheads) of the regressing HF compartments during catagen VI. The insert shows a higher magnification of TUNEL-positive granules inside TrkC IR keratinocytes. F, co-expression of TrkC and TUNEL in keratinocytes of club hair and secondary hair germ (small arrowheads). Single TrkC IR and TUNEL-positive cells in E and F are indicated by thin arrows and large arrowheads, respectively. p75NTR (red)+TrkC (green): G, co-localization of TrkC IR with p75NTR IR in the secondary hair germ (yellow/orange fluorescence, small arrowheads). Club hair and inner root sheath are only TrkC positive (arrows). The large arrowhead labels single p75NTR IR nerve fibers as internal positive control. Abbreviations: CH, club hair; DP, dermal papilla; ES, epithelial strand; HS, hair shaft; IRS and ORS, inner and outer root sheath, respectively; SHG, secondary hair germ. Scale bars: 50 μm.
NT-3 and TrkC IR Co-Localizes with Apoptosis Markers during HF Regression
Based on the observations that the cutaneous steady-state levels of NT-3 and TrkC gene and protein expression were up-regulated during the anagen-catagen transformation (Figure 1) ▶ and that NT-3 and TrkC IR were expressed particularly strongly in regressing HF compartments during catagen (Figures 2 and 3) ▶ ▶ , it was logical to ask whether or not keratinocytes undergoing catagen-associated apoptosis in the hair matrix, epithelial strand, and secondary hair germ 29 co-express NT-3 or TrkC IR.
Using a technique for double immunovisualization of TUNEL-positive and NT-3 or TrkC IR cells in the regressing HF, we observed that, during the entire catagen stage, the innermost layer of the outer root sheath expressed strong NT-3 IR in approximately the region where the inner root sheath disappears and where the outer root sheath undergoes trichilemmal keratinization 53 (Figure 4A) ▶ . Isolated NT-3 IR keratinocytes of this compartment also displayed TUNEL+ nuclei (Figure 4A) ▶ , suggesting that they had entered into the final stage of apoptosis. In the proximal epithelium of catagen IV to V HFs, single TUNEL+ cells in the hair matrix also showed cytoplasmic NT-3 IR (Figure 4B) ▶ . In catagen VI, many TUNEL+ cells and apoptotic bodies located in the epithelial strand were also NT-3 IR (Figure 4C) ▶ . In catagen VI to VII, some TUNEL+ cells of the secondary hair germ and even of the most proximal club hair also displayed NT-3 IR. However, some clearly NT-3 IR cells located in this compartment were TUNEL negative, and vice versa (Figure 4D) ▶ .
In contrast to the NT-3 IR patterns described above (Figure 2E) ▶ , no TrkC or p75NTR IR expression was observed in that part of the HF isthmus where the innermost outer root sheath undergoes trichilemmal keratinization (not shown). However, in the proximal epithelium of catagen VI HFs, single TrkC IR keratinocytes in the regressing epithelial strand were also TUNEL positive (Figure 4E) ▶ . Later on, ie, in catagen VI-VII, many TUNEL positive cells of the proximal club hair showed prominent TrkC IR (Figure 4F) ▶ . TrkC IR cells in the secondary hair germ often co-expressed p75NTR IR (Figure 4G) ▶ , which we had previously shown to be up-regulated during catagen development. 29
These co-localization patterns of NT-3 and/or TrkC IR with markers associated with apoptosis (TUNEL and p75NTR) 29 in cells of the regressing hair bulb suggested that NT-3 may be involved in the control of catagen and its associated keratinocyte apoptosis. 29 In view of recent reports that NTs can both suppress and induce apoptosis in different model systems, 27 we further explored the functional role of NT-3 in catagen control, studying appropriate mouse mutants, and the effect of NT-3 in murine skin organ culture.
NT-3 Overexpression Causes Precocious Catagen Development
To define whether constitutive NT-3 overexpression alters spontaneous catagen development, neonatal transgenic mice with intraepithelial NT-3 overexpression were compared with age-matched wild-type mice for the onset and speed of spontaneous HF regression. NT-3-overexpressing mice were generated using the K14 promoter, 21 which can serve as a particularly attractive model for studying the influence of NT-3 on the anagen-catagen transformation, because, in addition to the basal layer epidermal keratinocytes, K14 targets NT-3 expression to outer root sheath keratinocyte populations and to keratinocytes of the epithelial strand, secondary hair germ, and the base of the club hair (during catagen). 55,56
After the completion of HF morphogenesis (which is often mislabeled as the “first hair cycle”), the HF begins its lifelong cycle of regression, resting, and growth by spontaneous entry into the first catagen stage. 4,5,29 In normally cycling mice, this occurs around postnatal day (P) 17. Therefore, exclusively anagen VI HFs were found in the skin of wild-type controls at P14 (Figure 5A) ▶ . In striking contrast, already 30 to 40% of HFs in the skin of NT-3-overexpressing mice displayed the morphological characteristics of catagen II follicles at this time (Figure 5B) ▶ . By P17, wild-type control mice still showed no HFs in late catagen (stages VII to VIII) (Figure 5C) ▶ , whereas the HFs of NT-3-overexpressing mice were already almost all in late catagen stages (VI to VIII) (Figures 5D and 6A) ▶ ▶ .
Figure 5.
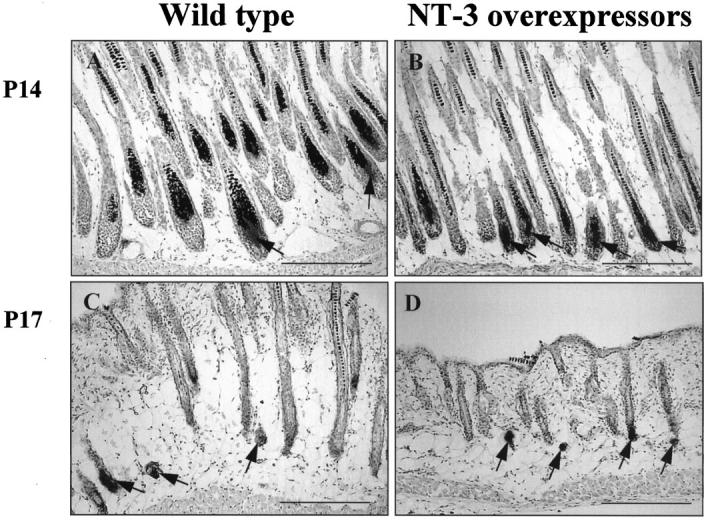
NT-3-overexpressing mice show shortening of anagen VI and precocious catagen development. Cryostat sections of back skin of NT-3-overexpressing mice and age-matched wild-type mice were generated on day 14 or 17 after birth (P14 and P17, respectively) and processed for the histochemical detection of endogenous alkaline phosphatase activity at different time points of postnatal development so as to demarcate the dermal papilla shape as a useful marker for hair cycle stage classification. 48 At P14, wild-type mice show only anagen VI HFs, characterized by the oval shape of the large, proximal hair bulb and their large dermal papilla (A, arrows). In NT-3-overexpressing mice, most HFs already display shrunken hair bulbs reduced in size as well as a decline in dermal papilla size (B, arrows), which indicates the onset of catagen development (catagen II and III). At P17, HFs of wild-type mice are mostly in mid-catagen (stage IV to VI), which is identifiable by the location of condensed dermal papillae in the lower and mid-subcutis (C, arrows). Instead, NT-3-overexpressing mice at P17 already display the characteristic thinning of late catagen skin 57 compared with wild-type controls, and HFs in the final stages of catagen development (catagen VI to VIII) are visible, as evidenced by the more distally located dermal papillae, which are now located at the dermis-subcutis border (D, arrows). The apparent decrease in the density of HFs between P14 and P17 in both wild-type and transgenic mice, in fact, is an optical illusion, caused by the dramatically shrunken tissue volume and the lack of pigmentation of catagen versus anagen VI follicles. Quantitative histomorphometry showed the total number of HFs per mm epidermal length to be the same at P14 and P17 (corrected for the discrete growth-associated increase in skin surface area during this time period; not shown). Scale bars: 200 μm.
Figure 6.

NT-3 overexpression in neonatal skin is associated with precocious catagen development, whereas heterozygous NT-3 knockout (+/−) mice display catagen retardation. The percentage of HFs in defined catagen stages was evaluated by quantitative histomorphometry in cryostat sections of back skin from NT-3-overexpressing and wild-type mice at day 17 after birth (P17, A) and in the skin of heterozygous NT-3 knockout (+/−) and wild-type (+/+) mice at P19 (B). A: In the skin of NT-3 overexpressors, HFs in early and middle catagen (catagen I to V) were absent, and the percentage of follicles in later stages of catagen development (catagen VI to VIII) was significantly increased, compared with wild-type mice (*, significant differences between identical stages of catagen development in wild-type versus NT-3-overexpressing mice; P < 0.05). B: In the skin of heterozygous NT-3 knockout (+/−) mice, the percentage of HFs in catagen VI to VII was significantly higher, compared with wild-type (+/+) mice. The latter also showed an increased number of HFs in catagen VIII and telogen (*, significant differences between identical catagen stages in wild-type versus heterozygous NT-3 knockout (+/−) mice; P < 0.05).
In addition, the skin thickness was substantially lower (P < 0.001) in NT-3-overexpressing mice (354.9 ± 15.2 μm) at P17 compared with wild-type mice (584.3 ± 12.1 μm; Figure 5, C and D ▶ ). Because murine skin thickness is strictly coupled to synchronized HF cycling, and because catagen and telogen skin is much thinner than anagen skin, 32,33,57 this also indicated that the catagen-telogen HF transition in NT-3-overexpressing mice had almost been completed at this time point. At P20, only telogen HFs were found in the skin of NT-3-overexpressing mice, whereas 25 to 30% of follicles in wild-type mice were still in catagen VII to VIII (not shown). This strongly suggests that intraepithelial NT-3 overexpression accelerates the initiation and/or development of catagen.
Reduced NT-3 Expression Is Associated with Catagen Retardation
Because mutant mice with a complete functional deletion of NT-3 gene are not viable and die shortly after birth, 30 heterozygous NT-3 knockout (+/−) mice were used as a model for studying HF regression under reduced levels of NT-3 expression. Reportedly, these mice display a reduction of NT-3 mRNA levels in brain and kidney by about 50%. 20
Heterozygous NT-3 knockout (+/−) mice displayed inverse dynamics of catagen development compared with NT-3 transgenic mice: a significant increase in the percentage of HFs in catagen VI to VII and a substantial decline in that of HFs in catagen VIII-telogen was found at P19, compared with corresponding wild-type (+/+) littermates (Figure 6B) ▶ . Also, skin in heterozygous NT-3 knockout mice was substantially thicker (435.7 ± 20.3 μm) than in wild-type animals (302.5 ± 11.6 μm, P < 0.001). This further indicated that a reduced cutaneous NT-3 expression is associated with catagen retardation.
NT-3 Accelerates Catagen Development in Murine Skin Organ Culture
Theoretically, alterations in HF cycling observed in NT-3 mouse mutants might be connected to the consequences of NT-3 overexpression or partial deletion, such as NT-3-dependent differences in the skin and HF innervation, as well as in the number and activity of Merkel cells, 20,21,30 rather than to direct effects of NT-3 on the HF. Therefore, the action of NT-3 on the follicular anagen-catagen transformation was, finally, tested in murine skin organ culture in the absence of functional skin nerves. This assay was designed to further probe the concept that NT-3 is indeed one of the few catagen-promoting agents identified so far. 4,5,47,58 NT-3 protein was added to organ-cultured murine skin with most HFs in the process of initiating the anagen VI-catagen transformation of the hair cycle. For this purpose, biopsies were taken from normally cycling C57BL/6 mouse skin 17 days after anagen induction by depilation 32 to be cultured at the air-liquid interphase on gelatin gels 31 for 48 hours in the presence or absence of NT-3 doses routinely used in NT studies (5 to 50 ng/ml). 16,23-25
Quantitative histomorphometry revealed that NT-3 did indeed accelerate catagen development in situ. There was a significant increase in the number of HFs in catagen III and an absence of HFs in late anagen VI-catagen I in those skin biopsies that had been cultured in the presence of 5 or 50 ng/ml of NT-3 (compared with vehicle controls, in which catagen II HFs dominated) (Figure 7A) ▶ . As illustrated by the representative photomicrographs shown in Figure 7, B and C ▶ , this acceleration of catagen development by one stage corresponded to a significant, morphologically easily recognizable difference in skin thickness between NT-3-treated (342.0 ± 8.6 μm) and control biopsies (408.0 ± 9.3 μm, P < 0.001). This further attested to the catagen-promoting activity of NT-3 in vitro.
Figure 7.

NT-3 accelerates catagen development in murine skin organ culture. Punch biopsies, taken from C57BL/6 mouse back skin at day 17 of the depilation-induced hair cycle (ie, with all HFs about to enter into the anagen VI-catagen transformation), were incubated during 48 hours in the presence of 5 to 50 ng/ml of NT-3, and percentage of HFs at the distinct catagen stages was evaluated. Compared with vehicle controls, a significant increase in the percentage of the catagen II and catagen III HFs (A) and a disappearance of the anagen VI-catagen I HFs was seen in skin fragments, incubated with 5 and 50 ng/ml of NT-3 (mean ± SEM, n = 8 to 10 biopsies per group, Student’s t-test). *, significant differences from the control: *P < 0.05, **P < 0.01. The representative histology presented in B and C shows that control skin fragments showed most follicles in anagen VI/catagen I (B, arrow) or catagen II (B, arrowhead), whereas only catagen II (C, small arrowhead) and catagen III (C, large arrowhead) HFs were found in skin fragments incubated with 5 ng/ml of NT-3. Note that skin thickness in the biopsy after incubation with NT-3 was also reduced compared with the control group, indicating the well appreciated reduction in skin thickness associated with progressing catagen development. 57 EP, epidermis; DER, dermis; PCM, panniculus carnosus muscle; SC, subcutis. Scale bars: 200 μm.
Discussion
HF cycling and the rhythmic production of pigmented hair shafts are the result of complex neuroectodermal-mesenchymal interactions. 3-5 These are characterized by tightly choreographed programs of keratinocyte differentiation, proliferation, and apoptosis, in which every step in tissue remodeling of the HF appears to be controlled by the local balance of inducing and inhibitory effects of numerous growth-modulatory factors. 4,5 Here, we provide evidence that NT-3, an essential neurotrophic factor for the development and function of selected neuronal cell populations in sensory and sympathetic ganglia as well as for cutaneous mechanoreceptors, 9,20,21,30 is one such factor.
Furthermore, we here identify NT-3 as one of the factors in the growing list of putative catagen control signals, such as fibroblast growth factor 5, insulin-like growth factor-1, transforming growth factor-β, and PTHrp (compare Refs. 4, 5, and 58): NT-3 expression is highest during the initiation of apotosis-driven HF regression (Figure 1) ▶ , NT-3 and TrkC expression is up-regulated in the regressing hair bulb (Figures 2 and 3) ▶ ▶ , and both NT-3- and TrkC IR are co-expressed by TUNEL+ keratinocytes of the regressing HF bulb (Figure 4) ▶ . In addition, NT-3 overexpression is associated with accelerated catagen development, whereas a reduction in the constitutive NT-3 expression causes catagen retardation (Figures 5 and 6) ▶ ▶ . Finally, NT-3 administration accelerates catagen development in murine skin organ culture even in the absence of functional skin nerves (Figure 7) ▶ .
Compared with other NTs, the level of NT-3 protein found in adolescent C57BL/6 mouse skin (Figure 1) ▶ are surprisingly high, if one considers that, at this time, the development of cutaneous innervation has already been finalized. 59 Our observations in mouse skin are in line with a report that the levels of NT-3 protein in nonneuronal tissues and internal organs of rats are actually higher than in brain, 60 suggesting additional, nonneuronal functions of NT-3 in those organs during postnatal life. Skeletal muscle is known to express high levels of NT-3 during embryonic and postnatal ontogenesis, which may be required for the development and function of motor neurons, muscle spindles, and Golgi tendon organs. 30,61 Therefore, the panniculus carnosus muscle in murine subcutis may well be a major source of the high basal level of NT-3 protein in adolescent C57BL/6 mouse skin (note the high NT-3 IR of this muscle layer depicted in Figure 2H ▶ ). Although additional in situ hybridization evidence is required to show that this subcutaneous striated muscle layer really is a major NT-3 source in normal rodent skin, our study encourages one to further explore the role of NT-3 in the biology of mature myocytes long after the completion of myogenesis.
Our data suggest that, besides the subcutaneous muscle layer and the piloneural complex (Figure 2, A and B) ▶ , the HF itself is another key NT-3 source in murine skin. Follicular NT-3 expression showed striking hair cycle-dependent differences, NT-3 IR was more widely distributed in the anagen and catagen HFs compared with the telogen stage. Namely, in anagen VI HFs, NT-3 IR was found in that part of the innermost layer of the outer root sheath that shows trichilemmal keratinization (Figure 2E) ▶ . This peculiar follicular keratinization pattern is characterized by intricate infoldings of nonkeratinized and keratinized cells with specific patterns of intracellular filament organization and keratin expression. 53,62,63 Because keratinocytes in this area undergo apoptosis (in guinea pig HFs), 64 apoptosis may be a necessary component for the occurrence of trichilemmal keratinization. Using TUNEL staining as a marker of apoptotic cells, 23,29 our study reveals that some TUNEL+ keratinocytes of the innermost outer root sheath also express NT-3 IR (Figure 4A) ▶ . Although TUNEL positivity does not always reflect apoptosis, 29,65-67 this raises the possibility that NT-3 is involved in the modulation of epithelial cell apoptosis in this HF compartment. However, it remains to be formally excluded by immunoelectron microscopy that TUNEL+/NT-3+ cells are in the final stage of terminal differentiation, rather than in apoptosis.
NT-3 is strongly expressed by selected populations of HF keratinocytes as well as by dermal papilla fibroblasts during anagen and catagen (Figures 2 and 3) ▶ ▶ , whereas cutaneous NT-3 gene transcription is up-regulated during this time (Figure 1) ▶ . Therefore, it is reasonable to speculate that follicular NT-3 expression is tightly coupled to the cyclic growth and regression activity of the HF. The highest levels of NT-3 gene expression and NT-3 protein content are found during early catagen (Figure 1) ▶ . Together with our finding that infantile NT-3 transgenic mice show precocious development of their first entry into catagen (Figures 5 and 6A) ▶ ▶ , whereas catagen development is retarded in mice with substantially diminished NT-3 skin levels (Figure 6B) ▶ , this strongly suggests that NT-3 stimulates the anagen-catagen-telogen transformation of the HF. This is supported by direct proof that NT-3 promotes catagen development in murine skin organ culture (Figure 7) ▶ .
Spontaneous catagen development is a tightly coordinated and stringently controlled process, which is thought to include a termination of growth factor production by dermal papilla fibroblasts, leading to a sudden decline in hair matrix keratinocyte proliferation and hair shaft production, 4,5,68 to the induction of keratinocyte apoptosis in selected HF compartments, 4,29,64 and to active club hair formation with its special type of trichilemmal keratinization that prevents hair loss during telogen. 53,62,69 Obviously, NT-3-mediated stimulation of HF regression might be achieved via any of these mechanisms, in addition to the up-regulation of other, as yet unknown catagen-promoting parameters by NT-3. 4
Given that, as we demonstrate here, dermal papilla fibroblasts express TrkC receptor only in late anagen (Figure 2I) ▶ , NT-3 may directly stimulate TrkC-expressing dermal papilla fibroblasts, the accepted key mesenchymal control element of HF cycling. 4,5,68 However, NT-3 can also bind with low affinity to TrkB receptors, 12,70 which are expressed by dermal papilla fibroblasts during early catagen (Botchkarev VA, Botchkareva N, and Paus R, unpublished observation). This raises the possibility that NT-3/TrkB signaling may also contribute to promoting the dermal papilla transformation from an anagen-supporting state to its catagen/telogen state.
It can currently not be excluded that any of the proposed effects of NT-3/TrkC signaling on keratinocyte apoptosis and/or terminal differentiation primarily reflect a stimulation of the elusive molecular mechanisms that control catagen induction and, thus, indirectly catagen-associated keratinocyte apoptosis and differentiation. In our present, very limited state of understanding of the controls of catagen development, 4,5 it is probably wisest to operate with the working hypothesis that NT-3/TrkC signaling is just one important element in the intrinsic “clock” that determines the switch-on of catagen as the net result of multiple catagen-promoting as well as catagen-suppressing factors (for a detailed discussion, see Ref. 4 ).
However, our data encourage one to consider that NT-3 is, at least in part, directly involved in the regulation of keratinocyte apoptosis during catagen: in catagen IV HFs, in which there is maximal apoptosis in hair matrix keratinocytes, 29 NT-3 IR is found in the cytoplasm of many TUNEL+ keratinocytes (Figure 4B) ▶ , and numerous TUNEL+ apoptotic cells and apoptotic bodies located in the epithelial strand and secondary germ during catagen VI to VII had NT-3 IR (Figure 4, C and D) ▶ . In other models, eg, dorsal root ganglion neurons, apoptotic cells produce BDNF before their death to rescue bystander cells in their direct vicinity, thus promoting the survival of BDNF-dependent neuronal populations. 71 Therefore, before their final apoptotic death, selected keratinocytes in the regressing hair bulb might produce NT-3 to provide a high local concentration of NT-3 for selected, TrkC-expressing HF cell populations (Figures 2L and 4, E and F) ▶ ▶ designated to survive for future use during the subsequent hair cycle.
Our data also indicate that during late catagen, some TrkC+ keratinocytes display intracellular TUNEL+ granules (Figure 4E) ▶ or even TUNEL+ nuclei (Figure 4F) ▶ . This strongly suggests that there is also a subpopulation of TrkC+ HF cells in the proximal club hair and in the epithelial strand, which is induced to switch on apoptosis by NT-3 stimulation. This speculation is encouraged by recent data indicating that another NT, NGF, besides its well established antiapoptotic properties, 9,12 can also induce apoptosis in selected model systems (compare Refs. 26-28 ). In addition, there appears to be yet another subpopulation of TrkC+ keratinocytes in the secondary hair germ of catagen VI HFs, which co-expresses p75NTR and TrkC (Figure 4G) ▶ . These cells might represent HF keratinocytes selected for survival, given that the co-stimulation of p75NTR and Trk receptors reportedly promotes the antiapoptotic effects of NTs. 27
Because NT-3 is strongly expressed by keratinocytes of the secondary hair germ, and because some of these keratinocytes also show a TUNEL+ nucleus during catagen VI to VII (Figure 4D) ▶ , it is reasonable to ask whether NT-3 is also involved in the complex regulation of club hair formation, 5,54 of which trichilemmal keratinization is considered an important component. 53,62,69 This unique process of keratinocyte terminal differentiation in the outer root sheath is associated with the synthesis of specific keratins, special expression patterns of adhesion molecules, and apoptosis. 29,53,55,62-64,72,73 Because several cells in the identified zones of trichilemmal keratinization (anagen: innermost outer root sheath in the HF isthmus region; catagen and telogen: proximal club hair) NT-3/TUNEL double positive (Figure 4, A and D) ▶ , this suggests that NT-3/TrkC signaling may be an important element in the control of keratinocyte terminal differentiation and/or apoptosis during normal club hair formation and trichilemmal keratinization in murine HF.
Finally, given that abnormalities in catagen development are a key element in the pathogenesis of most human hair growth disorders, 4 TrkC agonists and antagonists deserve to be systematically explored for the management of hair growth disorders, in which premature catagen entry of scalp HF causes effluvium and/or alopecia, or where retarded catagen development leads to excessive hair growth (hirsutism/hypertrichosis). Thus, there are both biologically and clinically compelling reasons to make NTs of the NGF family and their receptors a new focus of basic and applied hair research.
Acknowledgments
The helpful discussions with Dr. A. Panteleyev, as well as the excellent technical assistance of R. Pliet, R. Böhmer, C. van der Veen, E. Hagen, T. Perrone, and A. Scheer and the support of Dr. F. Noser are gratefully acknowledged.
Footnotes
Address reprint requests to Dr. Ralf Paus, Department of Dermatology, Charité, Humboldt-Universität zu Berlin, Schumannstrasse 20/21, D-10117, Berlin, Germany. E-mail: ralfpaus@cherite.de.
Supported by grants from Deutsche Forschungsgemeinschaft (Pa 345/6-1) and Wella AG, Darmstadt (to RP), and National Institute of Neurological Diseases and Stroke grant Rol NS 33730 (to KMA).
References
- 1.Donovan MJ, Hahn R, Tessarollo L, Hempstead BL: Identification of an essential nonneuronal function of neurotrophin 3 in mammalian cardiac development. Nat Genet 1996, 14:210-213 [DOI] [PubMed] [Google Scholar]
- 2.Moore MW, Klein RD, Farinas I, Sauer H, Armanini M, Phillips H, Reichardt LF, Ryan AM, CarverMoore K, Rosenthal A: Renal and neuronal abnormalities in mice lacking GDNF. Nature 1996, 382:76-79 [DOI] [PubMed] [Google Scholar]
- 3.Paus R, Peters EMJ, Eichmüller S, Botchkarev VA: Neural mechanisms of hair growth control. J Invest Dermatol Symp Proc 1997, 2:61-68 [DOI] [PubMed] [Google Scholar]
- 4.Paus R: Control of the hair cycle and hair diseases as cycling disorders. Curr Opin Dermatol 1996, 3:248-258 [Google Scholar]
- 5.Stenn KS, Combates NJ, Eilertsen KJ, Gordon JS, Pardinas JR, Paromoo S, Prouty SM: Hair follicle growth control. Dermatol Clin 1996, 14:543-557 [DOI] [PubMed] [Google Scholar]
- 6.Botchkarev VA, Botchkareva NV, Albers KM, Lewin GR, van der Veen C, Paus R: Neurotrophin-3 is involved in the regulation of hair follicle morphogenesis. J Invest Dermatol 1998 (in press) [DOI] [PubMed]
- 7.Crowley C, Spencer SD, Nishimura MC, Chen KS, Peets-Meek S, Armanini MP, Ling LH, McMahon SB, Shelton DL, Levinson AD, Phillips HS: Mice lacking nerve growth factor display perinatal loss of sensory and sympathetic neurons yet develop basal forebrain cholinergic neurons. Cell 1994, 76:1001-1011 [DOI] [PubMed] [Google Scholar]
- 8.Maisonpierre PC, Le Beau MM, Espinosa Rd, Ip NY, Belluscio L, de la Monte SM, Squinto S, Furth ME, Yancopoulos GD: Human and rat brain-derived neurotrophic factor and neurotrophin-3: gene structures, distributions, and chromosomal localizations. Genomics 1991, 10:558-568 [DOI] [PubMed] [Google Scholar]
- 9.Lewin GR, Barde YA: Physiology of the neurotrophins. Annu Rev Neurosci 1996, 19:289-317 [DOI] [PubMed] [Google Scholar]
- 10.Lamballe F, Klein R, Barbacid M: trkC, a new member of the trk family of tyrosine protein kinases, is a receptor for neurotrophin-3. Cell 1991, 66:967-979 [DOI] [PubMed] [Google Scholar]
- 11.Chao MV: The p75 neurotrophin receptor. J Neurobiol 1994, 25:1373-1385 [DOI] [PubMed] [Google Scholar]
- 12.Bothwell M: Functional interactions of neurotrophins and neurotrophin receptors. Annu Rev Neurosci 1995, 18:223-253 [DOI] [PubMed] [Google Scholar]
- 13.Ernfors P, Merlio J-P, Persson H: Cells expressing mRNA for neurotrophins and their receptors during embryonic rat development. Eur J Neurosci 1992, 4:1140-1158 [DOI] [PubMed] [Google Scholar]
- 14.Tessarollo L, Tsoulfas P, Martin Zanca D, Gilbert DJ, Jenkins NA, Copeland NG, Parada LF: trkC, a receptor for neurotrophin-3, is widely expressed in the developing nervous system and in non-neuronal tissues. Development 1993, 118:463-475 [DOI] [PubMed] [Google Scholar]
- 15.Cartwright M, Mikheev AM, Heinrich G: Expression of neurotrophin genes in human fibroblasts: differential regulation of the brain-derived neurotrophic factor gene. Int J Dev Neurosci 1994, 12:685-693 [DOI] [PubMed] [Google Scholar]
- 16.Yaar M, Eller MS, DiBenedetto P, Reenstra WR, Zhai S, McQuaid T, Archambault M, Gilchrest BA: The trk family of receptors mediates nerve growth factor and neurotrophin-3 effects in melanocytes. J Clin Invest 1994, 94:1550-1562 [DOI] [PMC free article] [PubMed] [Google Scholar]
- 17.Bronzetti E, Ciraco E, Germana G, Vega JA: Immunocytochemical localization of neurotrophin receptor proteins in human skin. Ital J Anat Embryol 1996, 100(Suppl 1):565-571 [PubMed] [Google Scholar]
- 18.Shibayama E, Koizumi H: Cellular localization of the Trk neurotrophin receptor family in human non-neuronal tissues. Am J Pathol 1996, 148:1807-1818 [PMC free article] [PubMed] [Google Scholar]
- 19.Terenghi G, Mann D, Kopelman PG, Anand P: TrkA and trkC expression is increased in human diabetic skin. Neurosci Lett 1997, 228:33-36 [DOI] [PubMed] [Google Scholar]
- 20.Airaksinen MS, Koltzenburg M, Lewin GR, Masu Y, Helbig C, Wolf E, Brem G, Toyka KV, Thoenen H, Meyer M: Specific subtypes of cutaneous mechanoreceptors require neurotrophin-3 following peripheral target innervation. Neuron 1996, 16:287-295 [DOI] [PubMed] [Google Scholar]
- 21.Albers KM, Perrone TN, Goodness TP, Jones ME, Green MA, Davis BM: Cutaneous overexpression of NT-3 increases sensory and sympathetic neuron number and enhances touch dome and hair follicle innervation. J Cell Biol 1996, 134:487-497 [DOI] [PMC free article] [PubMed] [Google Scholar]
- 22.Pincelli C, Yaar M: Nerve growth factor: its significance in cutaneous biology. J Invest Dermatol Symp Proc 1997, 2:31-36 [DOI] [PubMed] [Google Scholar]
- 23.Pincelli C, Haake AR, Benassi L, Grassilli E, Magoni C, Ottani D, Polakowska R, Franceschi C, Gianetti A: Autocrine nerve growth factor protects human keratinocytes from apoptosis through its high affinity receptor (Trk): a role for Bcl-2. J Invest Dermatol 1997, 109:757-764 [DOI] [PubMed] [Google Scholar]
- 24.Paus R, Lüftl M, Czarnetzki BM: Nerve growth factor modulates keratinocyte proliferation in murine skin organ culture. Br J Dermatol 1994, 130:174-180 [DOI] [PubMed] [Google Scholar]
- 25.Zhai S, Yaar M, Doyle SM, Gilchrest BA: Nerve growth factor rescues pigment cells from ultraviolet-induced apoptosis by upregulating BCL-2 levels. Exp Cell Res 1996, 224:335-343 [DOI] [PubMed] [Google Scholar]
- 26.Carter BD, Kaltschmidt C, Kaltschmidt B, Offenhauser N, Bohm Matthaei R, Baeuerle PA, Barde YA: Selective activation of NF-κB by nerve growth factor through the neurotrophin receptor p75. Science 1996, 272:542-545 [DOI] [PubMed] [Google Scholar]
- 27.Carter BD, Lewin GR: Neurotrophins live or let die: does p75NTR decide? Neuron 1997, 18:187-190 [DOI] [PubMed] [Google Scholar]
- 28.Muragaki Y, Chou TT, Kaplan DR, Trojanowski JQ, Lee VMY: Nerve growth factor induces apoptosis in human medulloblastoma cell lines that express TrkA receptors. J Neurosci 1997, 17:530-542 [DOI] [PMC free article] [PubMed] [Google Scholar]
- 29.Lindner G, Botchkarev VA, Botchkareva NV, Ling G, Paus R: Analysis of apoptosis during hair follicle regression (catagen). Am J Pathol 1997, 151:1601-1617 [PMC free article] [PubMed] [Google Scholar]
- 30.Ernfors P, Lee KF, Kucera J, Jaenisch R: Lack of neurotrophin-3 leads to deficiencies in the peripheral nervous system and loss of limb proprioceptive afferents. Cell 1994, 77:503-512 [DOI] [PubMed] [Google Scholar]
- 31.Li L, Paus R, Slominski A, Hoffman RM: Skin histoculture assay for studying the hair cycle. In Vitro Cell Dev Biol 1992, 28:695-698 [DOI] [PubMed] [Google Scholar]
- 32.Paus R, Stenn KS, Link RE: Telogen skin contains an inhibitor of hair growth. Br J Dermatol 1990, 122:777-784 [DOI] [PubMed] [Google Scholar]
- 33.Chase HB: Growth of the hair. Physiol Rev 1954, 34:113-126 [DOI] [PubMed] [Google Scholar]
- 34.Paus R, Hofmann U, Eichmüller S, Czarnetzki BM: Distribution and changing density of γ-delta T cells in murine skin during the induced hair cycle. Br J Dermatol 1994, 130:281-289 [DOI] [PubMed] [Google Scholar]
- 35.Pethö-Schramm A, Müller H-J, Paus R: FGF5, and the murine hair cycle. Arch Dermatol Res 1996, 288:264-266 [DOI] [PubMed] [Google Scholar]
- 36.Welker P, Foitzik K, Bulfone-Paus S, Henz BM, Paus R: Hair cycle-dependent changes in the gene expression and protein content of transforming growth factor β1 and β3 in murine skin. Arch Dermatol Res 1997, 289:554-557 [DOI] [PubMed] [Google Scholar]
- 37.Nakanishi T, Ohyama K, Aoki C, Kudo A, Hattori T, Takahashi K, Taniguchi S, Takigawa M: Expression of trkc in a mouse osteoblastic cell line and its response to neurotrophin-3. Biochem Biophys Res Commun 1994, 203:1268-1274 [DOI] [PubMed] [Google Scholar]
- 38.Nakanishi T, Takahashi K, Aoki C, Nishikawa K, Hattori T, Taniguchi S: Expression of nerve growth factor family neurotrophins in a mouse osteoblastic cell line. Biochem Biophys Res Commun 1994, 198:891-897 [DOI] [PubMed] [Google Scholar]
- 39.Sambrook J, Fritsch EF, Maniatis T: Molecular Cloning: A Laboratory Manual. 1989. Cold Spring Harbor Laboratory, Cold Spring Harbor, NY,
- 40.Huber LJ, Hempstead B, Donovan MJ: Neurotrophin and neurotrophin receptors in human fetal kidney. Dev Biol 1996, 179:369-381 [DOI] [PubMed] [Google Scholar]
- 41.Vickland H, Silver J: Immunostaining of glial cells with Promega’s anti-human neurotrophin antibodies. Neural Notes 1995, 1(2):8-10 [Google Scholar]
- 42.Botchkarev VA, Eichmüller S, Peters EMJ, Pietsch P, Johansson O, Maurer M, Paus R: A simple fluorescent technique for co-visualization of mast cells and nerve fibers reveals selectivity and hair cycle-dependent changes in mast cell-nerve fiber contacts in skin. Arch Dermatol Res 1997, 289:292-302 [DOI] [PubMed] [Google Scholar]
- 43.Schindler KS, Roth KA: Double immunofluorescent staining using two unconjugated primary antisera raised in the same species. J Histochem Cytochem 1996, 44:1331-1335 [DOI] [PubMed] [Google Scholar]
- 44.van Gijlswijk RPM, Zijlmans HJMAA, Wiegant J, Bobrow MN, Erikson TJ, Adler KE, Tanke HJ, Raap AK: Fluorochrome-labelled tyramides: use in immunocytochemistry and fluorescence in situ hybridization. J Histochem Cytochem 1997, 45:375-382 [DOI] [PubMed] [Google Scholar]
- 45.Heckers S, Ohtake T, Wiley RG, Lappi DA, Geula C, Mesulam MM: Complete and selective cholinergic denervation of rat neocortex and hippocampus but not amygdala by an immunotoxin against the p75 NGF receptor. J Neurosci 1994, 14:1271-1289 [DOI] [PMC free article] [PubMed] [Google Scholar]
- 46.Bulfone-Paus S, Ungureanu D, Pohl T, Lindner G, Paus R, Ruckert R, Krause H, Kunzendorf U: Interleukin-15 protects from lethal apoptosis in vivo. Nat Med 1997, 3:1124-1128 [DOI] [PubMed] [Google Scholar]
- 47.Paus R, Foitzik K, Welker P, Bulfone-Paus S, Eichmüller S: Transforming growth factor-β receptor type I and type II expression during murine hair follicle development and cycling. J Invest Dermatol 1997, 109:518-526 [DOI] [PubMed] [Google Scholar]
- 48.Handjiski B, Eichmüller S, Hofmann U, Czarnetzki BM, Paus R: Alkaline phosphatase activity and localization during the murine hair cycle. Br J Dermatol 1994, 131:303-310 [DOI] [PubMed] [Google Scholar]
- 49.Paus R, Handjiski B, Eichmüller S, Czarnetzki BM: Chemotherapy-induced alopecia in mice: induction by cyclophosphamide, inhibition by cyclosporine A, and modulation by dexamethasone. Am J Pathol 1994, 144:719-734 [PMC free article] [PubMed] [Google Scholar]
- 50.Straile WZ, Chase HB, Arsenault C: Growth and differentiation of hair follicles between activity and quiescence. J Exp Zool 1961, 148:205-222 [DOI] [PubMed] [Google Scholar]
- 51.Paus R, Handjiski B, Czarnetzki BM, Eichmüller S: A murine model for inducing and manipulating hair follicle regression (catagen): effects of dexamethasone and cyclosporin A. J Invest Dermatol 1994, 103:143-147 [DOI] [PubMed] [Google Scholar]
- 52.Botchkarev VA, Eichmüller S, Johansson O, Paus R: Hair cycle-dependent plasticity of skin and hair follicle innervation in normal murine skin. J Comp Neurol 1997, 386:379-395 [DOI] [PubMed] [Google Scholar]
- 53.Pinkus H, Iwasaki T, Mishima Y: Outer root sheath keratinization in anagen and catagen of the mammalian hair follicle: a seventh distinct type of keratinization in the hair follicle: trichilemmal keratinization. J Anat 1981, 133:19-35 [PMC free article] [PubMed] [Google Scholar]
- 54.Cotsarelis G, Sun TT, Lavker RM: Label-retaining cells reside in the bulge area of pilosebaceous unit: implications for follicular stem cells, hair cycle, and skin carcinogenesis. Cell 1990, 61:1329-1337 [DOI] [PubMed] [Google Scholar]
- 55.Commo S, Bernard BA: Immunohistochemical analysis of tissue remodelling during the anagen-catagen transition of the human hair follicle. Br J Dermatol 1997, 137:31-38 [PubMed] [Google Scholar]
- 56.Bowden PE, Hainey SD, Parker G, Jones DO, Zimonjic D, Popescu N, Hodgins M: Characterization and chromosomal localization of human hair-specific keratin genes and comparative expression during the hair growth cycle. J Invest Dermatol 1998, 110:158-164 [DOI] [PubMed] [Google Scholar]
- 57.Hansen LS, Coggle JE, Wells J, Charles MW: The influence of the hair cycle on the thickness of mouse skin. Anat Rec 1984, 210:569-573 [DOI] [PubMed] [Google Scholar]
- 58.Schilli M, Ray S, Paus R, Obi-Tabot E, Holick MF: Control of hair growth with parathyroid hormone (7–34). J Invest Dermatol 1997, 109:928-932 [DOI] [PubMed] [Google Scholar]
- 59.Schotzinger RJ, Landis SC: Postnatal development of autonomic and sensory innervation of thoracic hairy skin in the rat: a histochemical, immunocytochemical, and radioenzymatic study. Cell Tissue Res 1990, 260:575-587 [DOI] [PubMed] [Google Scholar]
- 60.Katoh-Semba R, Kaisho Y, Shintani A, Nagahama M, Kato K: Tissue distribution and immunocytochemical localization of neurotrophin-3 in the brain and peripheral tissues of rats. J Neurochem 1996, 66:330-337 [DOI] [PubMed] [Google Scholar]
- 61.Wright DE, Zhou L, Kucera J, Snider WD: Introduction of a neurotrophin-3 transgene into muscle selectively rescues proprioceptive neurons in mice lacking endogenous neurotrophin-3. Neuron 1997, 19:503-517 [DOI] [PubMed] [Google Scholar]
- 62.Ito M: The innermost cell layer of the outer root sheath in anagen hair follicle: light and electron microscopic study. Arch Dermatol Res 1986, 279:112-119 [DOI] [PubMed] [Google Scholar]
- 63.Panteleyev AA, Paus R, Wanner R, Nurnberg W, Eichmüller S, Thiel R, Zhang J, Henz BM, Rosenbach T: Keratin 17 gene expression during the murine hair cycle. J Invest Dermatol 1997, 108:324-329 [DOI] [PubMed] [Google Scholar]
- 64.Kishimoto S, Nagata M, Takenaka H, Shibagaki R, Yasuno H: Detection of programmed cell death in anagen hair follicles of guinea pig skin by labelling of nick ends of fragmented DNA. Arch Dermatol Res 1997, 289:603-605 [DOI] [PubMed] [Google Scholar]
- 65.Cotter S, Martin T: Techniques in Apoptosis. 1996. Portland Press, London
- 66.Paus R, Rosenbach T, Haas N, Czarnetzki BM: Patterns of cell death: the significance of apoptosis for dermatology. Exp Dermatol 1993, 2:3-11 [DOI] [PubMed] [Google Scholar]
- 67.Haake AR, Cooklis M: Incomplete differentiation of fetal keratinocytes in the skin equivalent leads to the default pathway of apoptosis. Exp Cell Res 1997, 231:83-95 [DOI] [PubMed] [Google Scholar]
- 68.Jahoda CAB, Reynolds AJ: Dermal epidermal interactions: adult follicle derived cell populations and hair growth. Dermatol Clin 1996, 14:573-583 [DOI] [PubMed] [Google Scholar]
- 69.Parakkal PF: Morphogenesis of the hair follicle during catagen. Z Zellforsch Mikrosk Anat 1970, 107:174-186 [DOI] [PubMed] [Google Scholar]
- 70.Bothwell M: Neurotrophin function in skin. J Invest Dermatol Symp Proc 1997, 2:27-30 [DOI] [PubMed] [Google Scholar]
- 71.Robinson M, Buj-Bello A, Davies AM: Paracrine interactions of BDNF involving NGF-dependent embryonic sensory neurons. Mol Cell Neurosci 1996, 7:143-151 [DOI] [PubMed] [Google Scholar]
- 72.Honda Y, Egawa K, Kuroki M, Ono T: Hair cycle-dependent expression of a nonspecific cross reacting antigen (NCA)-50/90-like molecule on follicular keratinocytes. Arch Dermatol Res 1997, 289:457-465 [DOI] [PubMed] [Google Scholar]
- 73.Koch P, Maloney MG, Ishikawa H, Pulkkinenn L, Uitto J, Shultz L, Murphy GF, Whitaker-Menezes D, Stanley JR: Targeted disruption of the pemphigus vulgaris antigen (desmoglein 3) gene in mice causes loss of keratinocyte cell adhesion with a phenotype similar to pemphigus vulgaris. J Cell Biol 1997, 137:1091-1102 [DOI] [PMC free article] [PubMed] [Google Scholar]