

Abstract
Complement-mediated lysis of cancer cells growing in three-dimensional aggregates involves factors that are not associated with the killing of cells in suspension. We have used multicellular tumor spheroids established from breast carcinoma (T47D) and ovarian teratocarcinoma (PA-1) cell lines as models to study complement-mediated destruction of micrometastases and small solid tumors. We found that significant killing of microtumors treated with an antitumor antibody and a specific monoclonal antibody (YTH53.1) against the complement lysis inhibitor protectin (CD59) started to occur after a 1 to 2-hour lag phase. After an overnight incubation, the microtumors became totally infiltrated by the YTH53.1 monoclonal antibody and C1q, whereas C3 and C5b-9 penetrated as a frontier to the peripheral cell layers. A 51Cr release assay showed that during a 24-hour pulsed treatment with complement, 33% of cells in the spheroids were killed, and the average tumor volume decreased by 28%. According to propidium iodide staining, complement exposure resulted in killing and peeling off of the outermost tumor cells.
Micrometastases and residual malignant cells after surgery constitute an important clinical problem in cancer therapy. One strategy to remove the remnant malignant cells is to use monoclonal antibodies (mAbs) conjugated to cytotoxic molecules (eg, ricin). 1 An alternative approach is to use endogenous effector systems such as complement (C), natural killer cells, or antibody-dependent cellular cytotoxicity for the killing of malignant cells. Ideally, tumor-specific C-activating mAbs would be used to target C attack against tumor cells. The problems here are to find suitable mAbs and to overcome the resistance of the tumor cells against C killing. Although tumors seldom express truly “tumor-specific” antigens, they can express antigens that are relatively specific for the tumor cell type (eg, lymphomas) or for the tissue of tumor origin (eg, ovarian tumors). The immune system can recognize antigens that reflect the differentiation state of the normal cell counterpart. An example is high-affinity antibodies against the melanocyte differentiation antigen gp75 in melanoma. 2,3
To be able to survive and proliferate, tumor cells need to escape the human immune defense mechanisms, including the cytolytic C system. As on normal nucleated cells, the activation of C on tumor cells is usually regulated at two steps by cell surface proteins. The C3/C5 convertases are inhibited by decay-accelerating factor (CD55) and membrane cofactor protein (MCP, CD46), 4,5 and formation of the C membrane attack complex is inhibited by a low molecular weight protein called MACIF, MIRL, or protectin (CD59). 6,7 Protectin inhibits the C transmembrane channel formation by binding to C components C8 and C9 and preventing C9 polymerization. 8,9 The glycophosphoinositol-anchored protectin is widely and abundantly distributed in normal tissues in the body. 10 High expression levels have also been found on most types of malignant cells studied to date. 11-17
Our earlier studies have shown that by inactivating protectin with the monoclonal anti-CD59 antibody YTH53.1, it is possible to increase the sensitivity of breast carcinoma (T47D and MCF7), melanoma (G361), and glioma cells to C lysis. 13,14,17 However, because malignant cells usually grow as multicellular tumors in vivo, complicating factors such as intercellular connections between the tumor cells may constitute an additional barrier against C attack. Cell lysis by complement involves the sequential activation of 11 different proteins in the classical pathway. If not restricted, C activation becomes amplified and can spread to nearby areas during progression of the classical pathway and by recruitment of the alternative pathway. So far, little information is available concerning the ability of C components to penetrate into three-dimensional tissue. As C-mediated tissue destruction is difficult to study in vivo, we have set up a microtumor spheroid (MTS) model to study C activation and penetration of C components into the tumor tissue. MTSs are spherical aggregates of cells growing in culture. Their size may range from a few cells to visible structures of 1 to 2 mm in diameter until the growth is limited by restricted diffusion of oxygen and nutrients. Cells growing in MTS resemble tumor tissue with their intercellular connections. 18 As such, they represent an intermediate between monolayer cell cultures and tumors in vivo. 19 Spheroids have been used to study the penetration of antibodies and the optimization of radioimmunotherapy, as well as the effect of lymphokine-activated killer cells against tumor tissue. 20-24
We have established MTS from the T47D breast carcinoma and PA-1 teratocarcinoma cell lines. Our previous study indicated that PA-1 cells in spheroids were more resistant to C lysis than PA-1 cells growing in suspension. 25 During a standard 30-minute incubation, the C components became deposited on the MTS surface but did not lead to significant cell killing. In the present study, we wanted to find ways to overcome the C resistance of MTS. We examined whether it is possible to kill cells in the spheroids by neutralizing the membrane attack complex inhibitor protectin, prolonging the time of C exposure, and by replacing C that may become consumed during short-term incubations. C killing of cells in spheroids necessitates that C components penetrate into the tumor tissue. To determine the limiting step in C attack against spheroids, we analyzed how the C components C1q, C3, and C5b-9 became deposited on the various cell layers in the spheroids during a pulsed and prolonged C treatment. By using different labeling methods, we were able to simultaneously monitor C penetration, changes in cell membrane permeability, and cell detachment.
Materials and Methods
Antibodies and Sera
A murine monoclonal antibody (mAb) to human CD59 (BRIC229) was purchased from Bio-Products Laboratory (Elstree, UK). A cell line producing a rat mAb against CD59 (YTH53.1) was originally obtained from Prof. H. Waldmann (Sir William Dunn School of Pathology, Oxford, UK). The isolation and biotinylation of YTH53.1 (immunoglobulin (Ig) G2b) have been described previously. 26 Purified rat immunoglobulins were purchased from Sigma Chemical Co. (St. Louis, MO). Rabbit antiserum to human breast cancer cells (S2) was raised by immunizing a rabbit three times with 10 7 heat-killed MCF7 (breast adenocarcinoma) cells intramuscularly. 13 S2 IgG was isolated by protein G affinity chromatography (Pharmacia-LKB Biotechnology, Uppsala, Sweden). The potential inherent anti-CD59 reactivity of the S2 IgG was removed by absorbing the IgG with human erythrocytes. IgG isolated from a preimmunization serum (S0) of the rabbit was used as a control antibody. Mouse mAb to human iC3b neoantigen and goat antiserum to human C1q were from Quidel Corp. (San Diego, CA). Mouse mAb (Wu) to C5b-9 was kindly obtained from Dr. R. Würzner (University of Innsbruck, Innsbruck, Austria). Mouse mAbs (IgG1) to human Fc receptors: FcγRI (clone 10.1), FcγRII (clone C1KM5), and FcγRIII (clone 3G8) were obtained from Caltag Laboratories (Burlingame, CA). Fluorescein isothiocyanate (FITC)-conjugated antibodies to rabbit Igs were purchased from Jackson ImmunoResearch Laboratories (West Grove, PA). FITC-conjugated rat antibody to mouse IgG was from Boehringer Mannheim Biochemicals (Indianapolis, IN). FITC-conjugated antibody to rat immunoglobulins was obtained from DAKO A/S (Glostrup, Denmark). Normal human serum (NHS) that served as a source of complement was prepared from coagulated blood of healthy volunteers and stored at −70°C until used.
Cell Lines and Generation of Spheroids
A human ductal breast carcinoma cell line, T47D, 27 and an ovarian teratocarcinoma cell line, PA-1, 28 were obtained from American Type Culture Collection (Manassas, VA). Cells were maintained in culture in RPMI 1640 (Gibco, Paisley, UK) supplemented with 10% fetal calf serum, 2 mmol/L l-glutamine, and antibiotics (10 U/ml penicillin and 100 mg/ml streptomycin) at 37°C in humidified air with 5% CO2. Cells were grown as monolayers in 75-cm 2 cell culture flasks until confluent and trypsinized into suspension. T47D and PA-1 spheroids were cultured by a modification of a liquid overlay technique. 18 The growth of the spheroids was initiated by plating 2 × 10 3 cells per well in 200 μl of RPMI 1640 on 96-well U-bottomed microtiter plates (Costar, Cambridge, MA) coated with a thin layer of 0.5% agarose. The agar prevented the attachment of the cells to the plate, resulting in the formation of one spherical cell aggregate per well. Individual spheroids were grown for 10 to 14 days. Spheroids selected for the experiments were photographed and scanned from the negatives with an AGFA Arcus II color scanner. The scanned spheroids were analyzed using the NIH Image program (developed at the National Institutes of Health) and a Power Macintosh 7200/90 computer to determine the diameters and volumes of the particles. Some of the spheroids were trypsinized to count the cell number.
Chromium Release Assay for Spheroids
C-mediated cytotoxicity against tumor cells growing in spheroids was determined by a chromium release assay. T47D or PA-1 spheroids were individually labeled with 3 μCi of sodium chromate (51Cr; Amersham International, Buckinghamshire, UK) in 100 μl of RPMI 1640 for 12 hours at 37°C. To remove the unbound or loosely bound 51Cr, MTSs were washed three times with the cell culture medium and incubated for a further 60 minutes. The washing procedure was repeated, and the spheroids were finally placed into 50 μl of RPMI 1640 in test tubes. Each spheroid was counted for total radioactivity. In the killing assay, the spheroids were incubated with S2 (50 μg/ml) and/or YTH53.1B (25 μg/ml) and NHS (1/2) in a total volume of 200 μl. In the controls, either antibodies and NHS were omitted (spontaneous 51Cr release) or S0 and normal rat IgG were used instead of S2 and YTH53.1B, respectively. In the standard assay, the spheroids were incubated with the lysis medium for a total of 24 hours at 37°C. During the incubation, at 2, 4, and 8 hours, the spheroids were isolated gently by pipetting and placed into new tubes containing fresh NHS and antibodies to replace the C components and IgG consumed. In a prolonged assay, the incubation was extended to 50 hours, and fresh NHS and antibodies were added either at 2, 4, 8, 16, and 24 hours or at 4-hour intervals. The 51Cr released into the medium was counted in a gamma counter. Finally, after incubation, each spheroid was isolated and counted for the remaining radioactivity. The cell lysis was determined as a cumulative release of 51Cr into the cell culture medium from each spheroid and calculated as a percentage of the total initial radioactivity: ((Released radioactivity − spontaneous release)/(Total radioactivity − spontaneous release)) × 100%. The Student’s two-tailed t-test was used to test the significance of differences between mean values.
Scanning Electron Microscopy
Scanning electron microscopy was used for the visualization of the effects of complement exposure to the microtumors. Variously treated spheroids were fixed with 2.5% glutaraldehyde in phosphate-buffered saline (PBS) for 2 hours and washed thereafter with PBS for 30 minutes. The samples were dehydrated in an ascending series of graded ethanol, dried in a Balzers CPD 030 critical point dryer (Balzers, Liechtenstein) and coated with a 20-nm layer of platinum in an Agar Sputter Coater (Agar Scientific Ltd., Stanstedt, UK). Finally, the spheroids were examined with a Zeiss DSM 962 scanning electron microscope (Oberkochen, Germany) using a secondary electron image at 20 kV.
Evaluation of C Damage and Penetration of C Components into Spheroids by Immunofluorescence Microscopy
Cell damage resulting from the exposure of the MTS to C was visualized by the uptake of propidium iodide (PI; Sigma) into cells with membrane lesions. MTSs were harvested after 10 to 14 days of culture and washed by gravitation in a test tube three times through 10 ml of RPMI 1640. Individual T47D spheroids were incubated with the nonbiotinylated YTH53.1 mAb (25 μg/ml) and/or S2 (50 μg/ml) and NHS (1:2) in a total volume of 200 μl in the wells of 96-well microtiter plates at 37°C. In the controls, S0 and purified rat IgG were used instead of S2 and YTH53.1. The spheroids were photographed before and after a 24-hour incubation with NHS and antibodies to determine the change in their volume after complement damage. At 2, 4, and 8 hours, some of the spheroids were isolated, and fresh NHS and antibodies were added to the remaining spheroids. One hour before each sample removal, 50 μg/ml of PI was added into the incubation medium to detect changes in cell membrane permeability. Washed spheroids were embedded in Tissue-Tek OCT (Miles Inc., Elkhart, IN), frozen and sectioned (5 to 10 μm) in a cryostat. The PI-stained sections were examined using an Olympus BX50-FLA reflected light fluorescence attachment microscope (Olympus Optical Co., Ltd., Tokyo, Japan).
For the analysis of C component penetration by immunofluorescence microscopy, the sections of variously treated spheroids were fixed with 4% paraformaldehyde and treated with 1% bovine serum albumin (fraction V, Sigma) in PBS to prevent nonspecific binding. Thereafter, the sections were incubated with appropriate dilutions of antibodies to human C components in a humidified chamber. Bound antibodies were detected with FITC-conjugated secondary antibodies against rabbit, mouse, goat, or rat IgG. Background immunofluorescence was assessed by omitting the primary antibodies. The possible expression Fc receptors (FcγRI, FcγRII, and FcγRIII) on T47D cells was performed similarly by using immunofluorescence microscopy, and the respective mAbs. After the staining procedure, the sections were mounted in Mowiol 29 and examined using the Olympus fluorescence microscope.
Results
Growth of Spheroids
T47D and PA-1 cell spheroids were grown for up to 14 days using the liquid overlay technique. Single cells plated on the agarose-coated 96-well plates began to adhere to each other, forming irregular aggregates (one aggregate per well) during an overnight incubation. After 7 days of incubation, both T47D and PA-1 MTS were uniformly spherical and regular in shape. Spheroids grown for more than 14 days began to develop necrotic centers as determined by PI staining. T47D spheroids had a tendency to develop necrotic centers earlier than PA-1 spheroids. The tendency for cell-to-cell adhesion in the T47D spheroids was strong. The cells required a 1-hour trypsinization and mechanical disintegration by pipetting to become separated. Ten-day-old spheroids selected for the experiments had a mean diameter of 0.719 ± 0.02 mm and a calculated volume of 0.194 ± 0.063 mm 3 (mean ± SD; n = 40) as determined from the scanned images. The number of cells counted from the trypsinized spheroids was 2.1 × 10 5 ± 2200 cells/spheroid (mean ± SD).
51Chromium Release from Microtumors Exposed to Antibodies and C
To quantify C-mediated death of cells in the spheroids a chromium (51Cr) release assay was used. Individual T47D spheroids were incubated with 3 μCi of 51Cr for 12 hours in 100 μl of cell culture medium. Earlier studies by autoradiography have demonstrated that an overnight incubation leads to penetration of 51Cr throughout the spheroids. 24 After washes, the emission of radioactivity was 11,181 ± 376 cpm/spheroid (mean ± SD; n = 20). The mean cumulative spontaneous release of chromium during a 24-hour incubation of spheroids in the RPMI 1640 containing 10% heat-inactivated fetal calf serum was 13% ± 0.6% of the total radioactivity (n = 4). This is in correlation with the total remaining activity (90 ± 1.2%) that was counted from each spheroid after the 24-hour incubation. The spontaneous release of chromium was considered as background and was subsequently subtracted from the further results.
To study C-mediated killing of T47D spheroids, the S2 antibody was used for activation of the classical pathway of C and the biotinylated YTH53.1 mAb (YTH53.1B) for neutralization of the membrane attack complex inhibitor CD59 on the cells. YTH53.1 is a rat mAb (IgG2b) that is capable of activating human C. However, biotinylation of YTH53.1 prevents it from activating the classical pathway of complement while retaining its original affinity for CD59. 26 A 24-hour incubation with antibodies and a single dose of NHS resulted in the release of 16 ± 4% (Figure 1A) ▶ of the spheroid-bound radioactivity. In another set of experiments, to see the effect of C replenishment to the spheroid lysis and to study the kinetics of C lysis, NHS and the antibodies were replaced at 2, 4, and 8 hours, and cumulative 51Cr release was measured during the assay at the same time points. In the killing assay, there was a clear lag phase in the 51Cr release during the first 2 hours of incubation (Figure 1B) ▶ . T47D spheroids exposed to S2, YTH53.1B, and NHS for 2 hours showed only 1% lysis. At 4 hours, 5% lysis was achieved. A more significant lysis was not detected until 8 hours of incubation (15 ± 0.5%; n = 4). The mean (±SD) cumulative release of chromium from the spheroids exposed to S2, YTH53.1B, and NHS during 24 hours of incubation was 33% ± 2.3% (Figure 1B) ▶ , whereas 62 ± 0.45% of 51Cr was counted to remain in the spheroids. In the control spheroids incubated with S0, normal rat IgG, and NHS for 24 hours (with replacements), the mean cumulative activity released was only 3 ± 0.96% (n = 4) more than the spontaneous release during the same time. In the spheroids exposed to either S2 or YTH53.1B and NHS, the mean cumulative 51Cr releases were 4 ± 1.5% and 5 ± 0.6%, respectively (n = 8).
Figure 1.

C-mediated lysis of T47D breast adenocarcinoma spheroids. A: The effect of pulsed versus single C treatment on microtumor lysis by antibodies and C. In one set of experiments, 51Cr-labeled spheroids were exposed to biotinylated anti-CD59 antibody (YTH53.1B; 25 μg/ml), polyclonal rabbit IgG against the tumor cells (S2; 50 μg/ml), and NHS (diluted 1:2) at the beginning of the experiment (□), and the released radioactivity was counted from the supernatants after 24 hours of incubation at 37°C. In another set of experiments, the consumed C was replaced by fresh NHS at 2, 4, and 8 hours during the 24-hour incubation. The pulsed addition (▪) of C increased the lysis of spheroids from 16 ± 4 to 33 ± 2.3% (mean ± standard deviation (SD)). In the controls, normal rat IgG (25 μg/ml) and preimmune rabbit IgG (S0; 50 μg/ml) were used instead of YTH53.1B and S2, or YTH53.1B and S2 were used separately. B: Time course of spheroid lysis. 51Cr-labeled T47D spheroids were exposed to S2 and YTH53.1 (•), S0 and Rat IgG (○), S2 (▵), YTH53.1 (▴), and NHS as above for the times indicated. During the incubation the microtumors were isolated and placed into new tubes containing fresh serum and the respective antibodies at 2, 4, and 8 hours. In C and D, the lysis of the spheroids was examined for 48 and 50 hours, and fresh Complement was added during the incubation 7 or 11 times, respectively. The radioactivity released was counted from the supernatants. A to D: Cell lysis was determined as the percentage of total radioactivity: ((Released cumulative radioactivity − spontaneous 51Cr release)/(Total radioactivity − spontaneous 51Cr release)) × 100%. The vertical bars indicate the SD of quadruplicate determinations. Two-tailed Student’s t-test; *P < 0.05; comparison between lysis values of spheroids exposed to a single dose and multiple doses of complement (A); ***, P < 0.001 lysis of spheroids exposed to S2, YTH53.1B (•) and NHS was significantly different from control spheroids (S0 + rat IgG; ○; B).
Spheroids exposed to 0.1% Nonidet P40 detergent released all 51Cr within 2 hours of incubation. With the PA-1 spheroids, 3% of lysis was observed at 1 hour, whereas at 2 hours, already 37% lysis was achieved (data not shown). Because of a tendency of PA-1 spheroids to spontaneously leak chromium during a prolonged treatment, lysis could not be followed for longer than 4 hours, at which time 45% lysis was observed. In another set of experiments, we increased the incubation time of the T47D spheroids to 48 hours. This only marginally increased the level of spheroid lysis (Figure 1C) ▶ . The increase in the number of C replacements to a total of 11 at 4-hour intervals during 50 hours of incubation did not significantly enhance the tumor cell lysis either (Figure 1D) ▶ . After 50 hours of C exposure, the C-treated spheroids were plated on cell culture plates. An overnight incubation resulted in the adherence and spreading of the T47D cells over the plate bottoms, indicating that the spheroids still contained viable cells.
Effect of C Treatment on the Volume of T47D Spheroids
To determine the effect of C treatment on the microtumor volume, individual T47D spheroids were incubated on the 96-well culture plates with S2, YTH53.1B, and NHS with replacements at 2, 4, and 8 hours. After a 24-hour incubation, the surfaces of the spheroids were clearly less coherent and cells more swollen than before the incubation, as determined by light microscopy (Figure 2, A and B) ▶ . As judged from photographic images, the volume of the spheroids decreased by 28% from 0.194 ± 0.063 to 0.140 ± 0.05 mm 3 (mean ± SD; n = 30) during the 24-hour pulsed treatment with antibodies and C. The volume of the control spheroids exposed to S0, normal rat IgG, and NHS decreased by only 5% during the 24-hour incubation (residual volume, 0.185 ± 0.013 mm3). Scanning electron microscopic analysis after the C exposure showed a release of relatively large vesicles from the cell surfaces and porous remnants of cell membranes after severe cell damage (Figure 2, D and F) ▶ . No similar changes were detected in the control spheroids incubated with NHS, S0, and normal rat IgG (Figure 2, C and E) ▶ . In these controls, the surface of the microtumors remained smooth with a fine microvillar coating.
Figure 2.
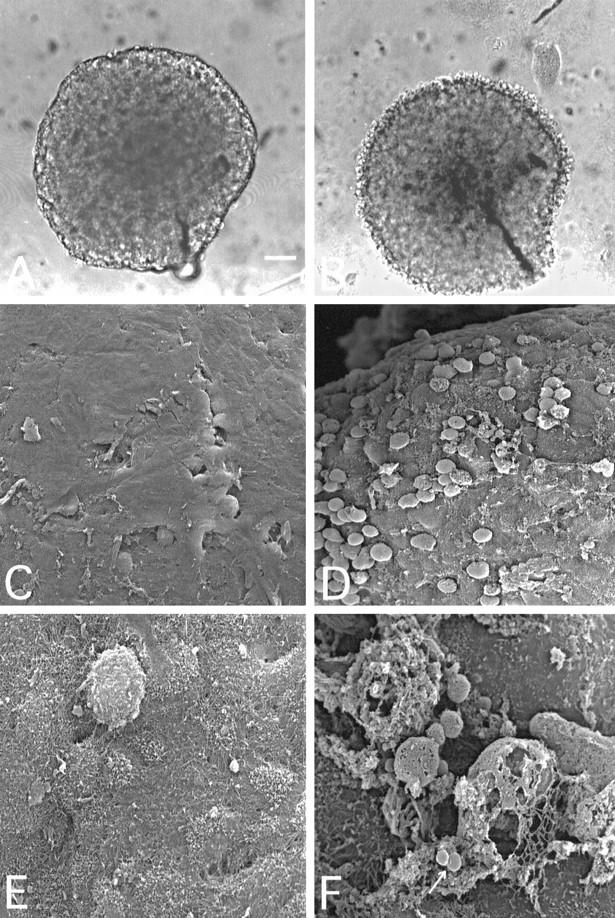
Light (A and B) and scanning electron (C to F) microscopic images of intact (A, C, and E) and C-attacked (B, D, and F) T47D breast adenocarcinoma cell spheroids. Spheroids were selected for the experiments after 10 to 14 days of culture and exposed to YTH53.1B and S2 and NHS at 37°C for 24 hours (B, D, and F) as in Figure 1B ▶ . The spheroid shown in A was photographed before the NHS exposure. In C and E, the spheroids were exposed to NHS, S0, and normal rat IgG for 24 hours. The surface of a spheroid exposed to C-activating (S2) and CD59-neutralizing (YTH53.1B) antibodies and NHS (B) was less coherent than that of the control (A). Surface cells became swollen and detached. Scanning electron microscopy also showed damaged, swollen, and detaching cells on the spheroid surface (D). At higher magnification, remnants of cells with destroyed, porous membranes could be seen with released vesicles (F, arrow). Bar, 100 μm (A). Magnification, ×500 (C and D) and ×3000 in E and F.
Effect of C Treatment on the Viability of PA-1 and T47D Cells Growing in Spheroids
To visualize death of individual cells in the spheroids, some of the spheroids treated for various times with S2, YTH53.1B, and NHS were incubated for 1 hour with PI before freezing into liquid nitrogen. Fluorescence microscopical analysis of cryostat sections of the PA-1 spheroids showed a two to three-cell layer-thick frontier of dying cells on the microtumor surfaces after 2 hours of C exposure (Figure 3A) ▶ . Apparently, some of the cells had become detached from the spheroid surface. In the control microtumors incubated with S0, nonspecific rat IgG, and NHS, no dead cells were observed on the microtumor surfaces (Figure 3B) ▶ . By comparison, in the T47D microtumors the rim of dead cells did not extend deeper than one or two cell layers from the surface after 2 hours of incubation (see Figure 5E ▶ ). Furthermore, the cells still remained firmly attached to the microtumor tissue. After 8 hours of exposure to C, the damaged T47D cells on the surface remained adherent to the spheroidal body. After 24 hours of incubation, the PI staining revealed a large pool of damaged cells detaching from the surfaces of the spheroids (see Figure 5F ▶ ). The necrotic cells in the centers of the largest spheroids also became stained by PI. In the control spheroids that were exposed to S0, normal rat IgG, and NHS, only the necrotic cells in the center became stained, but no killing of cells on the surface was detected (see Figure 5I ▶ ). This indicated that PI was able to penetrate into the center of the spheroids through the intercellular spaces.
Figure 3.
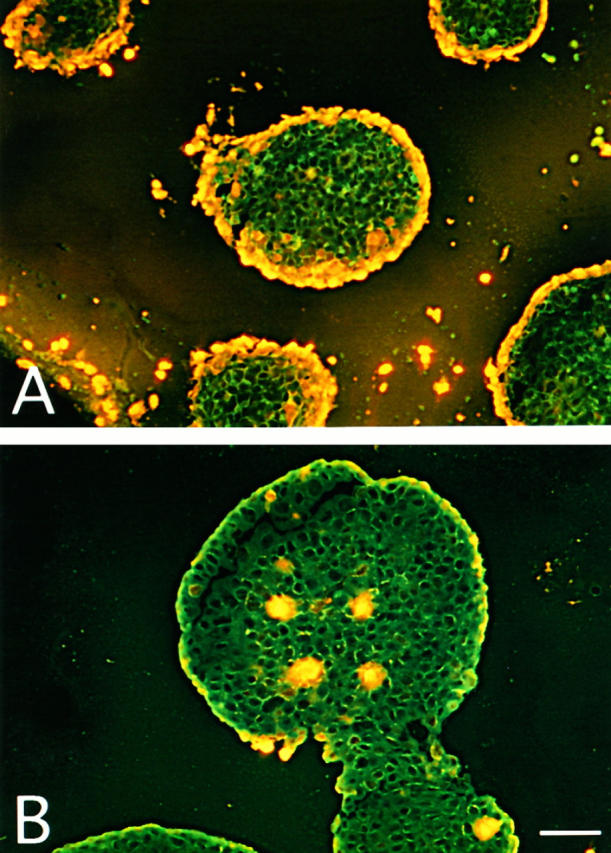
Visualization of C-mediated killing of PA-1 spheroids by the incorporation of PI into cellular DNA. A: PA-1 spheroids grown for 10 days were incubated with YTH53.1B (25 μg/ml) and S2 (50 μg/ml) antibodies and human serum for 4 hours at 37°C and with PI (50 μg/ml) for 1 hour. In the control (B), normal rat IgG (25 μg/ml) and S0 (50 μg/ml) were used instead of YTH53.1 and S2. After incubation, the spheroids were frozen in liquid nitrogen. Examination of cryostat sections (10 μm) by fluorescence microscopy shows PI staining of the nuclei of killed cells. In A, rims of dead cells can be seen on the surfaces of the spheroids. In the control (B), occasional necrotic cells in the center of a spheroid are stained. Bar, 200 μm (A).
Figure 5.
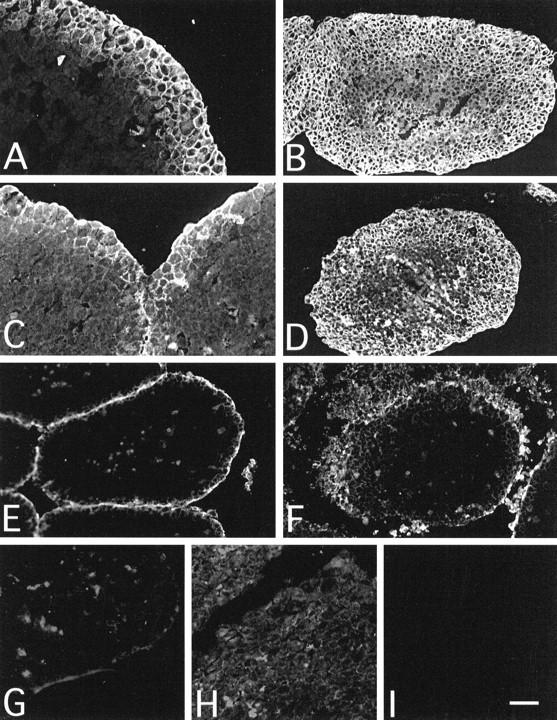
Comparison between C (C3c and C5b-9) penetration and cell death as assessed by PI staining of T47D spheroids. Spheroids treated with S2, YTH53.1B, and human serum for 2 (A, C, and E) or 24 hours (B, D, and F) at 37°C as in Figure 4 ▶ . In the controls (G, H, and I), S0 and normal rat IgG were used instead of S2 and YTH53.1B. PI was added to the mixture 1 hour before termination of the incubation. Cryostat sections (10 μm) of the spheroids were fixed with 4% paraformaldehyde and incubated with antibodies to human C3c (A, B, and G) and the C5b-9 neoepitope (Wu; C, D, and H). Bound antibodies were detected with FITC-conjugated secondary antibodies. Deposition of C3c and C5b-9 after 2 hours of exposure to C can be seen as green fluorescence on the surface of the spheroid sections (A and C, respectively). Cell death after a 2-hour C exposure appears as yellow fluorescence in E. Some necrotic cells in the microtumor cores were also stained with PI. The deposition of C3c and C5b-9 remained peripheral after the 24-hour C exposure (B and D, respectively), and a large pool of dead and detaching cells was observed around the microtumors (F). No deposition of C3c (G) or C5b-9 (H) was detected in the control spheroids. In the control spheroids, only the necrotic cells in the cores of the microtumors were stained with PI (I). Bar, 100 μm.
Penetration of anti-CD59 mAb, Polyclonal IgG, and C1q into Microtumors
During a 2-hour incubation, the YTH53.1 mAb penetrated into the spheroid tissue as a frontier and infiltrated four to five cell layers deep (Figure 4A) ▶ . After an overnight exposure to YTH53.1 and NHS, the T47D spheroids became totally infiltrated by the YTH53.1 IgG (Figure 4B) ▶ . Somewhat surprisingly, although C1q has a relatively large size (molecular weight 460 kd), it was able to penetrate two to three cell layers deep during a 2-hour exposure to YTH53.1 and NHS (Figure 4C) ▶ and almost through the spheroids over 24 hours (Figure 4D) ▶ . The penetration of S2 was slower compared with the infiltration of the YTH53.1 mAb. In 2 hours, the S2 IgG was able to penetrate only through the first two cell layers (Figure 4E) ▶ . After 24 hours, the S2 IgG penetrated deeper, forming a gradient toward but not up to the core of the spheroids (Figure 4F) ▶ . In the controls incubated with rat IgG, rabbit preimmune IgG (S0), and NHS, no deposition of nonspecific rat IgG (Figure 4G) ▶ , C1q (Figure 4H) ▶ or rabbit IgG (Figure 4I) ▶ could be detected. To exclude the possibility that antibodies bound to Fc receptors, we used 10.1, C1KM5, and 3G8 mAbs for staining of FcγRI, FcγRII, and FcγRIII on T47D cells, respectively. No binding of any of these mAbs to the T47D cells was detected.
Figure 4.
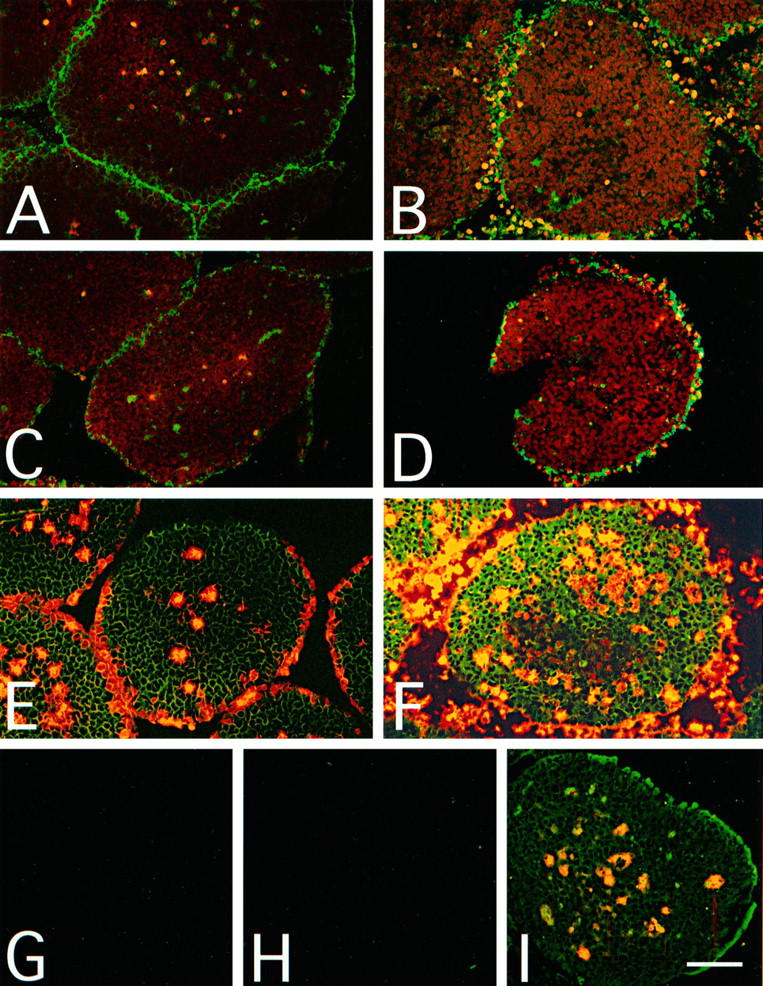
Immunofluorescence microscopy analysis of antibody and C1q penetration into T47D spheroids. Multicellular spheroids grown for 10 days were exposed to S2 (50 μg/ml), YTH53.1 (anti-CD59; 25 μg/ml), and human serum (diluted 1:2) for 2 hours (A, C, and E) or 24 hours (B, D, and F; pulsed doses) at 37°C. In the controls (G, H, and I), S0 and normal rat IgG were used instead of S2 and YTH53.1 during a 24-hour incubation. Cryostat sections (5 μm) were fixed with 4% paraformaldehyde and incubated with antibodies against rat IgG (A, B, and G), human C1q (C, D, and H), and rabbit IgG (E, F, and I). Within 2 hours, YTH53.1 (A) and C1q (C) had penetrated four to five or two to three cell layers deep, respectively, into the spheroids. S2 IgG remained on the outermost surface (E). After a 24-hour exposure the YTH53.1 mAb (B) and C1q (D) had penetrated through the spheroids, whereas the polyclonal S2 IgG (F) did not penetrate completely to the core. In controls, no staining for rat IgG (G), C1q (H), or rabbit IgG (I) was detected. Bar, 100 μm (B, D, and E to I) and 200 μm (A and C).
Restriction of C3 and C5b-9 Deposition to the Outer Surface of Spheroids
Immunofluorescence analysis showed that C3 (stained with the anti-iC3b antibody) and C5b-9 deposits remained peripheral in the spheroids and were restricted to the outermost one to two cell layers after 2 hours (Figure 5, A and C) ▶ and two to four cell layers after 24 hours (Figure 5, B and D) ▶ of C exposure. PI staining was in accordance with the staining for C3 and C5b-9, revealing that the C-mediated killing of the cells was limited to the microtumor surface (Figure 5, E and F) ▶ . In the controls, in which S0, nonspecific rat IgG, and NHS were used, no deposition of C3 (Figure 5G) ▶ or C5b-9 (Figure 5H) ▶ was detected after 24 hours of incubation. Accordingly, no C-mediated cell death was seen on the surfaces of similarly treated microtumors (Figure 5I) ▶ .
Discussion
Experiments in this work have allowed the analysis and visualization of C-mediated attack against three-dimensional tumor tissue. Malignant cells growing in aggregates resembling small tumors and micrometastases were attacked by targeting antibodies and C in the presence of a C lysis inhibitor (CD59) neutralizing antibody. A pulsed C attack resulted in progressive cell membrane damage and cell detachment on the outer layers of the MTSs. Full lysis of cores of the spheroids appeared to be restricted by an arrest of C activation at the C3 level.
So far, little is known about the ability of C components to penetrate into solid tumor tissue. Earlier, we observed that in traditional killing assays, cells growing in aggregates were notably more resistant to C-mediated cytotoxicity than cells in suspension. 25 In the present study, we wanted to find out reasons for this resistance and develop potential ways to overcome it. After neutralizing protectin (CD59), the main inhibitor of C lysis, with a specific mAb, and initiating C activation with a polyclonal antibody, lysis of cells in the spheroids started to occur after a 1 to 2-hour lag period. By prolonging the time of exposure and replacing the C components consumed, we were able to partially overcome the C resistance of the ductal breast carcinoma (T47D) and ovarian teratocarcinoma (PA-1) spheroids. During a 24-hour exposure to C, the release of 51Cr was 33% from the T47D spheroids. Prolonging the incubation time did not further significantly increase the level of lysis, and a plateau phase was reached after 42 hours (Figure 1, C and D) ▶ . However, because the spontaneous release of 51Cr was 30% at 48 hours, the assay may not have revealed the full extent of cell damage during prolonged incubations.
The main reasons for the observed lag-phase are probably a limited initial penetration of antibodies and C components through the MTS surface and consumption of active C on the outer layers of the spheroids. It is likely that the delivery of C components and mAb into the spheroids occurs by diffusion through the intercellular spaces. In an earlier study, mAbs were found to be capable of penetrating into the MTS. 20 This was the case with the YTH53.1 mAb that infiltrated through the spheroids during an overnight incubation. However, BRIC 229, another mAb against CD59, did not completely pass through the spheroids during the same time (data not shown). Because of stronger binding to target antigens, antibodies of higher affinity are predicted to diffuse more slowly into the tumor.
C treatment did not completely disrupt the macroscopic structure of the MTS. The cores of the spheroids retained their integrity during incubation with antibodies and C for 24 hours. It was thus possible to efficiently kill cells growing on the surface of the spheroids, but cells deeper inside were protected from C lysis. The plating of the spheroids after 50 hours resulted in the adherence and spreading of the cells over the cell culture plate surface, indicating that the spheroids still contained viable cells. Our results indicate that the resistance of cancer cells growing in the cores of the spheroids to C-mediated injury results at least partly from the restricted spreading of C3 activation into the spheroids. The first component of the classical pathway of C, C1q, was able to penetrate almost through the spheroids within 24 hours despite its rather high molecular weight (462 kd). The binding of C1q to the Fc part of an antibody is noncovalent. 30 During C activation, the forming C3b binds covalently with a thioester bond to a nearby cell surface. Although C1q can diffuse relatively freely through the spheroid, the penetration of C3 is limited, first, by rapid activation and covalent binding and, thereafter, by rapid inactivation of C3b. Restricted penetration of C3 is thus not due to a limited diffusion but because of its specific biochemical properties.
A reason that can restrict C activation to the spheroid surface in our model is an effective C regulation at the C3 level. In these studies, we did not attempt to neutralize MCP or decay-accelerating factor, which both down-regulate C3 activation on cell surfaces. Because of its stronger expression on the spheroids, 25 MCP is likely to promote inactivation of both C4b and C3b that have become bound to the tumor cell surfaces. Thus, MCP could effectively block both the classical and the alternative pathway C3 convertase function. Further optimization of C killing in our model should thus include inactivation of the activity of MCP.
After C exposure, the surfaces of the spheroids became clearly less coherent, showing swollen and detaching cells as judged by light microscopy. Scanning electron microscopy revealed damaged cells with remnants of cell membranes on the microtumor surfaces. The nuclei of escaping cells were visible in the PI-stained specimens. New cell layers became exposed to C after the dead cell layer had been peeled off during the process. The cell death thus proceeded as a frontier but was restricted mainly to the first four layers of cells on the periphery of the spheroids after a 24-hour exposure. This was consistent with findings of the penetration of C3 and C5b-9, which also remained limited to the surface of the MTS. After a 2 to 8-hour-long exposure of MTS to C, the PI-stained, apparently dead T47D cells were still firmly attached to the spheroids. After 24 hours of exposure, a necrotic rim of cells and many detaching cells were observed in the PI-stained sections.
The detachment of cells from the spheroid surface may be due to down-regulation of adhesion receptors and/or proteases released from the dying or sublytically attacked tumor cells. The proteolytic enzymes may start to degrade the extracellular matrix and proteins required for the cellular adhesion. Activation of metalloproteinases and degradation of extracellular matrix occur during various physiological and pathological processes. These include conditions that require tissue remodeling such as tissue morphogenesis, inflammation, and wound healing. On the other hand, eg, the C serine esterase C1s has been shown to degrade type I and type II collagens 31 and to activate the zymogen form of the matrix metalloproteinase 9 enzyme. 32 The released proteases might also activate or inactivate C components and thereby have an enhancing or inhibitory effect on C killing of the microtumor cells. Leukocyte matrix metalloproteinases have been shown to inactivate C1 inhibitor that inactivates the C1r and C1s proteinases. 33,34 On the other hand, the metalloproteinases could decrease complement resistance of the spheroids by degrading inhibitors of C on the cell membranes.
C3 deposition on tumor cells may have multiple consequences on the immune responses against the tumors. The cleavage fragments of C proteins (C3a, C4a and C5a) generated during the activation are released into the fluid phase. These small bioactive peptides act as chemotaxins, leukocyte activators, and anaphylatoxins. 35 The larger fragments of C proteins (C3b and C4b) bind covalently to the activating targets, opsonizing them for phagocytosis. The phagocytic cells have cell membrane receptors that interact with C3b and C4b to allow clearance of the activating particles. 36 C3 deposition may also increase the antigenicity of the potential tumor antigens on the tumor cells. Dempsey et al 37 have shown in their study that tethering C3d into hen egg lysozyme lowered the threshold level of the B-cell response to lysozyme, thereby increasing its immunogenecity. 37 Thus, C3d can act as a molecular adjuvant and may be able to increase tumor antigen immunogenicity as well.
Micrometastases and residual malignant cells after surgery constitute an important clinical problem in cancer therapy. The approach of using C against tumors in vivo is currently limited by the lack of tumor cell-specific and C-activating antibodies. Many of the mAbs that are produced in murine hybridoma cell lines belong to the IgG1 subclass that in general is a poor activator of human complement. Another problem is the activity of C regulators on the malignant cells. However, as implied by our earlier studies, it is possible to specifically target C attack against tumors if suitable mAbs are available. 14 As shown here, mAbs and even large C molecules, such as C1q, can penetrate into the tumor tissue. Destruction of microtumors could thus be achieved by neutralizing the C inhibitors and optimizing the antibody-initiated C attack. For further studies, the spheroid system offers a useful model.
Footnotes
Address reprint requests to Dr. Seppo Meri, Haartman Institute, Department of Bacteriology and Immunology, PO Box 21 (Haartmaninkatu 3), FIN-00014 University of Helsinki, Finland. E-mail: meri@helsinki.fi.
This work was supported by the Academy of Finland, the Sigrid Jusélius Foundation and a state subsidy to Helsinki University Central Hospital.
References
- 1.Hertler AA, Frankel AE: Immunotoxins: a clinical review of their use in the treatment of malignancies. J Clin Oncol 1989, 7:1932-1942 [DOI] [PubMed] [Google Scholar]
- 2.Houghton AN: Cancer antigens: immune recognition of self and altered self. J Exp Med 1994, 180:1-4 [DOI] [PMC free article] [PubMed] [Google Scholar]
- 3.Vijayasaradhi S, Bouchard B, Houghton AN: The melanoma antigen gp75 is the human homologue of the mouse b (brown) locus gene product. J Exp Med 1990, 171:1375-1380 [DOI] [PMC free article] [PubMed] [Google Scholar]
- 4.Nicholson-Weller A, Burge J, Fearon DT, Weller PF, Austen KF: Isolation of a human erythrocyte membrane glycoprotein with decay-accelerating activity for C3 convertases of the complement system. J Immunol 1982, 129:184-189 [PubMed] [Google Scholar]
- 5.Seya T, Turner JR, Atkinson JP: Purification and characterization of a membrane protein (gp45–70) that is a cofactor for cleavage of C3b and C4b. J Exp Med 1986, 163:837-855 [DOI] [PMC free article] [PubMed] [Google Scholar]
- 6.Sugita Y, Nakano Y, Tomita M: Isolation from human erythrocytes of a new membrane protein which inhibits the formation of complement transmembrane channels. J Biochem (Tokyo) 1988, 104:633-637 [DOI] [PubMed] [Google Scholar]
- 7.Davies A, Simmons DL, Hale G, Harrison RA, Tighe H, Lachmann PJ, Waldmann H: CD59, an LY-6-like protein expressed in human lymphoid cells, regulates the action of the complement membrane attack complex on homologous cells. J Exp Med 1989, 170:637-654 [DOI] [PMC free article] [PubMed] [Google Scholar]
- 8.Meri S, Morgan BP, Davies A, Daniels RH, Olavesen MG, Waldmann H, Lachmann PJ: Human protectin (CD59), an 18,000–20,000 MW complement lysis restricting factor, inhibits C5b-8 catalysed insertion of C9 into lipid bilayers. Immunology 1990, 71:1-9 [PMC free article] [PubMed] [Google Scholar]
- 9.Rollins SA, Zhao J, Ninomiya H, Sims PJ: Inhibition of homologous complement by CD59 is mediated by a species-selective recognition conferred through binding to C8 within C5b-8 or C9 within C5b-9. J Immunol 1991, 146:2345-2351 [PubMed] [Google Scholar]
- 10.Meri S, Waldmann H, Lachmann PJ: Distribution of protectin (CD59), a complement membrane attack inhibitor, in normal human tissues. Lab Invest 1991, 65:532-537 [PubMed] [Google Scholar]
- 11.Kuraya M, Yefenol E, Klein G, Klein E: Expression of the complement regulatory proteins CD21, CD55 and CD59 on Burkitt lymphoma lines: their role in sensitivity to human serum-mediated lysis. Eur J Immunol 1992, 22:1871-1876 [DOI] [PubMed] [Google Scholar]
- 12.Kumar S, Vinci JM, Pytel BA, Baglioni C: Expression of messenger RNAs for complement inhibitors in human tissues and tumors. Cancer Res 1993, 53:348-353 [PubMed] [Google Scholar]
- 13.Hakulinen J, Meri S: Expression and function of the complement membrane attack complex inhibitor protectin (CD59) on human breast cancer cells. Lab Invest 1994, 71:820-827 [PubMed] [Google Scholar]
- 14.Junnikkala S, Hakulinen J, Meri S: Targeted neutralization of the complement membrane attack complex inhibitor CD59 on the surface of human melanoma cells. Eur J Immunol 1994, 24:611-615 [DOI] [PubMed] [Google Scholar]
- 15.Bjørge L, Vedeler CA, Ulvestad E, Matre R: Expression and function of CD59 on colonic adenocarcinoma cells. Eur J Immunol 1994, 24:1597-1603 [DOI] [PubMed] [Google Scholar]
- 16.Bjørge L, Hakulinen J, Wahlström T, Matre R, Meri S: Complement regulatory proteins in ovarian malignancies. Int J Cancer 1997, 70:14-25 [DOI] [PubMed] [Google Scholar]
- 17.Mäenpää A, Junnikkala S, Hakulinen J, Timonen T, Meri S: Expression of complement membrane regulators membrane cofactor protein (CD46), decay accelerating factor (CD55), and protectin (CD59) in human malignant gliomas. Am J Pathol 1996, 148:1139-1151 [PMC free article] [PubMed] [Google Scholar]
- 18.Carlsson J, Yuhas JM: Liquid-overlay culture of cellular spheroids. Acker H Carlson J Durand R Sutherland RM eds. Recent Results in Cancer Research. 1984, :pp 1-23 Springer-Verlag, Berlin [DOI] [PubMed] [Google Scholar]
- 19.Sutherland RM: Cell and environment interactions in tumor microregions: the multicell spheroid model. Science 1988, 240:177-184 [DOI] [PubMed] [Google Scholar]
- 20.Chen F-M, Hansen EB, Taylor CR, Epstein AL: Diffusion and binding of monoclonal antibody TNT-1 in multicellular tumor spheroids. J Natl Cancer Inst 1991, 83:200-204 [DOI] [PubMed] [Google Scholar]
- 21.Sutherland RM, Buchegger F, Schreyer M, Vacca A, Mach J-P: Penetration and binding of radiolabeled anti-carcinoembryogenic antigen monoclonal antibodies and their antigen-binding fragments in human colon multicellular tumor spheroids. Cancer Res 1987, 47:1627-1633 [PubMed] [Google Scholar]
- 22.Kwok CS, Cole SE, Liao SK: Uptake kinetics of monoclonal antibodies by human malignant melanoma multicell spheroids. Cancer Res 1988, 48:1856-1863 [PubMed] [Google Scholar]
- 23.Epstein AL, Chen FM, Taylor CR: A novel method for the detection of necrotic lesions in human cancers. Cancer Res 1988, 48:5842-5848 [PubMed] [Google Scholar]
- 24.Jääskeläinen J, Kalliomäki P, Paetau A, Timonen T: Effect of LAK cells against three-dimensional tumor tissue. J Immunol 1989, 142:1036-1045 [PubMed] [Google Scholar]
- 25.Bjørge L, Junnikkala S, Kristofferson EK, Hakulinen J, Matre R, Meri S: Resistance of ovarian teratocarcinoma cell spheroids to complement-mediated lysis. Br J Cancer 1997, 75:1247-1255 [DOI] [PMC free article] [PubMed] [Google Scholar]
- 26.Jokiranta TS, Meri S: Biotinylation of monoclonal antibodies prevents their ability to activate the classical pathway of complement. J Immunol 1993, 151:2124-2131 [PubMed] [Google Scholar]
- 27.Sher E, Eisman JA, Moselay JM, Martin TJ: Whole cell uptake and nuclear localization of 1,25-dihydroxycholecalciferol by breast cancer cells (T47D) in culture. Biochem J 1981, 200:315-320 [DOI] [PMC free article] [PubMed] [Google Scholar]
- 28.Zeuthen J, Norgaard JOR, Avner P, Fellous M, Wartiovaara J, Vaheri A, Rosen A, Giovanella BC: Characterization of human ovarian teratocarcinoma-derived cell line. Int J Cancer 1980, 25:19-32 [DOI] [PubMed] [Google Scholar]
- 29.Harlow E, Lane D: Antibodies: A Laboratory Manual. 1988:pp 418 Cold Spring Harbor Laboratory, New York
- 30.Duncan AR, Winter G: The binding site for C1q on IgG. Nature 1988, 332:738-740 [DOI] [PubMed] [Google Scholar]
- 31.Yamaguchi K, Sakiyama H, Matsumoto M, Moria H, Sakiyama S: Degradation of type I and II collagen by human C1s. FEBS Lett 1990, 268:206-208 [DOI] [PubMed] [Google Scholar]
- 32.Sakiyama H, Inaba N, Toyoguchi T, Okada Y, Matsumoto M, Moriya H, Ohtsu H: Immunolocalization of complement C1s and matrix metalloproteinase 9 (92 kDa gelatinase/type IV collagenase) in the primary ossification center of human femur. Cell Tissue Res 1994, 227:239-245 [PubMed] [Google Scholar]
- 33.Pemberton PA, Harrison RA, Lachmann PJ, Carrell RW: The structural basis for neutrophil inactivation of C1 inhibitor. Biochem J 1989, 258:193-198 [DOI] [PMC free article] [PubMed] [Google Scholar]
- 34.Knäuper V, Triebel S, Reinke H, Tschescke H: Inactivation of human plasma C1-inhibitor by human PMN leucocyte matrix metalloproteinases. FEBS Lett 1991, 290:99-102 [DOI] [PubMed] [Google Scholar]
- 35.Hugli TE: Structure and functions of anaphylotoxins. Springer Semin Immunopathol 1984, 7:193-219 [DOI] [PubMed] [Google Scholar]
- 36.Ross GD, Medof ME: Membrane complement receptors specific for bound fragments of C3. Adv Immunol 1985, 37:217-267 [DOI] [PubMed] [Google Scholar]
- 37.Dempsey PW, Allison MED, Akkaraju S, Goodnow CC, Fearon DT: C3d of complement as a molecular adjuvant: bridging innate and acquired immunity. Science 1996, 271:348-350 [DOI] [PubMed] [Google Scholar]