

Abstract
cAMP-response element binding (CREB) proteins are involved in transcriptional regulation in a number of cellular processes (e.g., neural plasticity and circadian rhythms). The CREB family contains activators and repressors that may interact through positive and negative feedback loops. These loops can be generated by auto- and cross-regulation of expression of CREB proteins, via CRE elements in or near their genes. Experiments suggest that such feedback loops may operate in several systems (e.g., Aplysia and rat). To understand the functional implications of such feedback loops, which are interlocked via cross-regulation of transcription, a minimal model with a positive and negative loop was developed and investigated using bifurcation analysis. Bifurcation analysis revealed diverse nonlinear dynamics (e.g., bistability and oscillations). The stability of steady states or oscillations could be changed by time delays in the synthesis of the activator (CREB1) or the repressor (CREB2). Investigation of stochastic fluctuations due to small numbers of molecules of CREB1 and CREB2 revealed a bimodal distribution of CREB molecules in the bistability region. The robustness of the stable HIGH and LOW states of CREB expression to stochastic noise differs, and a critical number of molecules was required to sustain the HIGH state for days or longer. Increasing positive feedback or decreasing negative feedback also increased the lifetime of the HIGH state, and persistence of this state may correlate with long-term memory formation. A critical number of molecules was also required to sustain robust oscillations of CREB expression. If a steady state was near a deterministic Hopf bifurcation point, stochastic resonance could induce oscillations. This comparative analysis of deterministic and stochastic dynamics not only provides insights into the possible dynamics of CREB regulatory motifs, but also demonstrates a framework for understanding other regulatory processes with similar network architecture.
INTRODUCTION
The cyclic AMP (cAMP)-response element-binding protein (CREB) family of transcription factors is crucial for a variety of cellular processes (1), including induction of neuronal plasticity and formation of long-term memory (LTM), in both invertebrates and vertebrates (2–5), circadian rhythm (6–8), neuronal differentiation (9), addiction and depression (10), hormonal control of metabolic processes (11), and spermatogenesis (12). Thus, understanding the regulatory properties and dynamics of CREB is important for understanding many key biological functions.
The involvement and regulation of CREBs in the induction of LTM have been extensively studied (4,13). For example, in the mollusc Aplysia, two creb genes (creb1 and creb2) and their corresponding proteins have been characterized (14–16). CREB1 is a transcriptional activator necessary for induction of long-term synaptic facilitation, a mechanism for LTM. Upon exposure of sensory neurons to the neurotransmitter serotonin (5-HT), creb1 is activated (13,15) via activation of the protein kinase A (PKA) intracellular signaling pathways (4). CREB2 functions as a transcriptional repressor that poses inhibitory constraints on the induction and formation of LTM (16,17). Upon exposure to 5-HT, repression by CREB2 is relieved, possibly via phosphorylation of CREB2 by mitogen-activated protein kinase (MAPK) (16). CREB proteins regulate gene expression by binding to enhancer sequences termed cAMP-response elements (CREs). creb genes themselves may be regulated by CREs. For example, Mohamed et al. (14) recently characterized CREs in the promoter regions of Aplysia creb1 and creb2, and the mammalian CREB activator gene has CREs in its promoter region (18). The existence of these CREs suggests that a regulatory motif with interlocked positive and negative feedback loops may characterize transcriptional regulation by CREBs. In this motif, an activator such as CREB1 would further activate expression of its own gene via binding to CREs, forming a positive feedback loop. The activator would also activate expression of a repressor such as creb2. The repressor would, in turn, repress expression of the activator, closing a negative feedback loop. The repressor would also repress its own gene. In primary rat Sertoli cells (12), a transactivator form of CREB (similar to the activator CREB1) and a repressor isoform of CREB (similar to CREB2) are suggested to interact via such interlocked positive and negative loops, generating oscillations in gene expressions. This motif is illustrated in Fig. 1, where for definiteness, we term the activator CREB1 and the repressor CREB2.
FIGURE 1.

Schematic of the minimal model with interlocked positive and negative feedback loops of activator (CREB1) and repressor (CREB2).
The potential regulatory dynamics of CREB feedback have not been characterized. To explore these dynamics, we developed a minimal mathematical model to represent the feedback loops. Model dynamics can suggest experimentally testable hypotheses. For example, a prediction of the effect of increasing (or decreasing) the strength of positive (or negative) feedback might assist in designing protocols to regulate the induction and expression of CREB activators and repressors. Induction or activation of CREBs correlates with long-term memory formation not only in Aplysia, but also in mammals (19–22). Therefore, modulating CREB expression is likely to regulate the formation and persistence of LTM and other cellular processes mentioned above (1–12). In the minimal model, CREB1 and CREB2, respectively, denote activator and repressor CREB proteins.
Given that the actual regulatory dynamics of signaling pathways and gene network of CREBs have not yet been fully characterized, a minimal model representing the essential nonlinear network architecture of CREBs has several advantages. 1), The minimal model has relatively few parameters, which allows a systematic analysis of model dynamics and their robustness to parameter variation. 2), The minimal model is a core mathematical structure that can be extended to more detailed and biologically faithful models by incorporating other regulatory pathways once their kinetics are characterized. 3), Because the minimal model captures the essential nonlinearity embedded in the network structure, the dynamics may not change greatly upon the addition of other upstream and downstream regulatory pathways, and 4), Similar dynamics may characterize cellular processes based on similar regulatory motifs.
A number of minimal (or reduced) models have been developed to describe regulation of gene expression associated with the cell cycle, circadian rhythms, the tumor suppressor protein p53, and synthetic gene networks (23–28). Among these, only the model developed by Smolen et al. (25) has described positive and negative feedback loops of two transcription factors similar to Fig. 1. However, that model did not represent dimerization of the repressor, as occurs in the CREB family. That study also did not include bifurcation analysis to examine how dynamics depend on system parameters.
We focused on four essential questions about the dynamic properties of the interlocked feedback loops of CREBs: 1), Are bistability and oscillations possible? 2), How does the strength of positive and negative feedback affect the system dynamics? 3), How could time delays inherent in the regulation of expression of activator and repressor CREB proteins impact the dynamics? 4), How do stochastic fluctuations due to small numbers of molecules of CREBs impact the dynamics? Bifurcation analysis of the minimal model illustrates that both bistability and oscillations are possible given proper strengths of positive and negative feedback. Bistability and oscillations are fairly robust against variations of parameters. Time delays in regulation of CREB expression can alter a stable steady state to a stable limit cycle, or to chaotic dynamics. Stochastic simulations illustrate that a bimodal distribution of the numbers of CREB molecules characterizes the dynamics in the bistable region. The relative robustness of the HIGH and LOW stable states to molecular noise depends on the location of the unstable steady state between the HIGH and LOW states. A critical number of molecules is needed to sustain HIGH CREB expression for a day or longer, which may correlate with consolidation of LTM. A critical number of CREB molecules is also required to sustain robust oscillations. Stochastic resonance is also found. An optimal noise level induces a stochastic oscillation with the most reliable periodicity.
This comparative study of the deterministic bifurcation analysis and stochastic simulations also illustrates a framework to understand other cellular regulatory processes with similar network architectures. Examples include circadian rhythms, the cell cycle, and artificial gene networks.
MODEL DEVELOPMENT AND COMPUTATIONAL METHODS
Minimal model development
The minimal model represents regulation of CREB1 and CREB2 expression by binding of these proteins to CREs near their own genes, degradation of CREB1 and CREB2, and basal synthesis of CREB1 and CREB2 (Fig. 1). A number of simplifications are made. The minimal model does not explicitly describe the translation of creb mRNAs, the phosphorylation of CREBs by kinases, the signaling pathways regulating phosphorylation, or the translocation of CREBs between nucleus and cytoplasm. A homogeneous, single-compartment cellular structure is assumed. The omitted steps are lumped into a single effective synthesis process of CREBs, as illustrated in Fig. 1.
These simplifications lead to a minimal model with two deterministic ordinary differential equations (ODEs):
 |
(1) |
 |
(2) |
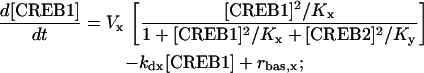
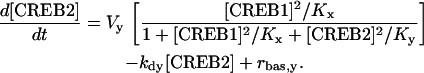
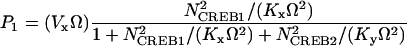
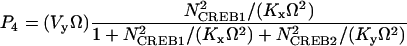
In Eq. 1, the first term of the right-hand side represents the autoactivation of creb1 expression by CREB1 homodimer binding to a CRE. The dependence on CREB2 in the denominator represents repression of creb1 expression by competitive binding of CREB2 homodimer to the same CRE (for further details, see Supplementary Material). The production rate of CREB1 saturates hyperbolically with CREB1 homodimer concentration, and decreases hyperbolically with CREB2 homodimer concentration. The Hill coefficients of 2 for [CREB1] and [CREB2] represent, in the simplest plausible manner, the requirement for two CREB1 or CREB2 monomers to form homodimers. By mass action, homodimer concentration should be more or less proportional to the square of monomer concentration. Equation 2, analogously, represents competitive binding of CREB1 and CREB2 homodimers to the CRE regulating CREB2 expression. These equations are identical to a previously published minimal model for competitive binding of two transcription factors (25), except that the Hill coefficient of CREB2 is 2 here (Eqs. 1 and 2) and a basal synthesis rate is incorporated for CREB2.
In Eqs. 1 and 2, Vx and Vy are the maximum induced synthesis rates of CREB1 and CREB2. Kx and Ky are, respectively, the dissociation constants of CREB1 and CREB2 homodimers from the CRE. The second term in the right-hand side of Eq. 1 represents a first-order degradation of CREB1, where kdx is the degradation rate constant. A small basal synthesis rate of CREB1, rbas,x, is also assumed. In Eq. 2, kdy and rbas,y, have analogous meanings.
The purpose of the minimal model is to investigate the qualitative nonlinear dynamics of the interlocked feedback loops. Currently, there is little data to quantitatively determine the temporal dynamics of CREBs. The parameters in the model (Eqs. 1 and 2) are assigned a set of basal values that have physiological relevance to the characteristic timescales of LTM and that lie within a physiologically feasible range. The basal values of the parameters in Eqs. 1 and 2 are Vx = 0.4 min−1, Vy = 0.01 min−1, Kx = 5, Ky = 10, kdx = 0.04 min−1, kdy = 0.01 min−1, rbas,x = 0.003 min−1, and rbas,y = 0.002 min−1. These basal parameter values were chosen to allow qualitative simulation of CREB1 phosphorylation dynamics observed in 5-HT stimulus protocols (see Fig. 6). Concentrations of CREB1 and CREB2 are expressed in arbitrary units, because the actual protein concentrations of CREBs in neurons are not well defined.
FIGURE 6.

Bifurcation diagram of [CREB1] and [CREB2] versus Vx and time courses of [CREB1]. (A) Diagram depicting an irreversible switch of [CREB1] (thick lines) and [CREB2] (thin lines) versus Vx. (B) Five pulses of 5-HT induce persistent [CREB1] elevation; whereas three pulses of 5-HT only induce transient [CREB1] elevation. (C) An imposed elevation of [CREB1] is simulated by choosing initial conditions [CREB1]t=0 = 0.3 and [CREB2]t=0 = 0.2 (its basal steady state). [CREB1] elevation is paired with a single pulse of 5-HT. Persistent [CREB1] elevation results (solid line). Only a transient [CREB1] elevation results if five pulses of 5-HT are paired with elevation of CREB2 to 2.0 ([CREB1]t=0 is at basal steady state) (dashed line). Parameters are at basal values except when [5-HT]=10 μM, Vx = 3.7 min−1.
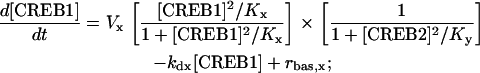
To investigate the robustness of the model dynamics to a change in the binding mechanisms of CREBs to CREs, a model variant was developed. This variant assumes that expression of CREB1 is regulated by noncompetitive binding of CREB1 and CREB2 to different CREs, and similarly for expression of CREB2. This mechanism is represented by another pair of ODEs (Eqs. 3 and 4) (see Supplementary Material):
 |
(3) |
 |
(4) |
Parameters in Eqs. 3 and 4 have the same meanings and basal values as given for Eqs. 1 and 2.
Delayed differential equations (DDEs)
Gene regulatory systems have ubiquitous time delays associated with translocation of mRNA and transcription factors between cytoplasm and nucleus and, thereby, transcription of genes (29–32). To explore the effects of time delays on the model of Eqs. 1 and 2, discrete delays for the synthesis of CREB1, τCREB1, and CREB2, τCREB2, were incorporated into terms that describe the synthesis of CREBs. The resulting DDEs are:
 |
(5) |
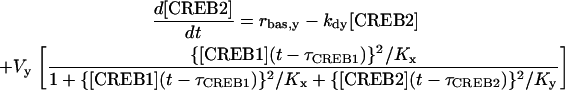 |
(6) |
These DDEs were simulated as follows, the values of [CREB1] and [CREB2] at any given time t are stored and used after delays τCREB1 and τCREB2 to calculate the derivatives of [CREB1] and [CREB2], respectively.
Stochastic format of ODE model
The numbers of CREB1 and CREB2 molecules are likely to be in the range of tens to hundreds in a single neuron (33). Consequently, we investigated the stochastic effects of the finite number of molecules on the system dynamics. The Gillespie stochastic modeling algorithm (30,34) was implemented to simulate a stochastic version of the minimal model (Eqs. 1 and 2). The representative reactions and their respective propensity functions are listed in Table 1.
TABLE 1.
Stochastic version of the minimal model
| Reaction | Propensity function | ||
|---|---|---|---|
 |
|
||
 |
|
||
 |
|
||
 |
|
||
 |
|
||
 |
|
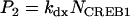

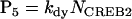

NCREB1 and NCREB2 in Eqs. 7–12 represent the number of molecules of CREB1 and CREB2. In the second column, the propensities of occurrence of each reaction step are derived from kinetic terms in Eqs. 1 and 2, and are scaled by multiplication of the system volumetric parameter Ω. Eqs. 7 and 8 describe the production and degradation propensity function, respectively, of CREB1. Eq. 9 describes the basal synthesis propensity of CREB1. Eqs. 10–12, for CREB2, are analogous to Eqs. 7–9. Parameters in Eqs. 7–12 are the same as for the deterministic ODEs (Eqs. 1 and 2), and have the same basal values.
Reaction probabilites, or propensities for the synthesis of CREB1 and CREB2, are modeled by use of the Hill-type rate expression in the Gillespie algorithm. An alternative approach would be to decompose the synthesis of CREB1/2 into a series of elementary reactions (unimolecular or bimolecular) and use only rates for such elementary reactions in the Gillespie algorithm. We chose the former approach, for two reasons. First, recent comparisons between both approaches in simulations of gene regulation and protein phosphorylation underlying circadian rhythms found that composite Michaelis-Menten type rate expressions gave very similar results to elementary reaction rates (35–37). Second, retaining the basic form of the minimal model in both cases allows for a direct comparison of the minimal model dynamics predicated by deterministic and stochastic simulations. This approach also avoided substantially increasing the number of reactions and differential equations.
Computational methods
For deterministic simulation, ODEs were numerically integrated using the fourth-order Runge-Kutta algorithm in the numerical analysis package XPPAUT (38). Numerical bifurcation analyses of the ODEs were performed with XPPAUT. DDEs were numerically integrated by three software tools: DDE solver in XPP, dde23 in Matlab (39), and a program implementing forward Euler algorithm for DDEs. Differences of computational results with these DDE integrators were not significant.
For stochastic simulation, the Gillespie algorithm was programmed in FORTRAN. The random number generator used was from the IMSL statistics library. Power spectrum density (PSD) analysis to characterize the spectrum (or period) features of stochastic time series was performed in Matlab.
RESULTS
Varying the strength of negative feedback generates four different bifurcation diagrams, in which bistability and oscillations are observed
Fig. 1 represents the minimal model. In the positive feedback loop, binding of the CREB1 homodimer to CRE further activates the production of CREB1. In the negative feedback loop, CREB2 repressor homodimers bind to CRE, inhibiting the production of CREB2. In addition, CREB1 activates CREB2 expression; whereas CREB2 represses CREB1 expression. Therefore, the positive feedback loop of CREB1 and negative feedback loop of CREB2 are interlocked.
We proceeded to use Eqs. 1 and 2 to investigate how dynamics vary with the strength of positive feedback by CREB1 for different strengths of negative feedback by CREB2. Varying Vx, the strength of autoactivation by CREB1 of CREB1 synthesis, alters the strength of positive feedback. Therefore, we depicted the dynamics with one-parameter bifurcation diagrams of [CREB1] versus Vx. Fig. 2, A–D, illustrate four different bifurcation diagrams, each at a different fixed value of Vy, the production rate of repressor CREB2. Each diagram therefore corresponds to a different strength of the negative feedback in which CREB2 represses synthesis of both CREBs.
FIGURE 2.

Bifurcation diagrams of [CREB1] versus Vx at four values of Vy and graphs depicting period of oscillation as a function of Vx. Solid lines depict stable steady states, dashed lines depict unstable steady states; solid (open) circles denote maximum and minimum values of [CREB1] on stable (unstable) limit-cycles. Codimension-1 singular points are marked as LP, limit point (or saddle-node point); sub-H, subcritical Hopf bifurcation point; sup-H, supercritical Hopf point; HC, homoclinic point; SNIC, saddle-node-invariant-circle bifurcation; and LP-PO, limit point on periodic orbits. (A) Bifurcation diagram at Vy = 0.01 min−1. (B) Bifurcation diagram at Vy = 0.4 min−1. (C1) Bifurcation diagram at Vy = 0.8 min−1. (C2) Period of oscillations at Vy = 0.8 min−1. (D1) Bifurcation diagram at Vy = 2 min−1. (D2) Period of oscillations at Vy = 2 min−1. Other parameters have basal values: Kx = 5; Ky = 10; kdx = 0.04 min−1; kdy = 0.01 min−1; rbas, x = 0.003 min−1; and rbas, y = 0.002 min−1.
In Fig. 2 A, for a very weak negative feedback strength (Vy = 0.01 min−1), bistable steady states of [CREB1] arise in the range of Vx bounded by two limit points (LP1 and LP2). Outside of this range only a single steady state of [CREB1] exists. Upon increasing Vy to 0.4 min−1 (Fig. 2 B), oscillations bifurcate from the upper steady state of the bistability region at a subcritical Hopf (sub-H) point (Fig. 2 B, oscillation amplitudes marked by open circles). These unstable oscillations coalesce with the unstable middle branch of steady states connected by LP1 and LP2 (Fig. 2 B, dashed line), generating a homoclinic (HC) bifurcation point. The upper steady-state solution is unstable between LP1 and sub-H, but becomes stable beyond sub-H for larger values of Vx. Upon further increasing Vy to 0.8 min−1 (Fig. 2 C), the sub-H point moves beyond the bistability range of Vx bounded by LP1 and LP2 (Fig. 2 C1). Now, as sub-H is crossed from lower to higher values of Vx, a stable limit-cycle oscillation (solid circles) is replaced, in a narrow region, by the coexistence of a stable limit-cycle oscillation and a stable steady state. At the limit point of periodic orbits (LP-PO), stable and unstable limit-cycle oscillations coalesce. Decreasing Vx from LP-PO, the amplitude of oscillation decreases, but the period lengthens (Fig. 2 C2). When Vx decreases to LP2, the limit-cycle oscillation disappears at a saddle-node-invariant-circle (SNIC) bifurcation point, and is replaced by a stable steady state. The period of oscillation at SNIC tends to infinity (Fig. 2 C2).
As Vy is increased to 2.0 min−1 (Fig. 2 D), the two limit points (LP1 and LP2) both move together and coalesce at a SNIC. Consequently, bistability disappears. Oscillations are preserved, but now arise on the left from a supercritical Hopf bifurcation point (sup-H). The sub-H in Fig. 2 D1 is similar to that in Fig. 2 C1. The main difference between sub-H and sup-H is that upon crossing sup-H, an oscillation with small amplitude arises from a stable steady state, whereas upon crossing sub-H, an oscillation with large amplitude abruptly arises from a stable steady state. Fig. 2 D2 illustrates that the period of limit-cycle oscillation decreases from sup-H to sub-H. Thus, the interlocked feedback loops of CREBs might support limit-cycle oscillation with a broad range of periods, e.g., from hours to days (Fig. 2, C2 and D2). Alternatively, by scaling all the parameters containing units of time, any biologically reasonable oscillation period can be obtained.
How many qualitatively different one-parameter bifurcation diagrams of [CREB1] versus Vx may be attained at different Vy? This question can be answered by inspection of the two-parameter bifurcation diagram in the (Vx, Vy)-parameter plane (Fig. 3 A), which is constructed by continuation of the loci of five different types of codimension-1 singular points identified in Fig. 2, A–D, namely, LP (LP1, LP2), Hopf (sub-H, sup-H), SNIC, HC, and LP-PO. XPPAUT was used to numerically determine and continue the loci of these singular points. Four distinct bifurcation diagrams of [CREB1] versus Vx are observed. The typical value of Vy for each case is marked A–D in Fig. 3 A. These values correspond to the one-parameter bifurcation diagrams of Fig. 2, A–D, respectively. The loci of SNIC and LP2 are overlapping in Fig. 3 A because SNIC and LP2 occur at identical Vx (Fig. 2 C1). The loci of HC and LP-PO are close to the sub-H in Fig. 3 A. Two codimension-2 singular points, a cusp point and a Bogdanov-Takens (BT) bifurcation point, are identified in Fig. 3 A. At the cusp point (Vx, Vy) = (0.736 min−1, 1.627 min−1), the LP1 and LP2 limit points coalesce. Therefore, upon crossing the cusp point, three steady states appear from a single steady state. The BT bifurcation, at (Vx, Vy) = (0.218 min−1, 0.057 min−1), is caused by coalescence of a limit point (here LP1) and a Hopf bifurcation point (sub-H). Upon crossing BT, a Hopf bifurcation (sub-H) appears, corresponding to the appearance of an oscillating solution.
FIGURE 3.

(Vx, Vy) bifurcation diagram with corresponding distinct phase diagrams of [CREB1] versus [CREB2]. (A) Bifurcation diagram with loci of six codimension-1 singular points: LP, sub-H, sup-H, SNIC, HC, and LP-PO. These loci delineate seven regions, denoted by I, II, III, IVa, IVb, Va, and Vb. Two codimension-2 singular points exist: a cusp point and a Bogdanov-Takens (BT) bifurcation point. Values of Vy denoted by A–D correspond to the Vy values in Fig. 2, A–D, respectively. Basal parameter values are otherwise used. (B) Phase diagrams corresponding to the labeled regions in A. Stable (unstable) steady states are denoted by solid (open) circles, stable (unstable) limit-cycle oscillations by solid (dashed) lines.
Further inspection of Fig. 3 A illustrates that the (Vx, Vy)-parameter plane is divided into seven regions by the loci of different bifurcation points, as depicted by Regions I–III, IVa, IVb, Va, and Vb. The seven corresponding phase diagrams of the dynamic solutions for [CREB2] and [CREB1] are illustrated in Fig. 3 B. In Region I of Fig. 3 A, only a single steady state with low concentrations of CREB1 and CREB2 exists (Fig. 3 B,I). In Region II of Fig. 3 A, similar to Region I, only a single steady state may exist, but with higher concentrations of CREB1 and CREB2. This is due to the stronger positive feedback (Vx) in Region II than in region I as well as the weaker negative feedback (Vy) in Region II. In Region-III, bounded by LP1, LP2, and sub-H, three steady states arise, but only the lower steady state is stable to small perturbations in [CREB1] or [CREB2] (Fig. 3 B, III). In Region IV (IVa and IVb) of Fig. 3 A, bounded by LP1, LP2, sub-H, and horizontal axis of Vx, three steady states exist (Fig. 3 B, IVa and IVb). Bistability exists, in which the upper and lower steady states are stable to small perturbations, but the middle steady state is unstable. The only difference between the phase diagrams depicted in Fig. 3 B, IVa and IVb, is that the upper state in the phase diagram of IVb is surrounded by an unstable limit cycle. In the phase diagram of Fig. 3 B, Va, a stable limit cycle surrounds an unstable steady state. In Fig. 3 B, Vb, a stable limit cycle surrounds an unstable limit cycle, which further surrounds a stable steady state.
In summary, by manipulating the strength of the positive and negative feedbacks, three classes of system dynamics may be attained: a single stable steady state (Fig. 3 B, I–III), bistable steady states (Fig. 3 B, IVa and IVb), and limit-cycle oscillations (Fig. 3 B, Va and Vb). The relatively large regions of bistability (Region IV) and oscillatory dynamics (Region V) in Fig. 3 suggest that parameters with values in these regions may have some physiological significance in regulating CREB dynamics.
Bistability and oscillations in the minimal model are robust to variations in parameters and binding mechanisms
One way to investigate the robustness (or sensitivity) of system dynamics is to vary system parameters and observe changes in the size and location of the parameter regions where particular dynamics exist. The small number of parameters in the minimal model allows a systematic analysis. Fig. 4 displays the two-parameter bifurcation diagram in the (Vx, Vy) plane after doubling the values of the six parameters in Eqs. 1 and 2. Since homoclinic bifurcations (HC) and limit points on periodic orbits (LP-PO) are very close to the subcritical Hopf (sub-H) point in these parameter ranges, only the Hopf points (sub-H and sup-H) and the limit points (LP1 and LP2) are plotted.
FIGURE 4.

Impact of doubling the values of parameters on the two-parameter bifurcation diagram in the (Vx, Vy) plane. Solid lines depict loci of limit points (LP1, LP2), dashed lines depict loci of Hopf bifurcation points (sup-H, sub-H). Thin lines correspond to parameters with basal values, thick lines correspond to doubling a parameter value. (A) Kx is doubled. (B) Ky is doubled. (C) kdx. (D) kdy. (E) rbas,x. (F) rbas,y.
Fig. 4, A and B, depicts the result of doubling the dissociation constants of CREB1 and CREB2 from CREs (Kx and Ky, respectively). Doubling Kx versus doubling Ky gives opposite effects on the location of the loci of limit points (LP1 and LP2) and Hopf bifurcation points (sub-H and sup-H), with doubling of Kx moving LPs and Hopf points to larger values of Vx and Vy. This shift is produced because an increase in Kx increases the dissociation of CREB1 from CREs, thereby decreasing the production of CREB1 and CREB2, so that larger values of Vx and Vy are needed to compensate. In contrast, an increase in Ky increases dissociation of CREB2 from CREs, thereby increasing the production of CREB1 and CREB2. Fig. 4, C and D, illustrates the result of doubling the degradation rate constants of CREB1 and CREB2 (kdx and kdy). Increases in these parameters also have opposite effects on the location of LPs and Hopf points. One significant effect of increasing kdy is an elimination of oscillatory dynamics (Fig. 4 D) because at large kdy, rapid degradation of CREB2 significantly weakens the strength of the negative feedback loop that is required for oscillations. Fig. 4, E and F, display the location of LPs and Hopf points when doubling the basal synthesis rates of CREB1 and CREB2 (rbas,x and rbax,y). Doubling rbas,x significantly shrinks both regions of bistability and oscillation, whereas doubling rbas,y has little effect on these regions. Taken together, the bistability and oscillatory dynamics are robust to variations of system parameters.
We next examined whether bistability and oscillations are robust to a change in the mechanism of CREBs binding to CREs. The model of Eqs. 1 and 2 describes competitive binding of CREB1 and CREB2. The model variant of Eqs. 3 and 4 describes noncompetitive binding. Fig. 5 compares the regions of bistability and oscillation for the two binding mechanisms. Changing the mechanism has negligible impact on the limit points (LP1 and LP2), but significantly affects the location of the Hopf bifurcations (sub-H and sup-H). For noncompetitive binding, only sup-H bifurcations exist (thick sup-H curve), in contrast with competitive binding (thin sup-H and sub-H curves). Limit-cycle oscillations for noncompetitive binding occur only in the region bounded by the thicker sup-H curve and LP2, which is much smaller in size than the corresponding region for competitive binding (bounded by the thin curves sub-H, sup-H, and LP2). For noncompetitive binding, the sup-H bifurcation points coalesce and disappear at a degenerate Hopf point (DH) of codimension 2. Fig. 5 illustrates that for both binding mechanisms, the size of the region corresponding to bistability and oscillations is fairly large, indicating that the dynamics are relatively robust to a change in binding mechanism.
FIGURE 5.

Bifurcation diagrams in the (Vx, Vy) plane. Thin curves correspond to competitive binding (Eqs. 1 and 2), thick curves correspond to noncompetitive binding (Eqs. 3 and 4). Solid curves depict loci of LP, dashed lines depict loci of Hopf bifurcation points (sub-H, sup-H). Three codimension-2 singular points are identified as cusp point, Bogdanov-Takens (BT) bifurcation, and degenerate Hopf bifurcation (DH). The basal set of parameter values was used.
The minimal model can qualitatively simulate several experimental findings
Bistability of creb expression might help to explain several experimental findings concerning the dynamics of CREB1 and CREB2 in protocols that can lead to LTM formation in Aplysia. Empirically, five pulses of treatment with 5-HT induce long-term strengthening or facilitation of synapses between Aplysia sensory neurons and motor neurons, whereas three pulses do not (40). This long-term synaptic facilitation (LTF) correlates both with increased CREB expression (14) and with long-term memory formation. Empirically, injection of CREB1 into sensory neurons lowers the threshold for LTF induction from five 5-HT pulses to one pulse (15). In contrast, injection of CREB2 prevents LTF from being elicited by five pulses (16).
To phenomenologically simulate pulsed 5-HT application, the synthesis rate constant of CREB1 (Vx) in Eqs. 1 and 2 was briefly increased. Vx was increased from its basal value (0.4 min−1) to 3.7 min−1 to correspond to a [5-HT] elevation from 0 to 10 μM. A bistable bifurcation diagram of [CREB1] and [CREB2] versus Vx was constructed using Eqs. 1 and 2 (Fig. 6 A). This diagram exhibits two stable high and low branches (solid lines) and an unstable middle branch (dashed line). An elevation in Vx can cause [CREB1] to transit from the LOW to the HIGH state. The HIGH state is stable when [5-HT] = 0. After 5-HT is removed, [CREB1] will not return to a basal level, but will remain in the HIGH state. Such a bifurcation diagram is called an “irreversible switch”. Two thresholds exist in this bifurcation diagram. One threshold concerns the bifurcation parameter (Vx)—the limit point at Vx ≈ 0.67 min−1. The second threshold concerns the variable [CREB1]—the unstable middle steady state of [CREB1] (∼0.43) at [5-HT] = 0.
If Vx is elevated above the first threshold for a sufficient duration, [CREB1] will increase to the HIGH state and will remain there when Vx returns to basal levels. Fig. 6 B illustrates that five simulated pulses of 10 μM [5-HT] (Vx increased to 3.7 min−1 for 5 min, interpulse interval = 15 min) induce persistent [CREB1] elevation. However, three pulses cannot, in qualitative agreement with experiment (40).
The physiological significance of the [CREB1] threshold at [5-HT] = 0 correlates with the CREB1 elevation required to induce the persistent HIGH state of [CREB1]. The simulation displayed as the solid line in Fig. 6 C pairs a single pulse of 5-HT (5 min, [5-HT] = 10 μM) with an imposed elevation of [CREB1] (to 0.3) such as might be produced by injecting CREB1 into a neuron. This pairing induces long-lasting CREB1 elevation. Because increased CREB1 expression correlates with LTF, this simulation is consistent with the observation that injection of CREB1 allows LTF following a single 5-HT pulse (15). In the simulation, the imposed elevation of [CREB1] is near but below the threshold of CREB1 (middle, unstable steady state of [CREB1], Fig. 6 A). Thus, a single pulse of 5-HT suffices to move [CREB1] up past the threshold to elicit persistent CREB1 elevation. In contrast, the simulation displayed as the dashed line in Fig. 6 C pairs an imposed elevation of [CREB2] (to 2.0) with five pulses of 5-HT. With [CREB2] = 2.0, only a lower stable steady state of [CREB1] exists; therefore, only a transient elevation of CREB1 results. This simulation is consistent with the empirical observation that injection of CREB2 blocks 5-HT-induced LTF (16). In the model, the elevated CREB2 inhibits CREB1 expression sufficiently to overwhelm positive feedback, eliminating the stable HIGH state of [CREB1].
Time delays in the expression of CREB1 or CREB2 can destabilize steady states and oscillations
Gene regulatory systems are characterized by time delays between regulation of transcription and appearance of functional gene product. Delays are created by processes such as translocation of mRNA and transcription factors between the cytoplasm and nucleus. Differential equations containing discrete time delays have often been used to provide approximate, qualitative models of biological systems with delay (29–32), and we adopt this technique here. The addition of discrete delays to ordinary differential equations such as Eqs. 1 and 2 allows for qualitative predictions of how delays affect dynamics without greatly altering the form or complexity of the model. However, we note that biological delays are not actually discrete. To model more precisely the processes underlying delays, such as macromolecular diffusion or active transport, partial differential equations would be required.
To qualitatively explore the effects of time delays on the model of Eqs. 1 and 2, discrete delays for the synthesis of CREB1, τCREB1, and of CREB2, τCREB2, were incorporated into the terms that describe the production processes of CREBs in Eqs. 1 and 2. The resulting DDEs are given as Eqs. 5 and 6. With low levels of negative feedback (Vy = 0.01 min−1, other parameters as in Fig. 2 A), neither τCREB1 or τCREB2 can induce a limit-cycle oscillation. For small Vy, the stability of the steady states in Fig. 2 A (lower and upper stable, middle unstable) is not affected by introducing τCREB1 or τCREB2. Negative feedback is required to sustain oscillations irrespective of time delays. With more negative feedback (Vy ≥ 0.4 min−1, Fig. 2, B–D) either τCREB1 or τCREB2 can destabilize a steady state and generate a limit-cycle oscillation. Fig. 7 illustrates how introducing τCREB1 and τCREB2 impacts the stability of the steady-state and oscillatory solutions in Fig. 2 D1. As shown in Fig. 7 A1, starting from the stable limit cycle of Fig. 2 D1 (Vy = 2 min−1, Vx = 1 min−1), the amplitude of oscillations is rapidly reduced by increasing τCREB1. The stable oscillation disappears at a Hopf bifurcation, τCREB1 = 9 min, and is replaced by a stable steady state for 9 min ≤ τCREB1 ≤ 100 min. This state is destabilized by another Hopf bifurcation at τCREB1 = 100 min. The amplitude of the resulting stable oscillations varies in a complicated way for τCREB1 > 100 min, as does the period (Fig. 7 A1, inset). Fig. 7 A2 illustrates the impact of τCREB2 on the limit cycle of Fig. 2 D1. For 0 ≤ τCREB2 < 100 min, τCREB2 rapidly increases the amplitude of oscillations; however, when τCREB2 > 100 min, the amplitude reaches a plateau. The inset illustrates that the period varies linearly with τCREB2.
FIGURE 7.

Bifurcation diagrams illustrating effects of time delays. Diagrams were each constructed by a large number of individual simulations. Each point corresponds to a single simulation that was run sufficiently long to determine the attractor dynamics, whether a steady state or a limit cycle. For limit cycles, maxima and minima are plotted. Parameter values are as in Fig. 2 D1 (Vy = 2 min−1). (A) At Vx = 1 min−1, oscillations exist with no time delays. (A1) Bifurcation parameter τCREB1 (at τCREB2 = 0); destabilization of oscillation or stable steady state is through Hopf bifurcations. (Inset) Dependence of period on τCREB1. (A2) Bifurcation parameter τCREB2 (at τCREB1 = 0). (Inset) Dependence of period on τCREB2. (B) Vx = 0.5 min−1, a steady state of low [CREB1] exists with τCREB1 = 0 and τCREB2 = 60 min. Increasing τCREB1 destabilizes the steady state through a Hopf bifurcation. (Inset) Dependence of period on τCREB1. (C) Vx = 2.8 min−1, a steady state of high [CREB1] exists with τCREB1 = τCREB2 = 0. (C1) Bifurcation parameter τCREB1 (at τCREB2 = 0). (C2) Bifurcation parameter τCREB2 (at τCREB1 = 0). (Inset) Expansion of the τCREB2 axis.
For a low stable steady state of [CREB1] in Fig. 2 D1 (Vy = 2 min−1, Vx = 0.6 min−1) neither τCREB1 nor τCREB2 separately can destabilize this state. However, a proper combination of τCREB1 and τCREB2 can destabilize it (Fig. 7 B). At τCREB2 = 60 min, increasing τCREB1 to 180 min destabilizes the lower steady state. The amplitude of oscillations significantly increases with increasing τCREB1 and reaches a plateau for τCREB1 > 600 min. The period varies linearly with τCREB1 (Fig. 7 B, inset).
Finally, starting from the stable steady state with high [CREB1] in Fig. 2 D1 (Vy = 2 min−1, Vx = 2.8 min−1), introduction of either τCREB1 or τCREB2 can destabilize the state. As illustrated in Fig. 7 C1 with τCREB2 = 0, an increase in τCREB1 to 180 min induces an oscillation via Hopf bifurcation from the steady state. A further increase in τCREB1 to ∼850 min or above generates a time course of [CREB1] that, although oscillatory, exhibits substantial random variation in oscillation amplitudes (broad dark area in Fig. 7 C1). Such a time course suggests chaotic dynamics. For τCREB1 = 0 and τCREB2 increasing, when τCREB2 reaches ∼3 min (Fig. 7 C2, inset), an oscillatory solution bifurcates from the steady state. Increasing τCREB2 increases the period linearly (not shown).
Further simulations illustrated qualitatively similar effects of these time delays on the stability of the HIGH and LOW steady states in the bistable regions of Fig. 2 B, and of oscillatory solutions in Fig. 2 C 1. In summary, both τCREB1 and τCREB2 can destabilize either stable steady states or stable limit-cycle oscillations. Increasing τCREB1 may generate chaotic dynamics (Fig. 7 C1). In contrast, increasing τCREB2 appears only to generate regular oscillations.
For plausible average molecule numbers, bistability is preserved when stochastic fluctuations are considered
Stochastic molecular noise may have a significant impact on nonlinear system dynamics (41–43). To what extent can deterministic bifurcation diagrams predict the behavior when stochastic noise due to fluctuating copy numbers of molecular species is present? In this section, the relationship between deterministic bifurcation analysis and the dynamics with noise is examined. The Gillespie algorithm is used to simulate the dynamics with molecular noise. The propensity associated with each reaction step in Table 1 is a stochastic version of each kinetic term in Eqs. 1 and 2. At each time step, the algorithm randomly chooses which possible reaction event occurs, updates the system state accordingly, and also determines the time step to the next reaction event. In Table 1, the parameter Ω transforms the concentration units into molecule numbers, and the kinetic rate constants are expressed in terms of molecule numbers. Ω represents the system volume.
As illustrated in Fig. 8, deterministic bifurcation diagrams are able to predict the outcomes of stochastic simulations of the model in the bistability region. Fig. 8 A repeats the bifurcation diagram of Fig. 2 A with Vy = 0.01 min−1 (low negative feedback), in which there is a large bistable region. From this diagram, specific values of Vx were chosen for stochastic simulations. These were 1), Vx = 0.1 min−1, with a single low steady state of [CREB1] (Fig. 8 A, dash-dotted line B); 2), Vx = 0.18 min−1; 3), Vx = 0.2 min−1; 4), Vx = 0.22 min−1; 5), Vx = 0.24 min−1; and 6), Vx = 0.7 min−1. Values 2–5 all lie within the bistable region of Fig. 8 A (Fig. 8 A, inset, lines C–F); and value 6 corresponds to a single high steady state. For these values of Vx, the outcomes of stochastic simulations are illustrated in Fig. 8, B–G, respectively.
FIGURE 8.

Relation between the deterministic bifurcation diagram and stochastic simulations in or near the region of bistability. (A) Bifurcation diagram of [CREB1] versus Vx at Vy = 0.01 min−1. When 0.177 min−1 ≤ Vx ≤ 0.68 min−1, there exist two stable steady states (solid line) and an unstable steady state (dashed line). (Inset) Expansion of Vx axis. (B–G) Stochastic simulation at six values of Vx corresponding to lines marked B–G in A. (B1–G1) Time courses of the number of CREB1 molecules. (B2–G2) Steady-state probability distributions. (B) Vx = 0.1 min−1. (C) Vx = 0.18 min−1. (D) Vx = 0.2 min−1. (E) Vx = 0.22 min−1. (F) Vx = 0.24 min−1. (G) Vx = 0.7 min−1. The volume factor Ω = 10.
At Vx = 0.1, the stochastic time course in Fig. 8 B1 exhibits a fluctuation between 0 and 10 in the number of CREB1 molecules. Fig. 8 B2 illustrates the corresponding steady-state probability distribution of the number of CREB1 molecules. For this case, corresponding to a single deterministic steady state of low [CREB1], the probability distribution has a unimodal shape. At Vx = 0.18 min−1, two stable steady states and one unstable steady state exist in Fig. 8 A. In the presence of molecular noise, CREB1 molecule numbers flip between the neighborhoods of the two stable steady states, as illustrated by the stochastic time series in Fig. 8 C1. Most commonly, CREB molecule numbers reside around the LOW state, and only occasionally near the HIGH state. Consequently, the steady-state probability distribution of the number of CREB1 molecules (Fig. 8 C2) exhibits a bimodal distribution (44,45) with a higher hump at a small number of CREB1 (∼1–2) and a lower hump at CREB1 ∼15.
When Vx is successively increased to 0.2 min−1, 0.22 min−1, and 0.24 min−1, the corresponding CREB1 time series (Fig. 8, D1–F1) illustrate that CREB1 molecule numbers reside progressively more commonly near the HIGH state. The steady-state bimodal probability distributions (Fig. 8, D2–F2) shows a progressive shift toward the HIGH state. Upon further increasing Vx to 0.7 min−1, which corresponds deterministically to a single steady state with high [CREB1], CREB1 molecule numbers are found to reside near the HIGH state (Fig. 8 G1), with a unimodal probability distribution (Fig. 8 G2).
Why do CREB1 molecule numbers sometimes preferentially reside around the LOW state (e.g., Fig. 8 C), and other times around the HIGH state (e.g., Fig. 8 F)? One important factor determining these preferences can be found by inspecting the bistability region of the deterministic bifurcation diagram. Inspection of the dash-dotted line C (Fig. 8 A, inset) illustrates that the middle unstable steady state is vertically closer to the upper steady state than to the lower steady state, whereas on line F (Fig. 8 A, inset), the middle unstable steady state is vertically closer to the lower steady state. The unstable steady state plays the role of threshold for the noise-induced transitions between the two stable steady states (i.e., the difference in the CREB1 molecule numbers between either stable steady state and the middle state is a barrier that has to be overcome for the occurrence of state transitions). The larger the barrier, the more robust the steady state is to molecular noise. On line F (Fig. 8 A, inset) one can predict that the LOW state is less robust to noise. This is the outcome of the stochastic simulation, with CREB1 molecule numbers usually residing near the HIGH state (Fig. 8 F2). From lines C–F (Fig. 8 A, inset), the distance from the HIGH state to the middle unstable state becomes larger, predicting that the residence time near the HIGH state should become larger. Stochastic simulations illustrate this, with the probability distribution peak shifting to the HIGH state (Fig. 8, C–F). The deterministic bifurcation diagram helps one to predict the rough shape of the probability distribution and the relative residence time of CREB molecule numbers near stable states.
Next, the first transition time (FTT) (46,47) was employed to examine how the robustness of bistable steady states changes with the numbers of molecules of each species, which scale with the volumetric parameter Ω. FTT is defined as the time interval required for the system to transit between steady states (e.g., FTT (HIGH to LOW) represents the time interval at which a system initially at the HIGH state flips for the first time to the LOW state). A simulated FTT depends on the seed of the random number generator. Therefore, an average FTT over a number of stochastic simulation runs must be used to characterize the average lifetime of a stable steady state. Fig. 9 illustrates FTTs for HIGH to LOW and vice versa. In Fig. 9 A, for discrete values of Ω, FTTs (LOW to HIGH) are plotted as solid circles and FTTs (HIGH to LOW) as open circles. Each vertical set of small circles consists of 100 individual FTTs for each Ω, and within each vertical set, the large circle corresponds to the average FTT for that set. Fig. 9, A and B, differ in that Vx = 0.18 min−1 for Fig. 9 A (Fig. 8 A, line C) and Vx = 0.24 min−1 for Fig. 9 B (Fig. 8 A, line F). Fig. 9, A and B, illustrates that the average FTTs (HIGH to LOW) and (LOW to HIGH) both always increase with increasing Ω. Increasing Ω corresponds to increasing average molecule numbers, thereby approaching a deterministic system. Thus, random transitions between the HIGH and LOW states become rare. For each of the four sets of FTTs, the average FTTs (larger circles) are fit reasonably well by straight lines, as illustrated. These linear fits of the logarithmic plots indicate that the average FTTs are all exponentially dependent upon Ω, in agreement with Bialek (48).
FIGURE 9.

First transition time and the average of 100 simulations of the bistable steady states (HIGH and LOW) versus Ω. (A) FTT and the mean of the HIGH and LOW states versus Ω at Vx = 0.18 min−1, Vy = 0.01 min−1. Small solid circles denote individual FTTs (LOW to HIGH), and large solid circles are the averages of 100 vertically adjacent FTTs. Small open circles denote individual FTTs (HIGH to LOW), and large open circles are average FTTs. Solid line denotes the exponential fit of the average FTT (LOW to HIGH) versus Ω, and dashed line denotes the exponential fit of the average FTT (HIGH to LOW) versus Ω. (B) Similar to A, but at Vx = 0.24 min−1, Vy = 0.01 min−1. Other parameters are as in Fig. 8.
The average FTTs (LOW to HIGH) are much longer than the average FTTs (HIGH to LOW) for the case represented in Fig. 9 A, in which the deterministic HIGH state is closer to the unstable middle state than is the deterministic LOW state (Fig. 8 A, inset, line C). At Ω = 10, the average number of CREB1 molecules is ∼20, and the average FTT (LOW to HIGH) (or the average lifetime of the LOW state) is ∼850 h, whereas the average FTT (HIGH to LOW) is only ∼1.5 h. Even at Ω = 50 (∼100 CREB1 molecules on average), the average lifetime of HIGH is only ∼4 h. However, with increased strength of positive feedback (Vx = 0.24 min−1) (Fig. 8 A, line F), there is a dramatic shift in the FTTs. The average FTT (HIGH to LOW) now becomes much larger than the average FTT (LOW to HIGH), as illustrated in Fig. 9 B. At Ω = 8, the average number of CREB1 molecules is only ∼15, but nevertheless the average FTT (HIGH to LOW) is ∼450 h. This means that ∼15 CREB1 molecules can sustain a HIGH state with an average lifetime of tens of days in this case. Thus, at a higher strength of positive feedback, small average molecule numbers suffice to maintain a persistent state of elevated CREB1 expression. As discussed previously, such a state might correlate physiologically with prolonged gene induction by CREB1 and consequent establishment of long-term memory.
We further examined how negative feedback impacts the robustness of the bistable steady states. By increasing the strength of negative feedback (e.g., varying Vy from 0.01 min−1 to 0.06 min−1), the distance of the HIGH state from the threshold becomes smaller for a fixed Vx = 0.22 min−1 (data not shown). Correspondingly, the average FTT (HIGH to LOW), decreases from ∼60 h to ∼5 h. For a fixed but strong negative feedback (Vy = 0.07 min−1), increasing Vx increases the distance of HIGH from the threshold and increases the average FTT (HIGH to LOW), as in Fig. 9. Thus the robustness of the “memory” (HIGH) state against noise can be increased substantially by decreasing negative feedback strength as well as by increasing positive feedback strength.
Molecular noise degrades deterministic oscillations, but can also induce oscillations via stochastic resonance
What molecule numbers are required for oscillations predicted by deterministic ODEs to persist in the presence of molecular noise? To examine this issue, we used the Gillespie method to simulate the effect of noise on the limit cycle of Fig. 2 C1 (Vx = 0.9 min−1, Vy = 0.8 min−1). When a small number of CREB molecules (Ω = 10) are present in the system, the stochastic time course (Fig. 10 A, left) of the number of CREB1 molecules fluctuates between 1 and 140. The corresponding phase diagram of CREB1 versus CREB2 (Fig. 10 A, middle) exhibits an attractor very smeared out by noise, and the PSD versus frequency (Fig. 10 A, right) is rather broad. Therefore, at these low average molecule numbers, reproducible oscillations have been eliminated by noise. When Ω is increased to 50 (Fig. 10 B), the number of CREB1 molecules and the corresponding phase diagram exhibit less noisy oscillatory dynamics. The PSD exhibits a much narrower frequency distribution with a peak near 0.1 h−1. Thus, with average molecule numbers in the low hundreds, regular oscillations are preserved despite noise. This range of molecule numbers was found to be sufficient to preserve oscillations in previous reduced models of gene regulation (29,30). When Ω increases to 200 (Fig. 10 C), fluctuations are still significant. However, the regularity of periodicity is prominent, as illustrated by the sharp PSD peak at ∼0.1 h−1 (Fig. 10 C, right). With Ω = 500, the oscillation is very close to the deterministic limit cycle (Fig. 10 D).
FIGURE 10.

Characterization of stochastic oscillatory dynamics at four values of Ω. (Left column) Time series of the number of CREB1 molecules. (Middle column) Molecule-number trajectories of CREB1 versus CREB2. (Right column) Power spectrum densities (arbitrary unit) versus frequency (h−1) of the time courses. (A) Ω = 10. (B) Ω = 50. (C) Ω = 200. (D) Ω = 500. Parameter values correspond to deterministic oscillations: Vx = 0.9 min−1, Vy = 0.8 min−1 (Fig. 2 C1), other parameters at basal values.
The above simulations illustrate degradation of oscillations by noise. However, in a phenomenon termed stochastic resonance, molecular noise has also been shown, in a variety of systems, to induce oscillations when the system is at a deterministic steady state but close to a Hopf bifurcation point (49,50). We examined whether the minimal model exhibits this phenomenon. Fig. 11 A illustrates the time courses of stochastic oscillations in the number of CREB1 molecules for Ω = 50, 100, and 1000, with model parameters corresponding to a deterministic steady state (Vx = 0.75 min−1) (Fig. 2 D1) close to a supercritical Hopf bifurcation point (Vx = 0.78 min−1) (Fig. 2 D1). Large fluctuations in CREB1 molecule numbers occur for these values of Ω. Inspection of these time courses does not suffice to determine whether an oscillatory component is significant. It is necessary to construct PSD distributions.
FIGURE 11.

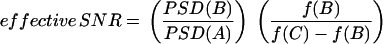
Molecular noise can yield stochastic resonance when a steady state (Vx = 0.75 min−1, Vy = 2 min−1) is close to a supercritical Hopf bifurcation (Vx = 0.78 min−1, Vy =2 min−1, Fig. 2 D1). (A) Time courses of CREB1 at Ω = 50, 100, and 1000. (B) Smoothed power spectrum density (PSD) versus frequency of stochastic oscillations at the values of Ω in A. The points A–C, with Ω = 100, illustrated in B, are used to compute the effective SNR (Eq. 13). (C) Effective SNR versus Ω. The existence of a peak at Ω = 100 demonstrates stochastic resonance.
Here, the three PSDs were first computed as in Fig. 10. However, it is not possible to use these noisy PSDs to quantitatively characterize the periodicity of the stochastic oscillations. Therefore, the procedure proposed by Hou and Xin (50) was used to characterize the periodicity of the stochastic time courses in Fig. 11 A. The PSDs were smoothed by replacing each original point with the value obtained by averaging over that point and the 50 closest original points. These smoothed PSDs are illustrated in Fig. 11 B. The PSD for Ω = 50 shows a weak but significant peak at a frequency of ∼0.06 h−1. The PSD for Ω = 100 shows a much sharper peak at about the same frequency. This peak illustrates that a significant oscillatory component is present in the Ω = 100 time course. In contrast, for very large Ω (1000), the PSD fails to show a peak, signifying that as deterministic dynamics are approached, the periodic oscillation component disappears, and only random fluctuations about the stable steady state persist. These PSDs illustrate stochastic resonance, with a strong oscillatory component for the dynamics of Ω = 100 in particular. An effective signal/noise ratio (SNR) can be defined by the following equation (50):
 |
(13) |
In Eq. 13, PSD(·) denotes the PSD level at a given point, and f(·) denotes the frequency at a given point. Point B corresponds to the maximum PSD, point A corresponds to the minimum PSD at the low-frequency side of point B, and point C is on the high-frequency side of point B and is determined by the condition PSD(C) = PSD(B)/e. This effective SNR characterizes the height of the peak in the PSD normalized by its relative width. As demonstrated in Fig. 11 C, there is a maximum in the SNR versus Ω curve in the vicinity of Ω = 100, which corresponds to an optimal system size for inducing internal stochastic resonance.
DISCUSSION
The minimal model is useful to delineate the dynamics of a putative gene regulatory motif involving interlocked positive and negative feedbacks
Different types of biochemical regulatory motifs (or minimal building blocks of biochemical circuitry), such as feedback and feedforward loops, have been suggested (51,52). The interlocked feedback loops of Fig. 1 represent a combination of minimal motifs, which can exhibit more complex behaviors than the individual components. For example, upon modulation of the relative strengths of positive and negative feedback (e.g., by manipulating the production rate of CREB1 activator or CREB2 repressor), the minimal model can exhibit complex behaviors, such as a bistable genetic toggle switch and oscillations of gene expression (Fig. 3).
The dynamic complexity arises from the nonlinear interplay of the different strengths of positive and negative feedback loops. Although one can construct a switch with just a single-gene positive feedback or double-negative feedbacks (52,53), and an oscillator with a single-gene negative feedback (54), it may be possible to use the CRE enhancer sequences and creb genes to construct a genetic circuit element that can transduce stimuli into multiple types of responses, manifesting both switch and oscillatory behaviors by modulating the relative strengths of the interlocked positive and negative feedbacks. Therefore, this interlocked positive and negative feedback circuit could act as a “multifunctional converter” in gene circuit design.
Interlocked positive and negative feedback loops play essential roles in determining system dynamics in various biological contexts. For example, positive and negative feedbacks of Cdc2-cyclin B and APC support oscillations in the cell cycle regulatory circuit (55); and positive and negative feedback associated with tumor suppressor protein p53 and Mdm2 may demonstrate bistability or oscillatory dynamics (56). Minimal models similar to that presented here, representing basic regulatory network structures, will be useful to systematically delineate complex behaviors of such biochemical architectures.
Deterministic bifurcation analysis and stochastic modeling provide complementary dynamic information
Simulations illustrated that a critical number of molecules is required to maintain a reproducible oscillation in the presence of molecular noise (e.g., Ω = 200, Fig. 10 C, average number of CREB1 ∼600). The model also exhibits stochastic resonance. Molecular noise can move a system from a stable steady state into an oscillatory regime, if the steady state is near a deterministic Hopf bifurcation point (Fig. 11). An optimal noise level was found to yield stochastic resonance with a sharply peaked power spectrum (Ω = 100) (Fig. 11 C).
In bistable regions of bifurcation diagrams (Figs. 2 A and 8 A), the system relaxes to either the HIGH or LOW state, and cannot transit between states unless forced by a large external perturbation. However, with molecular noise, molecules can flip between states, which leads to a bimodal probability density distribution of molecule numbers. Bimodal distributions have been experimentally validated in several biological systems (57–59).
Our investigation of the effect of stochastic noise on bistability illustrates how the deterministic bifurcation diagrams may be used to qualitatively determine the shape of bimodal distributions and the relative robustness of the stable states against molecular noise. By inspection of the bistable bifurcation diagram (e.g., Fig. 8 A), the relative distances from the threshold (middle unstable steady state) to the HIGH steady state versus the LOW steady state determine the shape of the bimodal probability density distribution. For example, if  <
<  (e.g., Fig. 8 A, inset, line C), the threshold is relatively lower for the CREB1 molecule numbers to fluctuate down from the HIGH state to the LOW state, as compared with fluctuating up from the LOW state to the HIGH state. Therefore, the CREB1 molecule number more commonly resides near the LOW state, which has the larger peak in the probability distribution (Fig. 8 C2) and the average FTT (LOW to HIGH) is larger than the average FTT (HIGH to LOW) (Fig. 9 A). On the contrary, if
  >
>  , the HIGH state is more robust and has a larger peak in the probability distribution (Fig. 8 F2).
This simple criterion, used alone, is only reliable if the distances of the two stable states from the unstable middle state are substantially different. For line D in Fig. 8 A, the HIGH state is only slightly, not substantially, farther from the threshold. Although for the probability distribution (Fig. 8 D), the peak for the HIGH state is lower, the area under the HIGH peak appears somewhat greater. In such a case, the average FTT (HIGH to LOW) and FTT (LOW to HIGH) at some Ω is further required to predict the shape of bimodal probability distribution, and to characterize the robustness of the HIGH and LOW states against molecular noise. For example, an approximately equal average FTT (HIGH to LOW) and FTT (LOW to HIGH) indicates an approximately identical area under the HIGH and LOW humps in the probability distribution.
Kummar et al. (60) recently proposed a measure to characterize the difference between deterministic and stochastic simulated behaviors. The divergence property (quantified by the sum of Liapunov exponents) of a stable or oscillating solution provides a measure of the robustness of the solution to molecular noise, with a more negative divergence corresponding to greater robustness. Applied to bistability, an equal divergence value of the HIGH and LOW states would indicate that the HIGH and LOW states have similar attractor properties, corresponding to similar areas below these peaks in the probability distribution. Therefore, this approach can provide a complementary method to predict the shape of a bimodal probability distribution in a region of bistability.
Further stochastic simulations illustrated that either increasing the strength of positive feedback (increasing Vx) or decreasing the strength of negative feedback (decreasing Vy) tends to increase the robustness and average lifetime of the HIGH state to molecular fluctuation. As discussed previously, such a state might correlate physiologically with prolonged gene induction by CREB1 and consequent establishment of long-term memory. For example, an average ∼1-h lifetime of the “memory” state with weak positive feedback (Vx = 0.18 min−1, Ω = 8) (Fig. 9 A) increases to ∼450 h given only a modest increase in positive feedback (Vx = 0.24 min−1, Ω = 8) (Fig. 9 B). Similarly, decreasing negative feedback by decreasing Vy from 0.06 min−1 to 0.01 min−1 increases the average lifetime of the memory state from ∼5 h to ∼40 h (Vx = 0.22 min−1, Ω = 10, data not shown). These results suggest that pharmacological interventions that vary the strength of positive and negative feedback may improve the formation of LTM, if long-lasting [CREB] elevation contributes to LTM. For example, negative feedback may be decreased by phosphorylation of CREB2 by MAPK (16). In addition, the putative positive feedback in which CREB1 activates its own gene requires phosphorylation of CREB1 (14), and MAPK activation following 5-HT exposure correlates with phosphorylation of CREB1 (61). These considerations suggest that pharmacological intervention enhancing and prolonging MAPK activation is likely to enhance CREB1 activation and the formation of LTM. A more detailed model of the dynamics of MAPK and CREB1 in Aplysia following 5-HT application has similarly predicted that prolongation of MAPK activation would enhance LTM (62).
In previous studies (62,63), we suggested an alternative positive feedback loop that might exhibit a bistable switch behavior contributing to the persistence of LTM. In this loop, PKA phosphorylates a transcription factor, thereby increasing the expression of an ubiquitin hydrolase (Ap-Uch). Ap-Uch then acts to increase PKA activity, closing the loop. Active PKA also phosphorylates CREB1. This phosphorylation is necessary for CREB1 to induce creb1 expression, thus sustaining the CREB1 positive feedback loop. Phosphorylated CREB1 may also induce creb2, thus sustaining the CREB2 negative feedback loop. Therefore, the feedback loops of CREBs examined in this study would be downstream effectors of the PKA/Ap-Uch feedback loop. In this way, all three feedback loops may contribute to the induction and persistence of CREB expression and LTM. Additional feedback loops may play a role in regulating CREB expression. Inducible cAMP early repressor (ICER) can bind to CREs and thereby repress the activity of its own expression, forming a negative feedback loop (18,64). In Aplysia, CREB1a (an isoform of CREB1) is the activator, whereas CREB1b (an alternatively spliced isoform of CREB1) is a repressor (15). CREB1b might form another negative feedback loop that interferes with the expression of CREBs. It would be of interest to incorporate these additional feedback loops into the minimal model, and investigate their interplay and the potential nonlinear dynamics. Given that increased CREB1 expression correlates with long-term synaptic facilitation (LTF), qualitative simulations of CREB1 dynamics with the minimal model are consistent with experiments that induce LTF with pulsed 5-HT applications (Fig. 6).
Although the minimal model has advantages in systematically investigating the potential nonlinear dynamics of feedback loops involving CREB proteins, a more detailed model of regulation by CREB proteins that integrates data concerning CREB activation by signaling pathways is needed. With the accumulation of experimental data on the dynamics of kinases and genes that regulate CREB activation and expression, it is feasible to add these details to the minimal model. A detailed model will help establish a more quantitative understanding of the mechanisms that underlie the induction and persistence of LTM. Design of experimental protocols to enhance LTM, and development of more effective treatments for memory disorders (5), could benefit as a result.
SUPPLEMENTARY MATERIAL
An online supplement to this article can be found by visiting BJ Online at http://www.biophysj.org.
Acknowledgments
This work was supported by National Institutes of Health grants P01 NS38310 and R01 NS50532.
References
- 1.Shaywitz, A. J., and M. E. Greenberg. 1999. CREB: A stimulus-induced transcription factor activated by a diverse array of extracellular signals. Annu. Rev. Biochem. 68:821–861. [DOI] [PubMed] [Google Scholar]
- 2.Frank, D. A., and M. E. Greenberg. 1994. CREB: a mediator of long-term memory from molluscs to mammals. Cell. 79:5–8. [DOI] [PubMed] [Google Scholar]
- 3.Kandel, E. R. 2001. The molecular biology of memory storage: a dialogue between genes and synapses. Science. 294:1030–1038. [DOI] [PubMed] [Google Scholar]
- 4.Silva, A. J., J. H. Kogan, P. W. Frankland, and S. Kida. 1998. CREB and memory. Annu. Rev. Neurosci. 21:127–148. [DOI] [PubMed] [Google Scholar]
- 5.Tully, T., R. Bourtchouladze, R. Scott, and J. Tallman. 2003. Targeting the CREB pathway for memory enhancers. Nat. Rev. Drug Discov. 2:267–277. [DOI] [PubMed] [Google Scholar]
- 6.von Gall, D., G. E. Duffield, M. H. Hastings, M. D. A. Kopp, F. Dehghani, H.-W. Korf, and J. H. Stehl. 1998. CREB in the mouse SCN: a molecular interface coding the phase-adjusting stimuli light, glutamate, PACAP, and melatonin for clockwork access. J. Neurosci. 18:10389–10397. [DOI] [PMC free article] [PubMed] [Google Scholar]
- 7.Travnickova-Bendova, Z., N. Cermakian, S. M. Reppert, and P. Sassone-Corsi. 2002. Bimodal regulation of mPeriod promoters by CREB-dependent signaling and CLOCK/BMAL1 activity. Proc. Natl. Acad. Sci. USA. 99:7728–7733. [DOI] [PMC free article] [PubMed] [Google Scholar]
- 8.Tischkau, S. A., J. W. Mitchell, S.-H. Tyan, G. F. Buchanan, and M. U. Gillette. 2003. Ca2+/cAMP response element-binding protein (CREB)-dependent activation of Per1 is required for light-induced signaling in the suprachiasmatic nucleus circadian clock. J. Biol. Chem. 278:718–723. [DOI] [PubMed] [Google Scholar]
- 9.Lonze, B. E., A. Riccio, S. Cohen, and D. D. Ginty. 2002. Apoptosis, axonal growth defects, and degeneration of peripheral neurons in mice lacking CREB. Neuron. 34:371–385. [DOI] [PubMed] [Google Scholar]
- 10.Carlzon, W. A., Jr., R. S. Duman, and E. J. Nestler. 2005. The many faces of CREB. Trends Neurosci. 28:436–445. [DOI] [PubMed] [Google Scholar]
- 11.Hanson, R. W., and L. Reshef. 1997. Regulation of phosphoenolpyruvate carboxykinase (GTP) gene expression. Annu. Rev. Biochem. 66:581–611. [DOI] [PubMed] [Google Scholar]
- 12.Walker, W. H., L. Fucci, and J. F. Habener. 1995. Expression of gene encoding transcription factor cyclic adenosine 3′,5′-monophosphate (cAMP) response element – binding protein (CREB): regulation by follicle stimulating hormone-induced cAMP signaling in primary rat sertoli cells. Endocrinology. 136:3534–3545. [DOI] [PubMed] [Google Scholar]
- 13.Lonze, B. E., and D. D. Ginty. 2002. Function and regulation of CREB family transcription factors in the nervous system. Neuron. 35:605–623. [DOI] [PubMed] [Google Scholar]
- 14.Mohamed, H. A., W. Yao, D. Fioravante, P. D. Smolen, and J. H. Byrne. 2005. cAMP-response elements in Aplysia creb1, creb2, and Ap-uch promoters. J. Biol. Chem. 280:27035–27043. [DOI] [PubMed] [Google Scholar]
- 15.Bartsch, D., A. Casadio, K. A. Karl, P. Serochio, and E. R. Kandel. 1998. CREB1 encodes a nuclear activator, a repressor, and a cytoplasmic modulator that form a regulatory unit critical for long-term facilitation. Cell. 95:211–223. [DOI] [PubMed] [Google Scholar]
- 16.Bartsch, D., M. Ghirardi, P. A. Skehel, K. A. Karl, S. P. Herder, M. Chen, C. H. Bailey, and E. R. Kandel. 1995. Aplysia CREB2 represses long-term facilitation: relief of repression converts transient facilitation into long-term functional and structure change. Cell. 83:979–992. [DOI] [PubMed] [Google Scholar]
- 17.Abel, T., K. C. Martin, D. Bartsch, and E. R. Kandel. 1998. Memory suppressor genes: inhibiting constraints on the storage of long-term memory. Science. 279:338–341. [DOI] [PubMed] [Google Scholar]
- 18.Meyer, T., G. Waeber, J. Lin, W. Beckmann, and J. Habener. 1993. The promoter of the gene encoding cAMP response element binding protein contains cAMP response elements: evidence for positive autoregulation of gene transcription. Endocrinology. 132:770–780. [DOI] [PubMed] [Google Scholar]
- 19.Bourtchuladze, R., B. Frenguelli, J. Blendy, D. Cioffi, G. Schutz, and A. J. Silva. 1994. Deficient long-term memory in mice with a targeted mutation of the cAMP-responsive element-binding protein. Cell. 79:59–68. [DOI] [PubMed] [Google Scholar]
- 20.Impey, S., M. Mark, E. C. Villacres, S. Poser, C. Chavkin, and D. R. Storm. 1996. Induction of CRE-medicated gene expression by stimuli that generate long-lasting LTP in area CA1 of the hippocampus. Neuron. 16:973–982. [DOI] [PubMed] [Google Scholar]
- 21.Pettenger, C., Y. Y. Huang, R. F. Paletzki, R. Bourtchouladze, H. Scanlin, S. Vronskaya, and E. R. Kandel. 2002. Reversible inhibition of CREB/ATF transcription factors in region CA1 of the dorsal hippocampus disrupts hippocampus-dependent spatial memory. Neuron. 34:447–462. [DOI] [PubMed] [Google Scholar]
- 22.Chen, A., I. A. Muzzio, G. Malleret, D. Bartsch, M. Verbitsky, P. Pavlidis, A. L. Yonan, S. Vronskaya, M. B. Grody, I. Cepeda, T. C. Gilliam, and E. R. Kandel. 2003. Inducible enhancement of memory storage and synaptic plasticity in transgenic mice expressing an inhibitor of ATF4 (CREB-2) and C/EBP protein. Neuron. 39:655–669. [DOI] [PubMed] [Google Scholar]
- 23.Brandman, O., J. E. Ferrell, Jr., R. Li, and T. Meyer. 2005. Interlinked fast and slow positive feedback loops drive reliable cell decisions. Science. 310:496–498. [DOI] [PMC free article] [PubMed] [Google Scholar]
- 24.Goldbeter, A. 1991. A minimal cascade model for the mitotic oscillator involving cyclin and Cdc2 kinase. Proc. Natl. Acad. Sci. USA. 88:9107–9111. [DOI] [PMC free article] [PubMed] [Google Scholar]
- 25.Smolen, P., D. A. Baxter, and J. H. Byrne. 1998. Frequency selectivity, multiplicity, and oscillations emerge from models of genetic regulatory systems. Am. J. Physiol. Cell Physiol. 274:C531–C542. [DOI] [PubMed] [Google Scholar]
- 26.Wall, M. E., W. S. Hlavacek, and M. A. Savageau. 2003. Design principles for regulator gene expression in a repressible gene circuit. J. Mol. Biol. 332:861–876. [DOI] [PubMed] [Google Scholar]
- 27.Buchler, N. E., U. Gerland, and T. Hwa. 2005. Nonlinear protein degradation and function of genetic circuits. Proc. Natl. Acad. Sci. USA. 102:9559–9564. [DOI] [PMC free article] [PubMed] [Google Scholar]
- 28.Guantes, R., and J. F. Poyatos. 2006. Dynamic principles of two-component genetic oscillators. PLoS Comput. Biol. 2:188–197. [DOI] [PMC free article] [PubMed] [Google Scholar]
- 29.Smolen, P., D. A. Baxter, and J. H. Byrne. 1999. Effects of macromolecular transport and stochastic fluctuations on dynamics of genetic regulatory systems. Am. J. Physiol. Cell Physiol. 277:C777–C790. [DOI] [PubMed] [Google Scholar]
- 30.Smolen, P., D. A. Baxter, and J. H. Byrne. 2002. A reduced model clarifies the role of feedback loops and time delays in the Drosophila circadian oscillator. Biophys. J. 83:2349–2359. [DOI] [PMC free article] [PubMed] [Google Scholar]
- 31.Lewis, J. 2003. Autoinhibition with transcriptional delay: a simple mechanism for the zebrafish somitogenesis oscillator. Curr. Biol. 13:1398–1408. [DOI] [PubMed] [Google Scholar]
- 32.Ma, L., J. Wagner, J. J. Rice, W. Hu, A. J. Levine, and G. A. Stolovitzky. 2005. A plausible model for the digital response of p53 to DNA damage. Proc. Natl. Acad. Sci. USA. 102:14266–14271. [DOI] [PMC free article] [PubMed] [Google Scholar]
- 33.Wagatsuma, A., H. Sadamoto, T. Kitahashi, K. Lukowiak, A. Urano, and E. Ito. 2005. Determination of the exact copy numbers of particular mRNAs in a single cell by quantitative real-time RT-PCR. J. Exp. Biol. 208:2389–2398. [DOI] [PubMed] [Google Scholar]
- 34.Gillespie, D. T. 1977. Exact stochastic simulation of coupled chemical reactions. J. Phys. Chem. 81:2340–2361. [Google Scholar]
- 35.Gonze, D., J. Halloy, and A. Goldbeter. 2002. Deterministic versus stochastic models for circadian rhythms. J. Biol. Phys. 28:637–653. [DOI] [PMC free article] [PubMed] [Google Scholar]
- 36.Gonze, D., J. Halloy, J.-L. Leloup, and A. Goldbeter. 2003. Stochastic models for circadian rhythms: effect of molecular noise on periodic and chaotic behavior. C. R. Biologies. 326:189–203. [DOI] [PubMed] [Google Scholar]
- 37.Gonze, D., and A. Goldbeter. 2006. Circadian rhythms and molecular noise. Chaos. 16:026110–026120. [DOI] [PubMed] [Google Scholar]
- 38.Ermentrout, B. 2002. Simulating, Analyzing, and Animating Dynamical Systems: A Guide to XPPAUT for Researchers and Students. SIAM, Philadelphia.
- 39.Shampine, L. F., and S. Thompson. 2001. Solving DDEs in Matlab. Appl. Numer. Math. 37:441–458. [Google Scholar]
- 40.Mauelshagen, J., G. R. Parker, and T. J. Carew. 1996. Dynamics of induction and expression of long-term synaptic facilitation in Aplysia. J. Neurosci. 16:7099–7108. [DOI] [PMC free article] [PubMed] [Google Scholar]
- 41.Karn, M., T. C. Elston, W. J. Blake, and J. J. Collins. 2005. Stochasticity in gene expression: From theories to phenotypes. Nat. Rev. Genet. 6:451–464. [DOI] [PubMed] [Google Scholar]
- 42.Paulsson, J. 2004. Summing up the noise in gene networks. Nature. 427:415–418. [DOI] [PubMed] [Google Scholar]
- 43.Rao, C., D. M. Wolf, and A. P. Arkin. 2002. Control, exploitation and tolerance of intracellular noise. Nature. 420:231–237. [DOI] [PubMed] [Google Scholar]
- 44.Guanwan, R., Y. Cao, L. Petzold, and F. J. Doyle III. 2005. Sensitivity analysis of discrete stochastic systems. Biophys. J. 88:2530–2540. [DOI] [PMC free article] [PubMed] [Google Scholar]
- 45.Erban, R., I. G. Kevrekidis, D. Adalsteinsson, and T. C. Elston. 2006. Gene regulatory networks: a coarse-grained, equation-free approach to multiscale computation. J. Chem. Phys. 124:084106. [DOI] [PubMed] [Google Scholar]
- 46.Lai, K., J. Robertson, and D. Schaffer. 2004. The sonic hedgehog signaling system as a bistable genetic switch. Biophys. J. 86:2748–2757. [DOI] [PMC free article] [PubMed] [Google Scholar]
- 47.Miller, P., A. M. Zhabotinsky, J. E. Lisman, and X.-J. Wang. 2005. The stability of a stochastic CaMKII switch: dependence on the number of enzyme molecules and protein turnover. PLoS Biol. 3:705–717. [DOI] [PMC free article] [PubMed] [Google Scholar]
- 48.Bialek, W. 2001. Stability and noise in biochemical switches. In Advances in Neural Information Processing. T. K. Leen, T. G. Dietterich, and V. Tresp, editors. MIT Press, Cambridge.
- 49.Vilar, J. M. G., J. Y. Kueh, N. Barkai, and S. Leibler. 2002. Mechanisms of noise-resistence in genetic oscillators. Proc. Natl. Acad. Sci. USA. 99:5988–5992. [DOI] [PMC free article] [PubMed] [Google Scholar]
- 50.Hou, Z., and H. Xin. 2003. Internal noise stochastic resonance in a circadian clock system. J. Chem. Phys. 119:11508–11512. [Google Scholar]
- 51.Yeger-Lotem, E., S. Sattath, N. Kashtan, S. Itzkovitz, R. Milo, R. Y. Pinter, U. Alon, and H. Margalit. 2004. Network motifs in integrated cellular networks of transcription-regulation and protein-protein interaction. Proc. Natl. Acad. Sci. USA. 101:5934–5939. [DOI] [PMC free article] [PubMed] [Google Scholar]
- 52.Wolf, D., and A. P. Arkin. 2003. Motifs, modules and games in bacteria. Curr. Opin. Microbiol. 6:125–134. [DOI] [PubMed] [Google Scholar]
- 53.Ferrell, J. E., Jr. 2002. Self-perpetuating states in signal transduction: positive feedback, double-negative feedback and bistability. Curr. Opin. Cell Biol. 14:140–148. [DOI] [PubMed] [Google Scholar]
- 54.Tyson, J. J., K. C. Chen, and B. Novak. 2003. Sniffers, buzzers, toggles and blinkers: dynamics of regulatory and signaling pathways in the cell. Curr. Opin. Cell Biol. 15:221–231. [DOI] [PubMed] [Google Scholar]
- 55.Pomerening, J. R., E. D. Sontag, and J. E. Ferrell. 2003. Building a cell cycle oscillator: hysteresis and bistability in the activation of Cdc2. Nat. Cell Biol. 5:346–351. [DOI] [PubMed] [Google Scholar]
- 56.Geva-Zatorsky, N., N. Rosenfeld, S. Itzkovitz, R. Milo, A. Sigal, E. Dekel, T. Yarnitzky, Y. Liron, P. Polak, G. Lahav, and U. Alon. 2006. Oscillations and variability in the p53 system. Mol. Syst. Biol. 2:E1–E13. [DOI] [PMC free article] [PubMed] [Google Scholar]
- 57.Acar, M., A. Becskei, and A. van Oudenaarden. 2005. Enhancement of cellular memory by reducing stochastic transitions. Nature. 435:228–232. [DOI] [PubMed] [Google Scholar]
- 58.Ozbudak, E. M., M. Thattai, H. N. Lim, B. I. Shraiman, and A. van Oudenaarden. 2004. Multistability in the lactose utilization network of Escherichia coli. Nature. 427:737–740. [DOI] [PubMed] [Google Scholar]
- 59.Kobayashi, H., M. Karn, M. Araki, K. Chung, T. S. Gardner, C. R. Cantor, and J. J. Collins. 2004. Programmable cells: interfacing natural and engineered gene networks. Proc. Natl. Acad. Sci. USA. 101:8414–8419. [DOI] [PMC free article] [PubMed] [Google Scholar]
- 60.Kummer, U., B. Krajnc, J. Pahle, A. K. Green, C. J. Dixon, and M. Marhl. 2005. Transition from stochastic to deterministic behavior in calcium oscillations. Biophys. J. 89:1603–1611. [DOI] [PMC free article] [PubMed] [Google Scholar]
- 61.Michael, D., K. C. Martin, R. Seger, M. M. Ning, R. Baston, and E. R. Kandel. 1998. Repeated pulses of serotonin required for long-term facilitation activate mitogen-activated protein kinase in sensory neurons of Aplysia. Proc. Natl. Acad. Sci. USA. 95:1864–1869. [DOI] [PMC free article] [PubMed] [Google Scholar]
- 62.Pettigrew, D. B., P. Smolen, D. A. Baxter, and J. H. Byrne. 2005. Dynamic properties of regulatory motifs associated with induction of three temporal domains of memory in Aplysia. J. Comput. Neurosci. 18:163–181. [DOI] [PubMed] [Google Scholar]
- 63.Song, H., P. Smolen, E. Av-Ron, D. A. Baxter, and J. H. Byrne. 2006. Bifurcation and singularity analysis of a molecular network for the induction of long-term memory. Biophys. J. 90:2309–2325. [DOI] [PMC free article] [PubMed] [Google Scholar]
- 64.Molina, C. A., N. S. Foulkes, F. Lalli, and P. Sassone-Corsi. 1993. Inducibility and negative autoregulation of CREM: an alternative promoter directs the expression of ICER, an early response repressor. Cell. 75:875–886. [DOI] [PubMed] [Google Scholar]