

Abstract
BACKGROUND
Hispanics in the United States have a 33% lower age-adjusted incidence of cancer and a 38% lower cancer mortality rate compared with non-Hispanic whites. This may be secondary to health behaviors that vary with residential and economic assimilation. The authors investigated whether cancer incidence among Hispanics increased with residential and economic assimilation into mainstream culture.
METHODS
Data from the Surveillance, Epidemiology, and End Results program (SEER) and the U.S. Census Bureau were used to compare cancer incidence rates and rate ratios as a function of percentage of Hispanics and income of Hispanics in a census tract. Type of cancer was identified with a site recode variable in the SEER data set. Cases with in situ prostate and cervical carcinoma were excluded. Hispanic ethnicity in SEER was identified by medical record review and Hispanic surname lists. The study also used income of Hispanics living in the census tract, age at diagnosis, and stratification by gender.
RESULTS
The incidence of breast, colorectal, and lung carcinoma among Hispanics increased as the percentage of Hispanics in the census tract decreased and as tract Hispanic income increased. For example, there was a 39% reduction in breast carcinoma and a 38% reduction in male colorectal carcinoma when the Hispanic population in high-density Hispanic neighborhoods in the lowest income quartile was contrasted to Hispanics living in tracts with the lowest total percentage of Hispanics in the highest income quartile.
CONCLUSIONS
The lower cancer rates among Hispanics relative to non-Hispanic whites in the United States may dissipate as Hispanics become more assimilated into the mainstream society.
Keywords: acculturation, Hispanic, immigrants, spatial distribution, Surveillance, Epidemiology, and End Results program
Cancer is the second leading cause of death in the developed world.1 The etiology of most cancers is multifactorial, involving genetic and environmental influences.2–4 Doll and Peto5 have estimated that ≤ 80% of the cancer burden is secondary to environmental causes, such as tobacco use, diet, exercise, and exposure to environmental toxins.4–9
One of the clearest indications of the social and lifestyle components of cancer risk is the shift of cancer incidence rates in immigrant populations from the profile characteristic of country of origin to the profile of the destination country.10–12 Acculturation to the lifestyles of the destination country involves changes in diet and other aspects of lifestyle that are associated with cancers of particular sites, leading to these changes in site-specific cancer profiles after immigration.
Hispanics now represent the largest minority population in the United States, comprising 12.5% of the population.13 This population is heterogeneous, comprising 58.5% Mexican Americans, 9.6% Puerto Ricans, 3.5% Cu-bans, 8.6% other Latin Americans, and the remaining reporting other or no specific country of origin.13 The Hispanic population is heterogeneous racially, comprising Native American, European, and African components.
Hispanics in the United States have a substantially lower incidence of and mortality from cancer compared with non-Hispanic whites.14,15 For all cancers, excluding nonmelanoma skin carcinomas, the age-adjusted incidence per 100,000 persons was 352 for Hispanics versus 490 for non-Hispanic whites, whereas the cancer mortality statistic was 138 for Hispanics versus 202 for non-Hispanic whites.14 Hispanics have lower incidence and mortality rates for cancers of the sites that account for most cancer mortality, including lung, prostate, colorectal, and the female breast carcinoma. Hispanics have higher rates of incidence and mortality than non-Hispanic whites for stomach, liver, gallbladder, and cervical carcinomas.14,15 The 32% reduction in cancer mortality among Hispanics compared with non-Hispanic whites is a contributor to the so-called “Hispanic paradox,” in which many health indicators for U.S. Hispanics are comparable to or better than those for non-Hispanics whites, even though this population is substantially disadvantaged in income, education, and access to medical care.16–18
The reasons for the Hispanic advantage in cancer mortality have only begun to receive systematic attention in the past decade.15,19 Cancer mortality rates are lower for Hispanic immigrants compared with His-panics born in the United States.17,20 This pattern suggests that a portion of the Hispanic cancer advantage may be explained by differences in risk profiles that change with acculturation. These changes include increases in smoking,20,21,22 obesity,20,23 alcohol consumption,22,24,25 and decreases in dietary quality22,24,26 and physical activity.27
In the current study, we investigate the Hispanic cancer advantage by examining the spatial distribution of lung, colorectal, prostate, female breast, and cervical carcinomas with respect to two dimensions of neighborhood context: the percentage of neighborhood residents who are Hispanic and the per capita income of the neighborhood’s Hispanic population.
If the relatively low cancer rates in U.S. Hispanic populations are secondary to lifestyles and health behaviors typical of the country of origin for Hispanic migrants, cancer rates among Hispanic Americans will more closely approximate those of non-Hispanic whites as the Hispanic population becomes more assimilated into the majority society. One way to investigate this hypothesis is to examine variation in cancer rates among Hispanics as a function of the percentage of Hispanics in the neighborhood environment. The density of an ethnic population in a neighborhood is tied closely to the maintenance of cultural patterns versus assimilation into the mainstream culture.28–30
We also investigate cancer incidence in relation to the per capita income of Hispanics living in the census tract. A recent National Cancer Institute (NCI) study using Surveillance, Epidemiology, and End Results (SEER) program data reported a pattern of higher incidence for lung, colon and rectum, prostate, and female breast carcinomas, as well as a lower incidence of cervical carcinoma for Hispanics in relation to increasing income of census tract residents.31 This pattern may confound the relation between tract percent Hispanic (TpH) and cancer incidence, because the Hispanic population follows a well documented pattern of spatial assimilation in which more educated and middle-class Hispanics are more likely than less educated and poorer Hispanics to live in neighborhoods where they are integrated with non-Hispanic whites.32
MATERIALS AND METHODS
Overview
The current study was a descriptive study of cancer incidence. Data from the SEER registry and the U.S. Census Bureau were used to estimate age-adjusted cancer incidence rates. Poisson regression models generated incidence rate ratios (RRs) to compare census tracts with different concentrations of Hispanics and income of Hispanics in the census tract, with adjustment for age and gender.
Source of Data
SEER tumor registry data33 were used to identify incident cancer cases. The 1996 submission of the SEER Public Use file was used to obtain incident cancer cases for breast, colorectal, lung, non-in situ prostate, and non-in situ cervical carcinomas among Hispanics. This older submission was used because these data include the census tracts of subjects. The 9 SEER areas (Connecticut, Iowa, New Mexico, Utah, Hawaii, Detroit, Atlanta, San Francisco-Oakland, and Seattle-Puget Sound) covered approximately 9.5% of the U.S. population during the years of study (i.e., 1988–1992). Use of the SEER Public Use file was approved by the institutional review board of the University of Texas Medical Branch (Galveston, TX).
Data from the Bureau of the Census were used to estimate the population from which the cancer cases were derived. Census data for 1990 were used to estimate the denominators for the incidence rates. The summary tape file 1A (STF 1A) data for the states covering the SEER areas contained population counts for the various Hispanic age and gender groups.34 STF 3A was used to classify tracts with respect to the per capita income of their Hispanic population.35 These files contained frequency counts at many geographic levels, including the census tract.
Study Cases
Eligible cancer cases were Hispanics living in a SEER area with an incident breast, colorectal, lung, non-in situ prostate, or non-in situ cervical carcinoma diagnosis from 1988 to 1992. These individuals constituted the numerators for the cancer incidence rates. There were 8970 Hispanics diagnosed during the years of study in these SEER areas. Of these cases, 8291 had either a 1990 census tract number or a 1980 tract that could be mapped to the 1990 census data.
For the remaining 679 cases, the county of residence was always available. Census tract was more likely to be missing for cases in nonmetropolitan counties with large Hispanic populations. To avoid biasing results by excluding these cases, we assigned them to census tract contexts using a multiple imputation procedure. Each case was assigned randomly to a census tract within its county, with probability proportional to the size of the county’s Hispanic population of the same age and gender. This step was completed five times, creating five imputed data sets. Reported incidence rates and RRs are the mean of the results using numerators from the five imputations.36,37
The denominator for the cancer incidence rates is the population from which eligible cancer cases are derived. In the current study, Hispanic cases living in one of the 9 SEER areas during 1988–1992 who were not prevalent cancer cases made up the denominators for the incidence rates. The cancer incidence was centered around 1990, a decennial census year, so multiplying the 1990 mid-year population of Hispanic cases living in a SEER area in 1990 by 5 estimated the total person-years for the denominator. Prevalent cancer cases diagnosed before 1988 who were still alive on April 1, 1990 — census day—were excluded from the denominator for the specific cancer for which they were prevalent.
Measures
In the SEER registry, Hispanic ethnicity is identified by a combination of medical record review and matching surnames against lists of Hispanic surnames.38 Also defined at the patient level in this data set are age at diagnosis (0–4, 5–9, . . ., 80–84, and ≥ 85 years) and gender. The type of cancer was determined by the site recode variable in the SEER data set. The SEER historic stage variable was used to determine whether cases had prostate and cervical carcinoma of the in situ type, and thus were excluded from the numerator of the incidence rates.
In the census denominator data, age × gender × ethnicity (Hispanic vs. non-Hispanic) specific counts are available at the census tract level. The percentage of the population of the census tract that was Hispanic, or TpH, was determined at the census tract level. TpH was calculated as the total number of Hispanic cases in the tract divided by the total population (Hispanic cases and non-Hispanic cases) in the census tract. Because TpH was highly skewed, it was grouped as < 20%, 20 to < 60%, and ≥ 60% Hispanic.
The measure of socioeconomic status was based on the per capita income in 1989 of the Hispanic households of each census tract. Per capita income was expressed as a ratio to the 1989 fair market rent estimated for the market area by the U.S. Department of Housing and Urban Development to adjust for differences in cost of living in different SEER areas.39–41 The resulting measure was grouped into quartiles of the Hispanic population living in SEER registry areas.
Contingency tables were generated for the age-gender-TpH-income groups for both the numerator (incident cases) and denominator (population from which these cases were derived). Dividing the corresponding numerators by their denominators yielded the age, gender, income, and TpH-specific incidence rates that were used for analysis. This was done for each type of cancer separately.
Statistical Methods
The unit of analysis was the gender × age × TpH × tract Hispanic income group incidence rate. These rates were compared using Poisson regression. Models were estimated on each of the five imputed data sets using the Genmod procedure in SAS Version 9.0 software (SAS, Cary, NC),42 and incidence RRs and 95% confidence intervals (95% CIs) were estimated by pooling the results using the SAS Mianalyze procedure.36,37,42 Incidence RRs are reported from separate models with age adjustment only for the three TpH categories and for the Hispanic income quartiles. We also report RRs for a multivariable model in which TpH and Hispanic income quartiles are both controlled. In the multivariable models, we used an F test to determine the significance of interactions between TpH and tract Hispanic income quartile, and report the RRs when the contribution of the set was significant (P < 0.05).
Role of the Funding Source
The NCI, which funded the current study, also maintains the SEER cancer registry. NCI personnel had no role in the design and analysis of the study.
RESULTS
In 1990, the total population of the SEER areas was 23,553,609, of whom 1,726,284 (7.3%) were identified as Hispanic. There were 5725 census tracts in the SEER areas. Figure 1 shows the distribution of the Hispanic population of SEER to census tract contexts defined by the intersection of the income quartiles and TpH categories used in the analysis. There is an association between these 2 measures (gamma = 0.35). Tracts for which < 20% of the tract’s population is Hispanic also tend to be areas where the Hispanic population has income above the median for the Hispanic population. The reverse is true of Hispanics living in tracts with a higher concentration of Hispanics.
FIGURE 1.
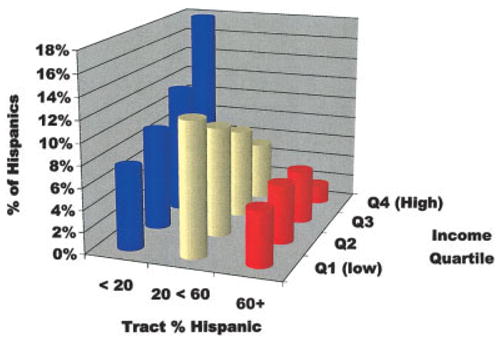
Distribution of the total Hispanic population among the census tracts in the nine Surveillance, Epidemiology, and End Results registry areas by tract percent Hispanic and Hispanic income quartile.
Table 1 shows age-adjusted incidence rates for Hispanic income quartile and TpH categories. The incidence of lung, colorectal, and female breast carcinoma all decrease as the percentages of Hispanics in the census tracts increase. The incidence of cervical carcinoma increases with TpH. There is no trend apparent in the incidence of prostate carcinoma by TpH. There is also a positive gradient linking higher income with higher incidence of male and female colorectal, female breast, and prostate carcinomas. There is a weaker relation between tract Hispanic income and incidence of male lung carcinomas, and no apparent association between income and female lung carcinoma. The incidence of cervical carcinoma decreases sharply with increasing tract Hispanic income.
TABLE 1.
Incidence Rates for Five Common Cancers for Hispanics living in SEER Registry Areas, 1988–1992, by TpH and Income of Tract Hispanic Populationa
| Income quartile | Lung carcinoma (male) | Lung carcinoma (female) | Colorectal carcinoma (male) | Colorectal carcinoma (female) | Breast carcinoma (female) | Prostate carcinoma | Cervical carcinoma |
|---|---|---|---|---|---|---|---|
| Income Q1 (low) | 54.73 | 30.12 | 49.08 | 35.02 | 84.91 | 111.99 | 21.10 |
| Income Q2 | 52.39 | 25.15 | 54.23 | 34.39 | 91.71 | 119.87 | 16.27 |
| Income Q3 | 52.35 | 28.28 | 57.67 | 41.83 | 98.36 | 132.62 | 13.81 |
| Income Q4 (high) | 61.31 | 28.22 | 62.52 | 40.10 | 113.87 | 151.57 | 10.81 |
| All income groups | |||||||
| TpH < 20% | 64.57 | 32.01 | 60.77 | 40.09 | 106.75 | 127.47 | 13.41 |
| TpH 20% < 60% | 49.02 | 24.53 | 56.28 | 37.27 | 94.85 | 133.57 | 15.68 |
| TpH ≥ 60% | 46.95 | 24.04 | 49.08 | 35.96 | 86.80 | 127.57 | 18.03 |
| Income Q1 (low) | |||||||
| TpH < 20% | 65.93 | 32.51 | 50.94 | 39.84 | 95.28 | 115.36 | 17.01 |
| TpH 20% < 60% | 48.62 | 31.54 | 52.85 | 30.39 | 84.32 | 121.13 | 18.01 |
| TpH ≥ 60% | 50.62 | 22.85 | 39.66 | 35.66 | 74.46 | 94.60 | 32.16 |
| Income Q2 | |||||||
| TpH < 20% | 51.31 | 27.46 | 49.75 | 37.51 | 94.08 | 113.31 | 15.87 |
| TpH 20% < 60% | 56.88 | 24.87 | 57.18 | 31.68 | 91.87 | 120.05 | 18.74 |
| TpH ≥ 60% | 45.02 | 22.75 | 53.94 | 32.06 | 89.90 | 125.34 | 11.57 |
| Income Q3 | |||||||
| TpH < 20% | 63.27 | 32.97 | 63.81 | 40.50 | 105.24 | 117.39 | 14.44 |
| TpH 20% < 60% | 46.41 | 22.08 | 53.35 | 44.13 | 93.95 | 133.12 | 12.65 |
| TpH ≥ 60% | 43.41 | 26.52 | 55.77 | 41.78 | 94.73 | 149.23 | 12.00 |
| Income Q4 (high) | |||||||
| TpH < 20% | 71.98 | 33.16 | 67.71 | 41.06 | 115.79 | 146.63 | 10.40 |
| TpH 20% < 60% | 36.83 | 15.47 | 64.71 | 42.66 | 119.02 | 172.22 | 10.79 |
| TpH ≥ 60% | 49.73 | 15.25 | 35.21 | 27.98 | 84.05 | 125.27 | 7.41 |
SEER: Surveillance, Epidemiology, and End Results program; TpH: tract percent Hispanic; Q: quartile.
Age-adjusted incidence rates (/100,000) were directly standardized using the U.S. 2000 population standard.
The incidence rates when the ethnic and income characteristics of the tract are considered jointly are also shown in Table 1 and Figure 2. For lung carcinoma, the most evident contrast for both men and women is between the higher incidence rates in tracts where < 20% of the tract’ population is Hispanic and the lower incidence rates in all other areas. For colorectal and female breast carcinomas, the Hispanic residents of low TpH/high income tracts have the highest incidence rates, whereas the lowest rates are generally found in tracts with low income and a large percentage of Hispanics. Patterns for prostate carcinoma are less clear. The incidence of cervical carcinoma is strikingly higher in tracts with income in the lowest quartile and with Hispanics making up > 60% of the tract population.
FIGURE 2.
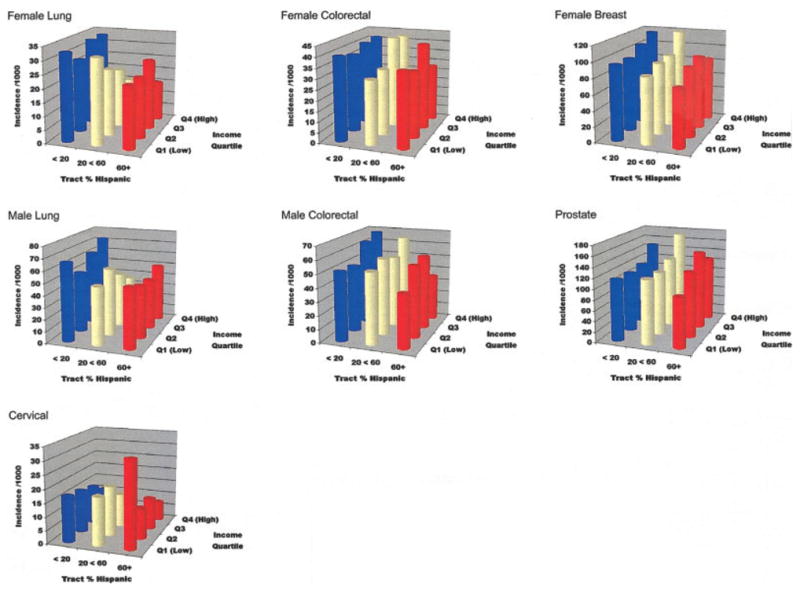
Incidence rates (per 100,000) of 5 common cancers in Hispanics, as a function of the percentage of Hispanics comprising the census tract and Hispanic income quartile. Data are the incidence rates reported in Table 1. Age-adjusted incidence rates (per 100,000) were directly standardized using the U.S. 2000 population standard.
Table 2 shows RRs and 95% CIs corresponding to the incidence rates in Table 1. The lower age-adjusted RRs in higher TpH areas are statistically significant for male and female lung, female breast, and male colorectal carcinomas. The gradient increase in cancer incidence in higher-income tracts is generally statistically significant for male and female colorectal carcinomas, as well as for prostate and female breast carcinomas. The incidence of cervical carcinoma declines sharply and significantly with increasing income.
TABLE 2.
Age-Adjusted Incidence Rate Ratios and 95% Confidence Intervals for Five Common Cancers by Percent Hispanics in Census Tract and Hispanic Income Quartilea
| Tract context | Lung carcinoma (male) | Lung carcinoma (female) | Colorectal carcinoma (male) | Colorectal carcinoma (female) | Breast carcinoma (female) | Tract context | Prostate carcinoma | Cervical carcinoma |
|---|---|---|---|---|---|---|---|---|
| Age adjusted | ||||||||
| Income Q1 (low) | 1.00 | 1.00 | 1.00 | 1.00 | 1.00 | Income Q1 (low) | 1.00 | 1.00 |
| Income Q2 | 0.91 (0.75, 1.11) | 0.84 (0.67, 1.07) | 1.18 (0.97, 1.44) | 1.05 (0.85, 1.30) | 1.15 (1.01, 1.30) | Income Q2 | 1.10 (0.95, 1.26) | 0.76 (0.59, 0.98) |
| Income Q3 | 0.98 (0.81, 1.19) | 0.98 (0.78, 1.23) | 1.28 (1.06, 1.55) | 1.26 (1.04, 1.54) | 1.24 (1.08, 1.41) | Income Q3 | 1.26 (1.10, 1.43) | 0.67 (0.52, 0.87) |
| Income Q4 (high) | 1.09 (0.92, 1.31) | 0.94 (0.74, 1.20) | 1.42 (1.17, 1.74) | 1.27 (1.03, 1.55) | 1.48 (1.31, 1.67) | Income Q4 (high) | 1.37 (1.20, 1.56) | 0.56 (0.43, 0.74) |
| TpH < 20% | 1.00 | 1.00 | 1.00 | 1.00 | 1.00 | TpH < 20% | 1.00 | 1.00 |
| TpH 20 < 60% | 0.76 (0.66, 0.87) | 0.73 (0.62, 0.87) | 0.95 (0.83, 1.10) | 0.91 (0.78, 1.05) | 0.87 (0.80, 0.95) | TpH 20 < 60% | 0.98 (0.89, 1.08) | 1.09 (0.89, 1.34) |
| TpH ≥ 60% | 0.72 (0.60, 0.85) | 0.71 (0.57, 0.88) | 0.82 (0.69, 0.97) | 0.89 (0.74, 1.06) | 0.81 (0.73, 0.90) | TpH ≥ 60% | 0.99 (0.89, 1.11) | 1.18 (0.93, 1.51) |
| Multivariableb | ||||||||
| Income Q1 (low) | 1.00 | 1.00 | 1.00 | 1.00 | 1.00 | H < 20 Q1 | 1.00 | 1.00 |
| Income Q2 | 0.91 (0.75, 1.10) | 0.83 (0.66, 1.06) | 1.19 (0.97, 1.45) | 1.05 (0.85, 1.30) | 1.14 (1.01, 1.29) | Q2 | 0.93 (0.72, 1.19) | 0.82 (0.49, 1.37) |
| Income Q3 | 0.96 (0.80, 1.16) | 0.94 (0.74, 1.18) | 1.29 (1.07, 1.56) | 1.26 (1.03, 1.53) | 1.22 (1.07, 1.40) | Q3 | 0.93 (0.75, 1.17) | 0.88 (0.58, 1.35) |
| Income Q4 (high) | 0.99 (0.82, 1.19) | 0.82 (0.65, 1.06) | 1.40 (1.14, 1.72) | 1.24 (1.00, 1.52) | 1.43 (1.26, 1.62) | Q4 | 1.19 (0.96, 1.46) | 0.71 (0.46, 1.09) |
| TpH < 20% | 1.00 | 1.00 | 1.00 | 1.00 | 1.00 | Q1 H < 20 | 1.00 | 1.00 |
| TpH 20 < 60% | 0.76 (0.66, 0.88) | 0.71 (0.60, 0.85) | 1.01 (0.88, 1.16) | 0.95 (0.81, 1.11) | 0.93 (0.85, 1.02) | H20 < 60 | 0.85 (0.67, 1.08) | 1.00 (0.65, 1.54) |
| TpH ≥ 60% | 0.72 (0.61, 0.86) | 0.69 (0.55, 0.86) | 0.87 (0.73, 1.03) | 0.92 (0.77, 1.11) | 0.87 (0.78, 0.98) | H ≥ 60 | 0.73 (0.55, 0.97) | 1.80 (1.16, 2.81) |
| Q2 H < 20 | 1.00 | 1.00 | ||||||
| H20 < 60 | 0.90 (0.72, 1.13) | 1.05 (0.69, 1.62) | ||||||
| H ≥ 60 | 1.06 (0.83, 1.35) | 0.74 (0.43, 1.29) | ||||||
| Q3 H < 20 | 1.00 | 1.00 | ||||||
| H20 < 60 | 1.13 (0.90, 1.43) | 0.75 (0.46, 1.20) | ||||||
| H ≥ 60 | 1.26 (1.00, 1.58) | 0.70 (0.41, 1.18) | ||||||
| Q4 H < 20 | 1.00 | 1.00 | ||||||
| H20 < 60 | 1.29 (1.03, 1.63) | 0.65 (0.37, 1.14) | ||||||
| H ≥ 60 | 0.94 (0.68, 1.32) | 0.34 (0.09, 1.23) | ||||||
| 6 df F test for interaction |
F = 1.70
P < 0.1166 |
F = 1.41
P < 0.2049 |
F = 1.36
P < 0.2268 |
F = 0.78
P < 0.5807 |
F = 1.27
P < 0.2697 |
F = 3.02
P < 0.0051 |
F = 2.34
P < 0.0294 |
|
Q: quartile; TpH: total percent Hispanic; H: Hispanic; df: degrees of freedom.
The age-adjusted only models show age-adjusted rate ratios for income quartiles without adjustment for ethnic concentration and age-adjusted rate ratios for different levels of Hispanic concentration without adjustment for Income quartiles.
The multivariable models show age-adjusted rate ratios with mutual adjustment for income and ethnic context of the census tract. If an F test shows that income × ethnic concentration interactions are necessary to fit the data (prostate and cervical carcinoma), we show rate ratios for the effect of income within the referent TpH level (<20%), and then for the contrast between TpH 20 <60% and TpH ≥60% vs. TpH <20% within each income quartile.
When TpH and tract Hispanic income are jointly controlled in a multivariable model, RRs change little compared with the models that are adjusted for age only for lung, colorectal, and female breast carcinomas. By contrast, there are significant interaction effects of tract income and tract ethnic concentration for prostate and cervical carcinomas. The effect is most striking for cervical carcinomas, for which increases in incidence are concentrated in high TpH tracts in the lowest economic quartile.
The multivariable analyses in Table 2 were repeated after deleting all in situ and localized cancers. In other words, we calculated the incidence of new cancers that presented at regional or distant stages (Table 3). This was done to examine whether an ascertainment bias was responsible for the association of cancer incidence with TpH. In general, the pattern of results was similar to that described in Table 1. The noteworthy exception occurs for prostate carcinoma, for which there is a significant and substantial decrease in incidence with increasing TpH. Both TpH and economic effects are weak for regional and distant stage female breast carcinoma.
TABLE 3.
Incidence Rate Ratios for Five Common Cancers (Regional, Distant, and Unstaged) by Percent of Hispanics in the Census Tract and Hispanic Income Quartilea
| Tract context | Lung carcinoma (male) | Lung carcinoma (female) | Colorectal carcinoma (male) | Colorectal carcinoma (female) | Breast carcinoma (female) | Prostate carcinoma | Tract context | Cervical carcinoma |
|---|---|---|---|---|---|---|---|---|
| Income Q 1 (low) | 1.00 | 1.00 | 1.00 | 1.00 | 1.00 | 1.00 | H < 20 Q1 | 1.00 |
| Income Q2 | 0.88 (0.72, 1.09) | 0.82 (0.64, 1.06) | 1.11 (0.86, 1.43) | 1.06 (0.81, 1.38) | 1.16 (0.96, 1.40) | 1.09 (0.87, 1.38) | Q2 | 1.66 (0.75, 3.68) |
| Income Q3 | 0.91 (0.74, 1.11) | 0.90 (0.69, 1.15) | 1.15 (0.90, 1.46) | 1.22 (0.94, 1.58) | 1.06 (0.87, 1.29) | 1.25 (1.00, 1.56) | Q3 | 1.31 (0.60, 2.86) |
| Income Q4 (high) | 0.90 (0.74, 1.09) | 0.84 (0.65, 1.09) | 1.27 (0.99, 1.64) | 1.12 (0.86, 1.47) | 1.22 (1.01, 1.48) | 1.29 (1.02, 1.63) | Q4 | 1.01 (0.47, 2.18) |
| TpH < 20% | 1.00 | 1.00 | 1.00 | 1.00 | 1.00 | 1.00 | Q1 H < 20 | 1.00 |
| TpH 20 < 60% | 0.78 (0.67, 0.91) | 0.69 (0.57, 0.84) | 0.93 (0.77, 1.12) | 0.88 (0.72, 1.08) | 0.94 (0.81, 1.08) | 0.82 (0.69, 0.96) | H20 < 60 | 1.80 (0.85, 3.84) |
| TpH ≥ 60% | 0.72 (0.59, 0.87) | 0.64 (0.50, 0.82) | 0.83 (0.66, 1.04) | 0.89 (0.70, 1.12) | 0.92 (0.78, 1.10) | 0.67 (0.55, 0.81) | H ≥ 60 | 3.68 (1.72, 7.85) |
| Q2 H < 20 | 1.00 | |||||||
| H20 < 60 | 2.09 (0.99, 4.41) | |||||||
| H ≥ 60 | 0.96 (0.37, 2.47) | |||||||
| Q3 H < 20 | 1.00 | |||||||
| H20 3<60 | 1.50 (0.67, 3.34) | |||||||
| H ≥ 60 | 1.14 (0.47, 2.78) | |||||||
| Q4 H < 20 | 1.00 | |||||||
| H20 < 60 | 1.17 (0.47, 2.90) | |||||||
| H ≥ 0 | 0.65 (0.08, 5.10) | |||||||
| 6 df F test for interaction |
F = 2.06
P < 0.0508 |
F = 1.07
P < 0.3789 |
F = 1.41
P < 0.2083 |
F = 1.57
P < 0.1515 |
F = 0.65
P < 0.6936 |
F = 1.64
P < 0.1333 |
F = 2.48
P < 0.0219 |
Q: quartile; TpH: total percent Hispanic; H: Hispanic; df: degrees of freedom.
Incidence rate ratios are from multivariable models that are age adjusted and with mutual adjustment for income and ethnic context of the census tract. Where an F test shows that income × ethnic concentration interactions are necessary to fit the data (cervical carcinoma), we show rate ratios for the main effect of income, and then for the contrast between TpH 20 < 60% and TpH ≥ 60% vs. TpH < 20% within each income quartile.
DISCUSSION
Using a database (SEER) that was designed to produce valid information on incidence of specific cancers in different ethnicities,33 we find a negative relation between neighborhood density of Hispanics and cancer. These effects are complemented by increases in incidence associated with the increasing income of a tract’s Hispanic population. The differences in incidence of common cancers in Hispanics depending on neighborhood composition are not trivial. For example, the data suggest a 39% reduction in breast carcinoma and a 38% reduction in male colorectal carcinoma when contrasting the Hispanic population of high-density Hispanic neighborhoods (tract TpH ≥ 60%) in the lowest income quartile to Hispanics living in tracts with the lowest TpH in the highest income quartile. Hispanics living in high-density Hispanic neighborhoods experience an approximate 30% reduction in lung carcinoma, regardless of tract income levels.
Many health indicators for U.S. Hispanics, such as birth outcomes and adult mortality rates, are as good as or better than those for non-Hispanic whites.16–18 This is considered a paradox, because Hispanics, on average, have substantially lower incomes, schooling, and medical insurance coverage than do non-Hispanic whites. Our results suggest that the advantage Hispanics enjoy relative to non-Hispanic whites in cancer risk may be transitory, as it appears to diminish as Hispanics become more residentially and economically integrated into the majority culture.
There is good epidemiologic evidence for environmental contributions to breast, colorectal, and prostate carcinomas.4,5 The changing incidence of these cancers within the Hispanic community in the United States as it becomes assimilated provides investigators with a laboratory to study which environmental forces are associated most closely with risk of specific cancers. Consideration of environmental influences in cancer promotion include the following: diet; other lifestyle activities such as tobacco use, regular exercise, and alcohol intake; exposure to environmental pollutants; and sociocultural forces that affect level of stress. It is known that cigarette smoking increases with increasing assimilation of U.S. Hispanics,20–,22 and that factor is presumably the major cause of the pattern of decreased lung carcinoma incidence observed among Hispanics in high-density Hispanic neighborhoods. It is not clear which lifestyle factors associated with high-density Hispanic neighborhoods are associated with lower rates for breast, colorectal, and regional and distant-stage prostate carcinomas.
The lower incidence of cancers of most common sites for Hispanics living in lower-income (higher-poverty) tracts has been previously noted in reports produced from the SEER registry.31 This pattern reverses the gradient increase in the incidence of lung carcinoma with increasing tract poverty, and absence of area socioeconomic differences in the incidence of colorectal carcinoma that was reported for whites and blacks in the same time period.31 These differences are as yet unexplained. Area socioeconomic effects may be more complex for Hispanics than they are for whites and blacks, because economic level may serve, in part, as an indicator of cultural assimilation for Hispanics, but not to the same degree for these other groups. Therefore, economic class-based reduction in certain cancer risk behaviors may be partially offset by acculturation to a behavioral profile that increases other risks. These mechanisms remain relatively unexplored. Careful attention to lifestyle changes in His-panics with increased residential and economic assimilation may produce important clues for understanding the environmental causes of cancer.
In terms of limitations, it could be argued that our findings might be an artifact of variations in cancer surveillance. That is, if diagnosis and/or registration of cancer in tumor registries were less complete in neighborhoods with higher percentages of Hispanic residents or with lower incomes, this could produce the pattern of results that we found. This is an unlikely explanation for our results, for several reasons. First, the SEER registry is generally recognized to be complete, with ascertainment rates > 95%.14,43 This has not been found to vary substantially with ethnicity or socioeconomic status. Second, the pattern of increased cancer incidence in Hispanics living in neighborhoods with few other Hispanics and in higher-income neighborhoods was not found for all the cancers mentioned in the current study. For cervical carcinoma, there was a trend in the opposite direction. This finding is consistent with the cultural change hypothesis, because incidence rates for cervical carcinoma are consistently reported to be higher rather than lower for Hispanic populations compared with non-Hispanic whites.14 It is inconsistent with an underregistration effect. Third, the pattern was generally the same when we restricted the analyses to higher-stage cancers, the incidence of which should not be inflated by use of cancer screening (Table 3). Finally, if the decreased cancer incidence among Hispanics living in certain neighborhoods is an artifact of poorer cancer surveillance in those neighborhoods, one might also expect to find a similar pattern of lower cancer incidence among non-Hispanic whites living in neighborhoods with a high percentage of Hispanics. We performed those analyses and did not find such a pattern (data not shown).
Another potential limitation is in ascertainment of Hispanic ethnicity. SEER uses an algorithm including information from medical records supplemented by comparison with a list of Hispanic surnames, whereas the census reports ethnicity by self-identification.38 Because there are different assessment methods for obtaining the denominator and numerator used in calculating cancer incidence data among Hispanics, the pattern of results we obtained could be secondary to varying levels of ascertainment by either method as a function of percentage of Hispanics in the neighborhood. However, underascertainment of Hispanic ethnicity in SEER relative to the census data is most likely to occur in areas with low percentages of Hispanics where intermarriage between Hispanics and others is more prevalent,44 and where ethnic identification is likely to be more fluid and intermittent.45,46 Thus, any bias introduced by underascertainment of His-panic ethnicity in SEER data is most likely to suppress rather than to produce the observed reductions in cancer incidence rates in high percentage Hispanic tracts.
A final limitation is our use of data from the 1996 release of incidence data for 9 SEER registration areas, for the period 1988–1992. The reported results may not generalize to the current time period and to the United States as a whole.
In summary, the substantial increases in cancer incidence among Hispanics living in ethnically heterogeneous neighborhoods and higher-income neighborhoods suggest that the Hispanic population will lose its advantage in cancer mortality as it becomes more spatially and economically assimilated with the majority population.
Footnotes
Supported by the University of Texas Medical Branch Center for Population Health and Health Disparities, which is funded by Grant P-30-CA-12385-01 from the National Cancer Institute.
References
- 1.Anderson RN. Deaths. Leading causes for 2000. Vital Health Stat. 2002;50:1–85. [PubMed] [Google Scholar]
- 2.Feinberg A, Cui H, Ohlsson R. DNA methylation and genomic imprinting: insights from cancer into epigenetic mechanisms. Semin Cancer Bio. 2002;12:389–398. doi: 10.1016/s1044-579x(02)00059-7. [DOI] [PubMed] [Google Scholar]
- 3.Li D, Walcott FL, Chang P, et al. Genetic and environmental determinants on tissue response to in vitro carcinogen exposure and risk of breast cancer. Cancer Res. 2002;62:4566–4570. [PubMed] [Google Scholar]
- 4.Doll R. Epidemiological evidence of the effects of behavior and the environment on the risk of human cancer. Recent Results Cancer Res. 1998;154:3–21. doi: 10.1007/978-3-642-46870-4_1. [DOI] [PubMed] [Google Scholar]
- 5.Doll R, Peto R. The causes of cancer: quantitative estimates of avoidable risks of cancer in the United States today. J Natl Cancer Inst. 1981;166:191–308. [PubMed] [Google Scholar]
- 6.Gatof D, Ahnen D. Primary prevention of colorectal cancer: diet and drugs. Gastroenterol Clin North Am. 2002;31:587–623. doi: 10.1016/s0889-8553(02)00011-0. [DOI] [PubMed] [Google Scholar]
- 7.Weiss G. Cancer risks. Acrylamide in food: uncharted territory. Science. 2002;197:27. doi: 10.1126/science.297.5578.27a. [DOI] [PubMed] [Google Scholar]
- 8.Wenten M, Gilliland F, Baumgartner K, Samet J. Associations of weight, weight change, and body mass with breast cancer risk in Hispanic and non-Hispanic white women. Ann Epidemiol. 2002;12:435–444. doi: 10.1016/s1047-2797(01)00293-9. [DOI] [PubMed] [Google Scholar]
- 9.Bianchini F, Kaaks R, Vainio H. Weight control and physical activity in cancer prevention. Obesity Rev. 2002;3:5–6. doi: 10.1046/j.1467-789x.2002.00046.x. [DOI] [PubMed] [Google Scholar]
- 10.Hemminiki K, Li X, Czene K. Cancer risks in first-generation immigrants to Sweden. Int J Cancer. 2002;99:218–228. doi: 10.1002/ijc.10322. [DOI] [PubMed] [Google Scholar]
- 11.Hemminiki K, Li X. Cancer risks in second-generation immigrants to Sweden. Int J Cancer. 2002;99:229–237. doi: 10.1002/ijc.10323. [DOI] [PubMed] [Google Scholar]
- 12.Kliewer EV, Smith KR. Breast cancer mortality among immigrants in Australia and Canada. J Natl Cancer Inst. 1995;87:1154–1161. doi: 10.1093/jnci/87.15.1154. [DOI] [PubMed] [Google Scholar]
- 13.U.S. Census Bureau. 2000 Census of population. Summary file 1, 2001. Bethesda: US Census Bureau; [Google Scholar]
- 14.Ries LAG, Eisner MP, Kosary CL, et al., editors. SEER cancer statistics review, 1975–2000. Bethesda, MD: National Cancer Institute; 2003. [Google Scholar]
- 15.Trapido EJ, Burciaga Valdez R, Obeso JL, Strickman-Stein N, Rotger A, Pérez-Stable Epidemiology of cancer among His-panics in the United States. J Natl Cancer Inst Monogr. 1995;18:17–28. [PubMed] [Google Scholar]
- 16.Elo IT, Preston SH. Racial and ethnic differences in mortality at older ages. In: Martin LG, Soldo BJ, editors. Racial and ethnic differences in the health of older Americans. Washington, DC: National Academy Press; 1997. pp. 10–42. [Google Scholar]
- 17.Sorlie PD, Backlund E, Johnson NJ, Rogot E. Mortality by Hispanic status in the United States. JAMA. 1993;270:2464–2468. [PubMed] [Google Scholar]
- 18.Markides KS, Coreil J. The health of Hispanics in the southwestern United States: an epidemiologic paradox. Public Health Rep. 1986;101:253–265. [PMC free article] [PubMed] [Google Scholar]
- 19.Strom SS, Wu X, Sigurdson AJ, et al. Lung cancer, smoking patterns, and mutagen sensitivity in Mexican Americans. J Natl Cancer Inst Monogr. 1995;18:29–39. [PubMed] [Google Scholar]
- 20.Singh GK, Siahpush M. Ethnic-immigrant differentials in health behaviors, morbidity and cause-specific mortality in the United States: an analysis of two national databases. Hum Biol. 2002;74:83–109. doi: 10.1353/hub.2002.0011. [DOI] [PubMed] [Google Scholar]
- 21.Perez-Stable EJ, Ramirez A, Villareal R, et al. Cigarette smoking behavior among US Latino men and women from different countries of origin. Am J Public Health. 2001;91:1424–1430. doi: 10.2105/ajph.91.9.1424. [DOI] [PMC free article] [PubMed] [Google Scholar]
- 22.Otero-Sabogal R, Sabogal F, Pérez-Stable EJ, Hiatt RA. Dietary practices, alcohol consumption, and smoking behavior: ethnic, sex and acculturation differences. J Natl Cancer Inst Monogr. 1995;18:73–82. [PubMed] [Google Scholar]
- 23.Sundquist J, Winkleby M. Country of birth, acculturation status and abdominal obesity in a national sample of Mex-ican-American women and men. Int J Epidemiol. 2000;29:470–477. [PubMed] [Google Scholar]
- 24.Marks G, Garcia M, Solis JM. Health risk behaviors of His-panics in the United States: findings from HHANES, 1982-84. Am J Public Health. 1990;80(Suppl):20–26. doi: 10.2105/ajph.80.suppl.20. [DOI] [PMC free article] [PubMed] [Google Scholar]
- 25.Markides KS, Ray LA, Stroup-Benham C, Trevino F. Acculturation and alcohol consumption in the Mexican American population of the southwestern United States: findings from the HHANES 1982-1984. Am J Public Health. 1990;80(Suppl):42–46. doi: 10.2105/ajph.80.suppl.42. [DOI] [PMC free article] [PubMed] [Google Scholar]
- 26.Guendelman S, Abrams B. Dietary intake among Mexican American women: generational differences and a comparison with white non-Hispanic women. Am J Public Health. 1995;85:20–25. doi: 10.2105/ajph.85.1.20. [DOI] [PMC free article] [PubMed] [Google Scholar]
- 27.Gordon-Larsen P, Harris KM, Ward DS, Popkin BM. Acculturation and overweight-related behaviors among Hispanic immigrants to the US: the National Longitudinal Study of Adolescent Health. Soc Sci Med. 2003;57:2023–2034. doi: 10.1016/s0277-9536(03)00072-8. [DOI] [PubMed] [Google Scholar]
- 28.Alba RD, Logan JR, Crowder K. White ethnic neighborhoods and assimilation: the Greater New York region, 1980–1990. Social Forces. 1997;75:883–912. [Google Scholar]
- 29.Breton R. Institutional completeness of ethnic communities and personal relations of immigrants. Am J Soc. 1964;70:193–205. [Google Scholar]
- 30.Yancey W, Eriksen E, Leon G. The structure of pluralism: “We’re all Italian around here, aren’t we Mrs. O’Brien?”. Ethnic Racial Stud. 1985;8:94–116. [Google Scholar]
- 31.Singh GK, Miller BA, Hankey BF, Edwards BK. NCI Cancer Surveillance Monograph Series, No. 4. NIH Publication No. 03-5417. Bethesda, MD: National Cancer Institute; 2003. Area socioeconomic variations in U.S. cancer incidence, mortality, stage, treatment, and survival, 1975–1999. [Google Scholar]
- 32.Massey D. The settlement process among Mexican migrants to the United States. Am Sociol Rev. 1986;51:670–685. [Google Scholar]
- 33.Surveillance, Epidemiology, and End Results (SEER) program. Bethesda, MD: National Cancer Institute, DCCPS, Surveillance Research Program, Cancer Statistics Branch; 1996. (available from URL: www.seer.cancer.gov) public-use data (1973–1993) (based on the February 1996 submission) [Google Scholar]
- 34.U.S. Census Bureau. 1990 census of population. Summary tape file 1A, 1991. [[accessed May 26, 2004]]; Available from URL: www.census.gov.
- 35.U.S. Census Bureau. 1990 census of population. Summary tape file 3A, 1992. [[accessed May 26, 2004]]; Available from URL: www.census.gov.
- 36.Rubin DB. Multiple imputation for nonresponse in surveys. New York: John Wiley; 1987. [Google Scholar]
- 37.Schafer JL. Analysis of incomplete multivariate data. New York: Chapman and Hall; 1997. [Google Scholar]
- 38.Stewart S, Swallen KC, Glaser SL, Horn-Ross P, West DW. Comparison of methods for classifying Hispanic ethnicity in a population-based cancer registry. Am J Epidemiol. 1999;149:1063–1071. doi: 10.1093/oxfordjournals.aje.a009752. [DOI] [PubMed] [Google Scholar]
- 39.National Research Council, Panel on Poverty and Family Assistance. A new approach. Washington, DC: National Academy Press; 1995. Measuring poverty. [Google Scholar]
- 40.U.S. Department of Housing and Urban Development, Office of Policy Development and Research. Fair market rents for Section 8 housing assistance payments program. Washington, DC: U.S. Department of Housing and Urban Development; 1992. [Google Scholar]
- 41.U.S. Department of Housing and Urban Development. FMR history 1983–present. [[accessed May 27, 2004]]; Available from URL: http://www.huduser.org/datasets/fmr.html.
- 42.SAS Institute, Inc. SAS/STAT user’s guide. Version 9. Cary, NC: SAS Institute Inc.; 2002. [Google Scholar]
- 43.Bach PB, Guadagnali E, Schrag D, Schussler N, Warren JL. Patient demographic and socioeconomic characteristics in the SEER-Medicare database. Med Care. 2002;40(8 Suppl):IV90–IV25. doi: 10.1097/00005650-200208001-00003. [DOI] [PubMed] [Google Scholar]
- 44.Kalmijn M. Intermarriage and homogamy: causes, patterns, trends. Annu Rev Soc. 1998;24:395–421. doi: 10.1146/annurev.soc.24.1.395. [DOI] [PubMed] [Google Scholar]
- 45.Eschbach K, Gomez C. Choosing Hispanic identity: ethnic identity switching among respondents in high school and beyond. Soc Sci Q. 1998;79:74–90. [Google Scholar]
- 46.Xie Y, Goyette K. The racial identification of biracial children with one Asian parent: evidence from the 1990 census. Soc Forces. 1998;76:547–570. [Google Scholar]