

Abstract
Previous neuroimaging studies have found hyperactivation in the cerebellum and motor cortex and hypoactivation in the basal ganglia in patients with Parkinson’s disease (PD) but the relationship between the two has not been established. This study examined whether cerebellar and motor cortex hyperactivation is a compensatory mechanism for hypoactivation in the basal ganglia or is a pathophysiological response that is related to the signs of the disease. Using a BOLD contrast fMRI paradigm PD patients and healthy controls performed automatic and cognitively controlled thumb pressing movements. Regions of interest analysis quantified the BOLD activation in motor areas, and correlations between the hyperactive and hypoactive regions were performed, along with correlations between the severity of upper limb rigidity and BOLD activation. There were three main findings. First, the putamen, supplementary motor area (SMA) and pre-SMA were hypoactive in PD patients. The left and right cerebellum and the contralateral motor cortex were hyperactive in PD patients. Second, PD patients had a significant negative correlation between the BOLD activation in the ipsilateral cerebellum and the contralateral putamen. The correlation between the putamen and motor cortex was not significant. Third, the BOLD activation in the motor cortex was positively correlated with the severity of upper limb rigidity, but the BOLD activation in the cerebellum was not correlated with rigidity. Further, the activation in the motor cortex was not correlated with upper extremity bradykinesia. These findings provide new evidence supporting the hypothesis that hyperactivation in the ipsilateral cerebellum is a compensatory mechanism for the defective basal ganglia. Our findings also provide the first evidence from neuroimaging that hyperactivation in the contralateral primary motor cortex is not a compensatory response but is directly related to upper limb rigidity.
Sporadic Parkinson’s disease (PD) results from degeneration of the nigrostriatal dopaminergic system leading to resting tremor, rigidity, bradykinesia and akinesia. According to the classic model of the motor deficits of PD (Albin et al., 1989; DeLong, 1990), the internal segment of the globus pallidus has an increased inhibitory drive to the thalamus that reduces the excitatory thalamic drive to the cerebral cortex. This model is supported by brain imaging studies showing reduced regional cerebral blood flow (rCBF) and reduced blood oxygenation level dependent (BOLD) activation in the basal ganglia, and in cortical regions such as the supplementary motor area (SMA) and dorsolateral prefrontal cortex (DLPFC) (Buhmann et al., 2003; Dirnberger et al., 2005; Jahanshahi et al., 1995; Playford et al., 1993; Samuel et al., 1997; Thobois et al., 2004). On the other hand, brain imaging studies in PD patients using a variety of motor tasks have found hyperactivation in the primary motor cortex (Haslinger et al., 2001; Sabatini et al., 2000; Thobois et al., 2000) and the cerebellum (Rascol et al., 1997; Wu and Hallett, 2005). Hyperactivation in PD patients has been suggested as a strategy of the central nervous system to compensate for the defective function in the basal ganglia (Ceballos-Baumann, 2003; Rascol et al., 1997; Sabatini et al., 2000; Thobois et al., 2000; Thobois et al., 2004; Wu and Hallett, 2005), although the direct support for this hypothesis has been tentative. Alternatively, it has been argued that hyperactivation could be related to specific signs of the disease such as rigidity (Kleine et al., 2001; Pierantozzi et al., 2001; Ridding et al., 1995). For example, Pierantozzi et al (2001) found that following apomorphine uptake the increased inhibition of motor evoked potentials (MEP) was correlated with the improvement in the UPDRS rigidity score. Cantello and colleagues (1991) also reported that in PD patients with predominant rigidity, the threshold of motor cortical stimulation was significantly lower in the side contralateral to the rigid hand compared to the non-rigid hand. These studies are in contrast to previous suggestions that the motor cortex may not play a significant role in rigidity (Delwaide et al., 2000).
The current study examines if the hyperactivation in the cerebellum and primary motor cortex in PD patients is consistent with compensation or potentially related to limb rigidity. In order for hyperactivation of a specific brain region to be considered compensatory, the structural or physiological responses of the compensatory brain area must be modified and shown to counterbalance the brain region that is functioning abnormally (Bezard et al. 2001). We used BOLD contrast fMRI during simple thumb pressing movements in PD patients and age-matched healthy individuals. We chose a motor timing task because several studies have pointed out the critical role of the basal ganglia and cerebellum in producing time intervals (Harrington et al., 1998; Ivry and Keele, 1989; Jueptner et al., 1995; O’Boyle et al., 1996; Penhune et al., 1998; Wing et al., 1984). The thumb movements were paced by a metronome at two different intervals (900 ms and 2400 ms). While the pacing at 900 ms elicited a more periodic and automatic response, the stimuli with 2400 ms intervals are no longer perceived and produced as periodic movements. Rather, subjects produce a sequence of individual discrete movements in which each movement is initiated and terminated as a separate movement (Schaal et al., 2004). These two tasks are consistent with what Miall and colleagues labeled as automatic and cognitively controlled timing and are associated with different cortical and subcortical activation patterns (Lewis and Miall, 2003).
This study had three goals. Our first goal was to replicate previous findings that the putamen is hypoactive in PD (Jahanshahi et al., 1995), and the ipsilateral cerebellum (Rascol et al., 1997; Wu and Hallett, 2005) and motor cortex (Haslinger et al., 2001; Sabatini et al., 2000; Thobois et al., 2000) are hyperactive in PD. The first hypothesis is that this pattern of hypo- and hyperactivation is not task specific and occurs during both automatic rhythmic movements (900 ms) and cognitively controlled discrete movements (2400 ms). Our second and third goals provide novel insights into potential consequences of hyperactivity in the cerebellum and motor cortex. The second hypothesis is that if hyperactivation in the cerebellum and motor cortex were consistent with a compensatory mechanism then there would be a negative correlation with the activation in the putamen. To this end we examined the correlations between the BOLD activation in the putamen with the BOLD activation in the cerebellum and motor cortex. The third goal examined the correlations between the BOLD activation in the cerebellum and motor cortex with the rigidity and bradykinesia scores from the UPDRS. The third hypothesis is that if hyperactivation in the motor cortex was consistent with altered pathophysiology rather than compensation, the correlation with the activation in the putamen would be low and non-significant. Instead, a positive and significant correlation should exist with a sign of PD such as limb rigidity. As such, we examined the correlations between the BOLD activation in motor cortex and limb rigidity. To determine the specificity of the correlation, we also correlated the BOLD activation with bradykinesia.
Methods
Participants
Eight PD patients and eight sex and age matched healthy subjects participated in the experiment. The average age of the PD patients was 59.4 ± 8.4 years. When recruited, all patients were taking levodopa and a short-acting dopamine agonist. Only one patient was taking levodopa plus a long-acting dopamine agonist. This patients’ data was similar to the other 7 patients. Their motor performance was independently rated by a movement disorders neurologist using the Unified Parkinson Disease Rating Scale (UPDRS) (Fahn et al., 1987). The scores are listed in Table 1, and were obtained following a 12 hour overnight withdrawal of antiparkinsonian medication. Brain imaging was also examined following overnight withdrawal of antiparkinsonian medication in the functionally defined off state (Langston et al., 1992). To avoid the potential confounding effect from tremor and cognitive deficits, patients with a UPDRS resting tremor score larger than 1 on the right upper limb or with an MMSE (Mini Mental State Examination) score less than 27 were not recruited in the experiment. The average age of control subjects was 59.5 ± 9.5 years, and none reported a history of neurological disease or cognitive dysfunction. All subjects agreed to the experimental procedure by signing the informed consent form approved by the Institutional Review Board of the University of Illinois at Chicago.
Table 1.
Characteristics of patients.
| Sex | Age (years) | Course (years) | MMSE | Rest Tremor (RUE) | Rigidity (RUE) | Bradykinesia (RUE) | UPDRS (motor) |
|---|---|---|---|---|---|---|---|
| M | 49 | 5 | 27 | 0 | 2 | 6 | 38 |
| F | 52 | 6 | 30 | 1 | 2 | 7 | 24 |
| M | 75 | 7 | 27 | 0 | 3 | 6 | 48 |
| F | 65 | 11 | 29 | 0 | 3 | 7 | 38 |
| F | 52 | 2 | 30 | 0 | 1 | 3 | 21 |
| M | 61 | 6 | 30 | 0 | 3 | 6 | 39 |
| F | 60 | 4 | 30 | 0 | 1 | 6 | 22 |
| F | 61 | 6 | 29 | 0 | 2 | 3 | 19 |
MMSE: Mini Mental State Examination; RUE: right upper extremity; UPDRS: United Parkinson Disease Rating Scale. The score of bradykinesia includes the scores of right finger tapping, right hand movements (opening and closing in rapid succession), and right hand rapid alternating movements (pronating and supinating). Patients were evaluated after an overnight withdrawal of their regular antiparkinsonian medication.
Procedure and design
The experimental protocol consisted of subjects performing paced thumb pressing movements at short and long time intervals. The auditory pacing signals, with each tone of a duration of 50 ms and a frequency of 440 Hz, were delivered to subjects binaurally via headphones. Subjects were given a cylinder-shaped device in their right hand by which they performed thumb movements. During the task, subjects were instructed to synchronize their right thumb flexion by pressing the button on the cylinder device with the metronome tones as accurately as possible. The experiment used a block design consisting of four movement blocks alternating with rest. Each block lasted 25 s. Two separate imaging scans were performed. The target period was 900 ms for one scan, and 2400 ms for the other. The two tasks were presented with the order counterbalanced across subjects. Subjects were trained on the movement task for approximately 45 minutes outside the scanner before data collection.
Data acquisition
All imaging data were acquired on a 3.0 Tesla Signa whole body scanner with a volume head coil (General Electric Healthcare, Wisconsin, USA). Head motion was restricted by placing adjustable padding between the head and the head coil apparatus. A fixation point was given together with visual feedback of the head position to facilitate a stable head position (Thulborn, 1999). BOLD contrast functional images were obtained using a single-shot echo-planar sequence with a repeat time of 2500 ms (TE: 25 ms, flip angle: 90°, FOV: 20.0 cm, image matrix: 64 × 64). Slice thickness was 5 mm with 0 gap between slices. 25 axial slices were collected that covered the whole brain including the inferior portion of the cerebellum. The voxel size of the functional images was 3.125 x 3.125 x 5 mm. T1-weighted anatomical scans were acquired using a three-dimensional spoiled gradient echo sequence (TR/TE: 1.98 / 9 ms, flip angle: 25°, FOV: 22.0 cm, matrix: 256 × 256, slice thickness: 1.5 mm).
Behavioral data were recorded with the hand device at a sampling frequency of 250 Hz. The signal from the button pressing was recorded as a binary time series of either ON or OFF the button.
Behavioral data analysis
The behavioral data were analyzed using custom written programs in MATLAB. The inter-response interval (IRI) was defined as the interval between two successive movement onsets. For each subject the means and standard deviations of the IRIs were calculated separately for each task block, and then averaged for the entire scan. The average time that subjects maintained their thumb on the button between each IRI was also calculated. Significant differences between healthy controls and PD patients were tested using a 2 (group) x 2 (task) ANOVA for each dependent measure.
fMRI analysis: Within-group functional maps
Imaging data were analyzed using the Analysis of Functional NeuroImages (AFNI) software (Cox, 1996; Cox and Hyde, 1997). Motion correction was performed on each data time series using 3D volume registration. A 2 (group) x 2 (task) x 3 (x, y, z direction) mixed model ANOVA with repeated measures on task and direction was performed. This analysis indicated that the head motion was not significantly different between patients and controls (p = 0.32), there was no significant difference between the 900 ms and 2400 ms tasks (p = 0.49), and head motion between each direction was also not significantly different (p = 0.21). All interactions were non-significant.
For each subject the average percent signal change associated with the thumb movement conditions was calculated against the rest condition. To estimate the functional activity of each voxel, a multiple regression model was used to correlate the time series of percent signal change with simulated hemodynamic response functions for the thumb movement and rest conditions. The time series for thumb movements and rest conditions was simulated as a box-car function. The box-car time series was then convolved with an ideal hemodynamic gamma variate waveform in AFNI. Subsequently, the individual functional data were transformed into Talairach space (Talairach and Tournoux, 1988).
Within-group functional maps for the movement tasks were obtained using a mixed-effects two-way ANOVA, where task was a fixed factor and subject was treated as a random factor. For both healthy and patient groups significant functional activity was identified using AlphaSim in AFNI at the individual voxel level of t > 4.5 with a minimal cluster size of 6 contiguous voxels (300μl). This yielded a corrected alpha of p < 0.05.
ROI analysis: Between-group differences
To examine hypothesis 1, we first generated the ROI mask using between-group analyses. Between-group differences were tested using ROI analysis on the percent signal change. To draw the ROI mask, separate between-group t-tests were performed for the 900 ms and 2400 ms tasks, respectively. Regions that had a significant difference at p < 0.05 were identified. Those regions in both 900 and 2400 ms tasks were then compared with the within-group functional maps. Only those regions that showed significant activation in the within-group maps were included in the final ROI mask, which was the same mask for both the 900 and 2400 ms tasks. This approach focuses the mask on the between-group effects, and minimizes the potential effects of the task. The mask included thirteen regions for the ROI analysis that included the left motor cortex, left and right pre-SMA, left and right SMA, right DLPFC, left and right caudate, left and right putamen, left GPe, and left and right lateral cerebellum. The ROI analysis included all voxels (with positive or negative percent signal changes against rest) within the mask. Separate 2 (group) x 2 (task) mixed model ANOVAs were performed for each ROI region. Significant main effects and interactions were reported when the probability of a type I error was less than 0.05.
Relation between hypo- and hyper- activation
To test hypothesis 2 regarding the relation between hypoactivation and hyperactivation in PD patients, Pearson’s correlation analyses were performed on the percent signal change between the left putamen and all of the left side regions (6 in total) from the ROI analysis. We also examined the correlations with the right cerebellum because there are contralateral projections to motor areas and there is also a disynaptic connection with the contralateral (left) putamen (Hoshi et al., 2005). The left cerebellum was tested for correlations as a control condition because we did not anticipate correlations between the left cerebellum and left motor areas. As an additional control analysis, we examined the correlation between the right cerebellum and left putamen of healthy subjects. Since the group by task interactions in these regions were not significant, the percent signal changes in the 900 ms and 2400 ms conditions were pooled in the correlation analysis. Significant positive and negative correlations were defined at p < 0.05.
Relation between hyperactivation and limb rigidity
To test hypothesis 3 the relation between limb rigidity and brain activity was investigated. The rigidity score of the right upper limb was evaluated using the UPDRS (range 0 – 4, Table 1). The UPDRS was conducted by a movement disorders neurologist blinded to the purpose of the study. Regression analyses were performed between the rigidity score and the average percent signal change in the left primary motor cortex and the right cerebellum to study the relation between rigidity and hyperactivation in these two areas. The relation between rigidity and hypoactivation of the putamen was also tested.
Relation between hyperactivation and upper limb bradykinesia
The relation between upper limb bradykinesia and hyperactivation was also examined. We calculated the total score from the motor section of the UPDRS only including questions related to upper limb bradykinesia of the right hand (finger taps, hand movements, and rapid alternating movements). Since we report the data from the right limb, the maximum possible score was 12. The bradykinesia scores for the right upper limb are presented in Table 1. Regression analyses were performed between the bradykinesia score and the average percent signal change in the left primary motor cortex and the right cerebellum.
Results
Behavioral performance
The mean IRIs of the 900 ms and 2400 ms tasks are summarized in Figure 1A for both groups. As expected, there was a significant effect of task on the mean IRI, (F(1,7) = 53810, p < 0.0001). However, there was no effect of group on the mean IRI, (F(1,7) = 0.21, p = 0.66). No group by task interaction was detected, (F(1,7) = 1.12, p = 0.33). Similarly, the standard deviation of IRIs did not show significant differences between groups, (F(1,7) = 0.01, p = 0.94) (Figure 1B). Both groups had a significant increase in variability during the 2400 ms compared with the 900 ms task, (F(1,7) = 70.06, p < 0.0001). There was no group by task interaction for the standard deviation of IRI, (F(1,7) = 0.01, p = 0.94). Figure 1C shows the amount of time that subjects maintained their thumb on the button. There was a significant effect of task, (F(1,7) = 9.28, p < .05), but the effect of group, (F(1,7) = 3.38, p = .11), and the group by task interaction, (F(1,7) = 0.25, p = .63), were not significant. These findings show that patients with PD were able to perform the two types of movements with the required time intervals similarly to healthy controls. Both groups had increased variability and increased button pressing time during the 2400 ms task compared to the 900 ms task. These two latter findings testify to the different task demands and performance in the 900 ms and 2400 ms movements.
Figure 1.
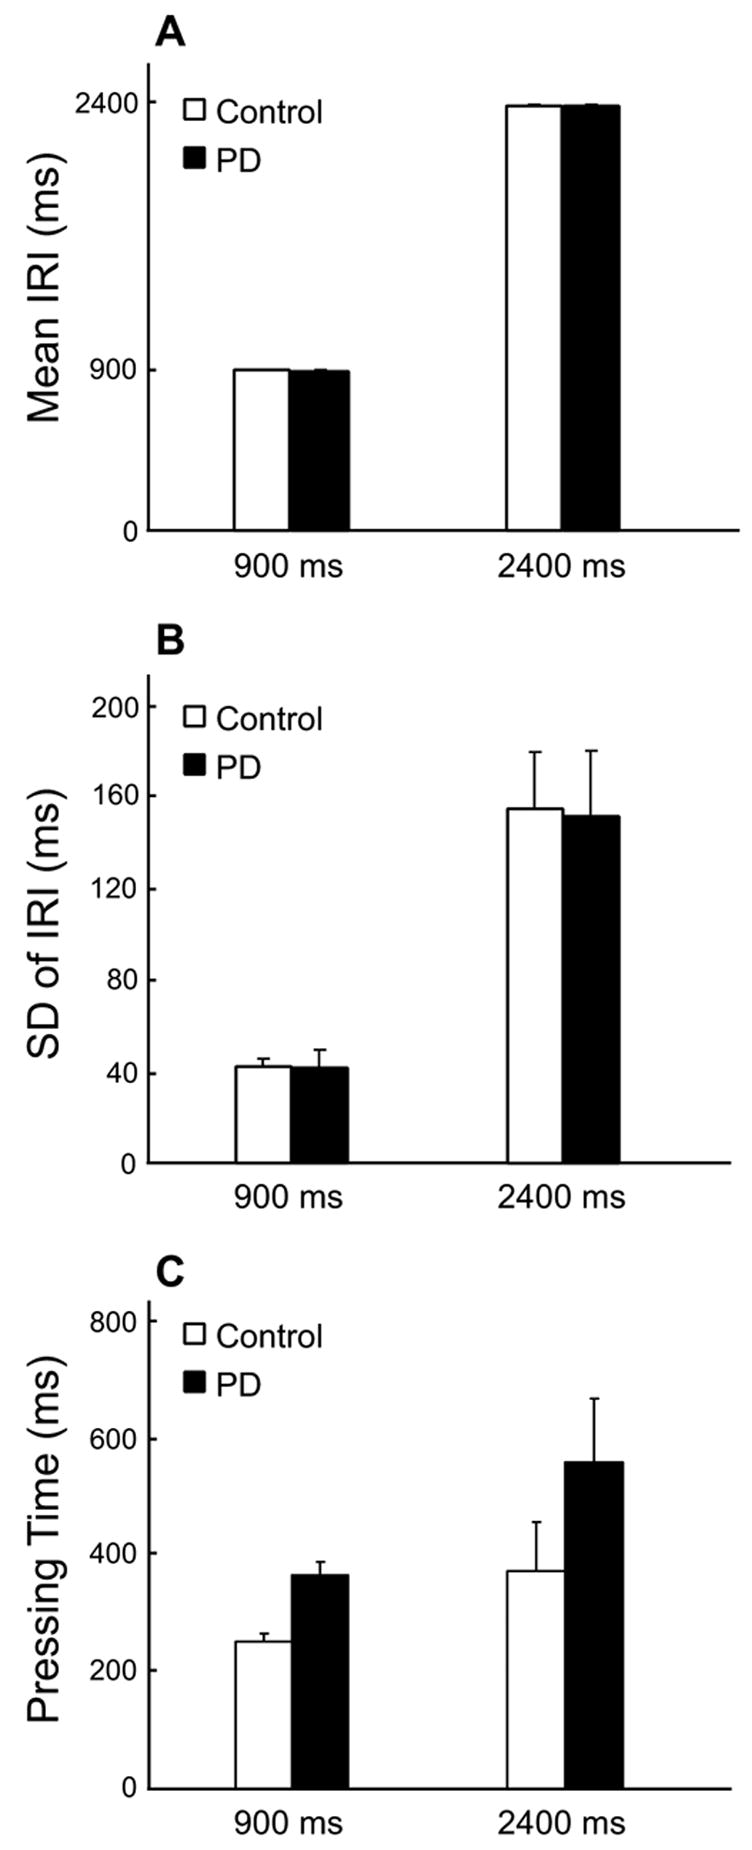
Behavioral performance for PD patients and healthy individuals. A) Mean IRIs for the 900 ms and 2400 ms conditions. The mean IRIs did not significantly differ between patients and controls in either 900 ms or 2400 ms conditions. B) The standard deviations of IRI for the 900 ms and 2400 ms conditions. C) The mean time period that subjects pressed the button with their thumb during 900 ms and 2400 ms conditions. The error bars represent the standard error between subjects. Similarly, there was no significant between-group difference in either condition. The standard deviation increased from 900 ms to 2400 ms condition in both patient and healthy group (p < 0.0001).
fMRI: Within-group analysis
The brain regions where task-related activation was found for healthy controls and PD patients are listed in Table 2. For controls, significant activation during 900 ms movements was observed in the left sensorimotor cortex (SMC) and left S1, the left pre-SMA and SMA, left cingulate motor area (CMA), left and right pre-PMd, left PMd, left and right PMv, left and right inferior parietal lobule (IPL), left and right superior temporal gyrus (STG), and left and right insula. Significant activation was also found in the left and right thalamus, left and right caudate, left and right putamen, left globus pallidus external segment (GPe), and the left and right cerebellum (Table 2, Figure 2).
Table 2.
Activated brain regions in healthy subjects and PD patients.
| Regions & Hemisphere | Talairach Coordinates
|
Volume | Talairach Coordinates
|
Volume | Talairach Coordinates
|
Volume | Talairach Coordinates
|
Volume | |||||||||||||
|---|---|---|---|---|---|---|---|---|---|---|---|---|---|---|---|---|---|---|---|---|---|
| x | y | z | Mean t | (ml) | x | y | z | Mean t | (ml) | x | y | z | Mean t | (ml) | x | y | z | Mean t | (ml) | ||
| 900 ms Control | PD | 2400 ms Control | PD | ||||||||||||||||||
| SMC | L | −41 | −16 | 51 | 5.4 | 1.9 | −41 | −22 | 52 | 5.6 | 2.9 | −44 | −20 | 49 | 5.5 | 2.9 | −43 | −20 | 46 | 5.8 | 4.0 |
| S1 | L | −51 | −25 | 34 | 5.6 | 1.8 | −30 | −31 | 54 | 5.3 | 0.5 | ||||||||||
| R | 52 | −22 | 34 | 5.7 | 1.6 | ||||||||||||||||
| Pre-SMA | L | −7 | 6 | 50 | 5.3 | 0.4 | −5 | 5 | 49 | 5.5 | 0.6 | 5 | 5 | 51 | 5.8 | 0.7 | |||||
| R | 7 | 6 | 52 | 5.7 | 1.1 | ||||||||||||||||
| SMA | L | −6 | −9 | 57 | 5.6 | 1.2 | −3 | −15 | 51 | 5.4 | 0.5 | −5 | −9 | 57 | 5.5 | 3.0 | −3 | −11 | 55 | 5.7 | 2.5 |
| R | 3 | −7 | 58 | 6.0 | 0.5 | 5 | −8 | 59 | 5.7 | 2.3 | 5 | −7 | 56 | 6.5 | 1.9 | ||||||
| CMA | L | −3 | −2 | 43 | 6.2 | 0.3 | −4 | 3 | 42 | 6.1 | 0.6 | −5 | 5 | 41 | 5.5 | 0.6 | |||||
| R | 6 | 6 | 41 | 5.7 | 0.7 | ||||||||||||||||
| prePMd | L | −43 | 0 | 50 | 5.4 | 0.7 | |||||||||||||||
| R | 43 | 7 | 45 | 5.3 | 0.9 | 49 | 3 | 46 | 5.7 | 0.8 | 46 | 0 | 47 | 5.3 | 0.4 | ||||||
| PMd | L | −49 | −5 | 46 | 6.3 | 0.5 | −46 | −6 | 44 | 5.8 | 0.4 | ||||||||||
| R | 50 | −4 | 44 | 5.8 | 0.5 | ||||||||||||||||
| DLPFC | R | 37 | 43 | 34 | 5.7 | 2.6 | |||||||||||||||
| PMv | L | −47 | 9 | 18 | 5.4 | 1.4 | −55 | 4 | 15 | 5.5 | 0.5 | −48 | 7 | 17 | 5.6 | 3.0 | −54 | 4 | 17 | 5.6 | 1.1 |
| R | 49 | 9 | 21 | 5.4 | 2.7 | 50 | 3 | 12 | 5.4 | 0.7 | 53 | 9 | 12 | 5.8 | 1.4 | ||||||
| IPL | L | −49 | −41 | 36 | 5.7 | 7.6 | −52 | −42 | 33 | 5.4 | 3.6 | −48 | −37 | 24 | 5.8 | 0.5 | |||||
| R | 58 | −33 | 28 | 5.9 | 2.2 | 55 | −39 | 43 | 5.5 | 0.9 | 56 | −35 | 31 | 5.4 | 1.8 | 46 | −38 | 37 | 6.0 | 3.6 | |
| STG | L | −51 | −31 | 10 | 6.7 | 8.8 | −53 | −31 | 9 | 6.2 | 5.2 | −53 | −34 | 11 | 5.8 | 5.5 | −54 | −32 | 11 | 6.2 | 4.5 |
| R | 55 | −23 | 9 | 6.3 | 4.9 | 58 | −25 | 7 | 5.8 | 1.8 | 57 | −33 | 11 | 5.2 | 2.2 | 54 | −29 | 8 | 5.7 | 2.8 | |
| Insula | L | −38 | −13 | 10 | 5.8 | 5.1 | −41 | 6 | 8 | 5.4 | 1.3 | ||||||||||
| R | 39 | −18 | 9 | 6.0 | 2.3 | 40 | 14 | 8 | 5.5 | 2.4 | 43 | 9 | 7 | 5.6 | 0.5 | ||||||
| Thalamus | L | −13 | −18 | 11 | 6.5 | 5.3 | −10 | −17 | 10 | 5.7 | 0.4 | −12 | −20 | 9 | 5.1 | 0.5 | −10 | −19 | 8 | 5.9 | 1.1 |
| R | 12 | −15 | 11 | 5.7 | 3.1 | 4 | −15 | 10 | 5.4 | 0.3 | 14 | −15 | 10 | 5.4 | 0.5 | ||||||
| Putamen | L | −26 | −4 | 6 | 5.6 | 1.9 | −25 | −5 | 7 | 5.0 | 0.4 | ||||||||||
| R | 24 | 1 | 9 | 5.4 | 0.9 | ||||||||||||||||
| Caudate | L | −15 | 0 | 21 | 6.2 | 0.6 | |||||||||||||||
| R | 16 | 1 | 19 | 5.7 | 0.7 | ||||||||||||||||
| GPe | L | −23 | −8 | 4 | 5.7 | 1.0 | −21 | −5 | 6 | 5.1 | 0.4 | ||||||||||
| R | 17 | 0 | 8 | 5.6 | 0.3 | ||||||||||||||||
| Cerebellum | R | 13 | −64 | −17 | 5.5 | 6.5 | 31 | −69 | −28 | 6.0 | 10.4 | 22 | −53 | −24 | 5.9 | 5.3 | 21 | −57 | −25 | 5.9 | 8.2 |
| L | −16 | −61 | −22 | 5.5 | 3.3 | −23 | −66 | −24 | 5.4 | 2.5 | −20 | −65 | −23 | 5.5 | 2.9 | −24 | −60 | −29 | 5.9 | 6.9 | |
| Vermis | 0 | −57 | −14 | 5.3 | 1.4 | 0 | −60 | −19 | 5.7 | 1.1 | |||||||||||
CMA: cingulate motor area; DLPFC: dorsolateral prefrontal cortex; GPe: globus pallidus external segment; IPL: inferior parietal lobule; PMd: dorsal premotor cortex; PMv: ventral premotor cortex; S1: primary sensory cortex; SMA: supplementary motor area; SMC: sensorimotor cortex; STG: superior temporal gyrus.
Figure 2.
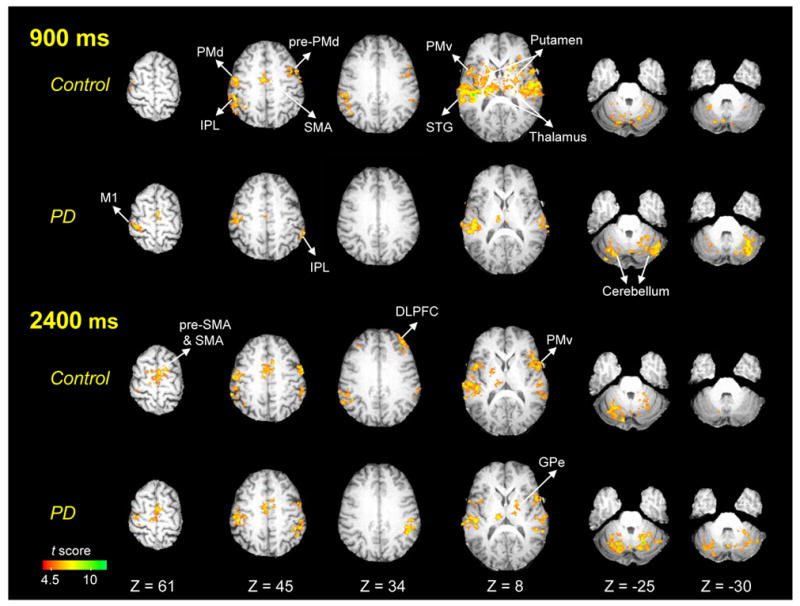
Within-group functional maps for healthy individuals and PD patients in 900 ms and 2400 ms conditions (p < 0.05, corrected). Images are in neurological orientation (left is left). L = left; DLPFC = dorsolateral prefrontal cortex; GPe = globus pallidus external segment; IPL = inferior parietal lobule; M1 = primary motor cortex; PMd = dorsal premotor cortex; PMv = ventral preomtor cortex; SMA = supplementary motor area; STG = superior temporal gyrus.
PD patients had fewer significantly activated regions during 900 ms movements than healthy individuals (Table 2, Figure 2). Significant activation for PD patients was only found in the left SMC, left and right SMA, left PMv, right IPL, left and right STG, left and right thalamus, and left and right cerebellum.
In healthy controls, 2400 ms movements activated the left and right pre-SMA and SMA, and the activation volume in these areas was larger compared to the 900 ms task (Table 2, Figure 2). In addition, there was significant functional activation in the right dorsolateral prefrontal cortex (DLPFC) during 2400 ms that was not seen in the 900 ms task. In contrast, the activation volume in the left putamen and left GPe was reduced during the 2400 ms task compared to the 900 ms task. The activation in the left and right caudate did not reach significance during the 2400 ms task.
PD patients also had increased activation in the left pre-SMA and left and right SMA during 2400 ms compared with 900 ms. However, PD patients did not have increased activation in the right DLPFC as found in healthy individuals during 2400 ms movements (Table 2, Figure 2).
ROI analysis
The statistical results from the group by task ANOVAs for each ROI region are listed in Table 3. We first describe the between group differences where PD patients were hypoactive compared to controls. Next, we describe the hyperactive regions in PD patients compared to controls. Finally, we describe the task effects and interactions.
Table 3.
Statistical results for the ROI analysis.
| Regions & Hemisphere | Center of Mass in Talairach | Group Effect | Task Effect | Interaction | |||
|---|---|---|---|---|---|---|---|
| M1 | L | −32 | −24 | 63 | <0.05 (PD > Control) | 0.51 | 0.21 |
| Pre-SMA | L | −10 | 5 | 50 | <0.05 | 0.29 | 0.49 |
| R | 8 | 5 | 51 | <0.05 | <0.05 | 0.71 | |
| SMA | L | −10 | −2 | 52 | <0.01 | 0.32 | 0.65 |
| R | 9 | −5 | 57 | 0.38 | <0.05 | 0.39 | |
| DLPFC | R | 39 | 42 | 33 | <0.01 | 0.06 | 0.07 |
| Caudate | L | −14 | 2 | 21 | 0.10 | 0.40 | 0.09 |
| R | 14 | −3 | 20 | <0.005 | 0.34 | 0.39 | |
| Putamen | L | −24 | −1 | 7 | <0.05 | 0.21 | 0.56 |
| R | 22 | −8 | 11 | 0.07 | 0.22 | <0.05 | |
| GPe | L | −20 | 1 | 4 | 0.09 | 0.37 | 0.95 |
| Cerebellum | L | −27 | −64 | −32 | <0.05 (PD > Control) | 0.32 | 0.12 |
| R | 39 | −55 | −29 | <0.001 (PD > Control) | 0.88 | 0.71 | |
Between-group difference: Hypoactivation in PD patients
PD patients had significant hypoactivation in six ROI regions (Table 3). They were the left and right pre-SMA, the left SMA, the right DLPFC, the right caudate and the left putamen (Figure 3). The percent signal change in these regions was significantly lower in PD patients compared to healthy controls in both 900 ms and 2400 ms tasks. In the right DLPFC, the percent signal change of healthy subjects increased from 900 ms to the 2400 ms task, but it remained approximately the same for PD patients. This different activation pattern in the right DLPFC led to a group by task interaction that was close to significance, p = 0.07. These findings support hypothesis 1 that the putamen and mesial cortical areas are hypoactive in patients with PD during both automatic and cognitively controlled timing.
Figure 3.
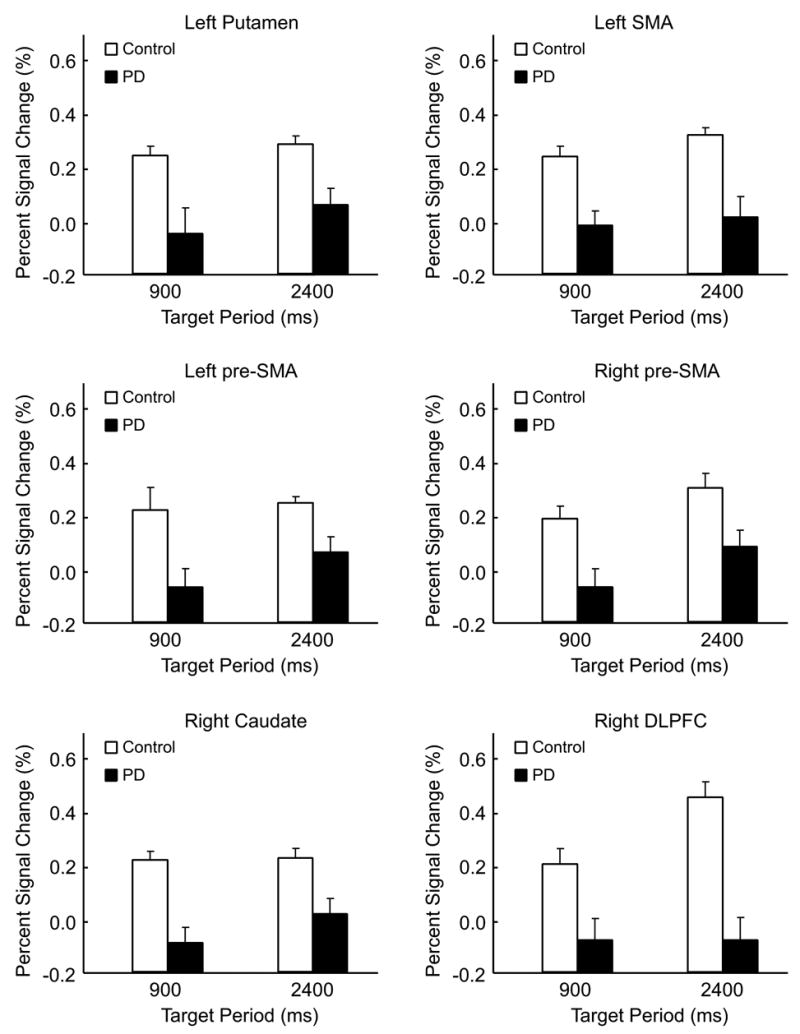
Hypoactivation in PD patients compared to healthy individuals in the left putamen, left SMA, left and right pre-SMA, right caudate, and the right DLPFC (p’s < 0.05). For each region of interest, the percent signal change in PD patients was lower than healthy individuals in both 900 and 2400 ms conditions. No group by period interaction was found.
Between-group difference: Hyperactivation in PD patients
PD patients had hyperactivation in the left and right cerebellar hemispheres and the left primary motor cortex (Table 3, Figure 4). Figure 4A demonstrates that the right cerebellum had significantly higher percent signal change in PD patients in both period conditions. Brain images in Figure 4 show that the region with hyperactivation in PD patients is located in the right superior semi-lunar lobule (or Crus I) of the cerebellar hemisphere. The hyperactivation in the left cerebellum is seen more in the inferior semi-lunar lobule (or Crus II). These findings support hypothesis 1 that the cerebellar hemispheres and primary motor cortex are hyperactive in patients with PD during automatic and cognitively controlled timing.
Figure 4.
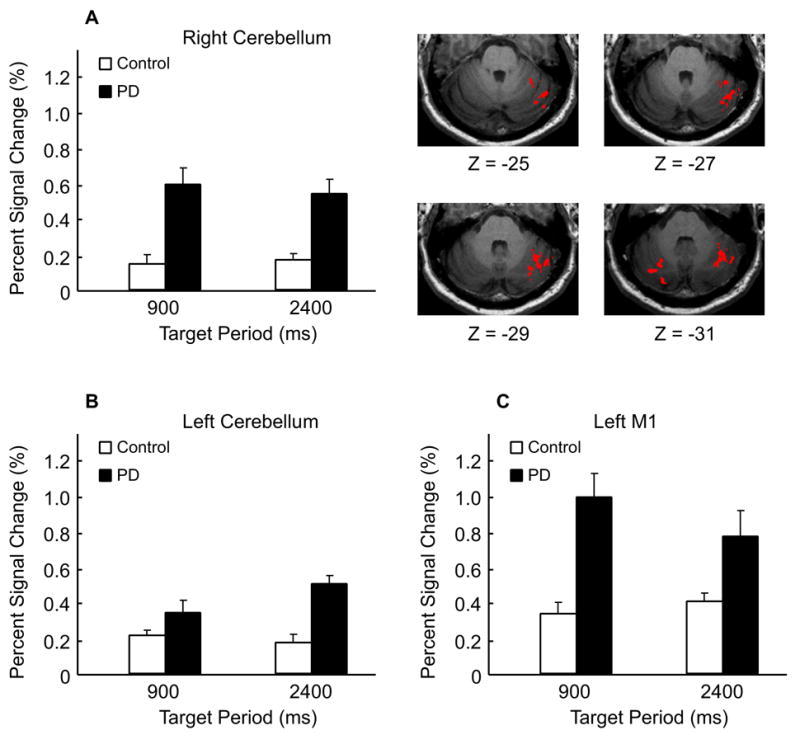
Hyperactivation in PD patients compared to healthy individuals in the left and right cerebellum and the left primary motor cortex (p’s < 0.05). The image indicates that the cerebellar regions with hyperactivation in PD patients are located in the superior semi-lunar lobule and the inferior semi-lunar lobule for the right and left cerebellum respectively. There was no group by period interaction found in the left and right cerebellum and the left primary motor cortex.
Period effects and interaction
There was a main effect of task in the right pre-SMA and SMA. In both groups, the percent signal change in these two areas significantly increased from 900 ms to the 2400 ms task. A group by task interaction was found in the right putamen, where PD patients had an increased activation in the right putamen during 2400 ms task but healthy individuals did not. Since the focus of our ROI analysis was on the disease-related effects, we used the ROI mask that revealed robust between-group differences. This mask may not have included the areas where task effects occurred, and therefore our effects for task were minimal in Table 3. Thus, the findings regarding task effects and interactions from the ROI analysis should be interpreted carefully. Indeed, there were clear differences between tasks as shown in Figure 2 and Table 2 that were consistent with previous work (Lewis and Miall, 2003; Schaal et al., 2004) but did not occur in the ROI analysis.
Relation between hypo- and hyper- activation
Pearson’s correlation analyses were performed on the left caudate, putamen, GPe, pre-SMA, SMA, primary motor cortex, and ipsilateral right cerebellum for PD patients (Table 4). There was a significant negative correlation between the percent signal change of the right cerebellum and the left putamen (r = −0.56), the right cerebellum and the left GPe (−0.51), as well as the right cerebellum and the left pre-SMA (-0.57) (p’s < 0.05). A control analysis using the left cerebellum (not shown in Table 4) failed to show significant correlations with the left putamen, GPe, and the pre-SMA, with Pearson’s correlation coefficient equal to −0.12, −0.25, and −0.21, respectively. In addition, a control analysis in healthy individuals between the right cerebellum compared with the left putamen (−0.12), GPe (−0.25), and pre-SMA (0.11) also failed to show significant correlations (p’s > .05). In patients with PD, Table 4 shows that the activation in the left primary motor cortex also failed to show significant correlations with other brain regions. Significant positive correlations were found between the left putamen and GPe (0.93), putamen and pre-SMA (0.85), and GPe and pre-SMA (0.81) (p’s < 0.05). In summary, these findings are consistent with hypothesis 2 that the cerebellar hyperactivation may be compensating for the hypoactive putamen, and suggest that the motor cortex hyperactivation may not be related to compensation.
Table 4.
Correlation matrix.
| L Caudate | L Putamen | L GPe | L pre-SMA | L SMA | L M1 | R Cerebellum | |
|---|---|---|---|---|---|---|---|
| L Caudate | 1.00 | ||||||
| L Putamen | 0.47 | ||||||
| L GPe | 0.41 | *0.93 | |||||
| L pre-SMA | 0.44 | *0.85 | *0.81 | ||||
| L SMA | 0.27 | 0.28 | 0.18 | 0.50 | |||
| L M1 | −0.37 | 0.16 | 0.03 | 0.16 | 0.21 | ||
| R Cerebellum | 0.06 | *−0.56 | *−0.51 | *−0.57 | -0.07 | -0.04 | 1.00 |
p < 0.05
Relation between hyperactivation and limb rigidity
Figure 5A shows the group map for the regions of the motor cortex that displayed greater activation in patients with PD compared with healthy control subjects. Figure 5B shows the percent signal change in the left primary motor cortex in all PD patients against their rigidity score (UPDRS motor) of the right upper extremity. The horizontal solid line in Figure 5B represents the average percent signal change of the left M1 in healthy controls, and the dotted lines represent the standard error. Brain images show that the region where correlations were found in patients resides in the upper portion of the precentral gyrus. Regression analysis indicates a significant linear relation between the percent signal change in the left primary motor cortex and rigidity in PD patients (r = 0.85, p < .05). This finding suggests that increased limb rigidity is related to increased activation found in the primary motor cortex. Although the button pressing time was not significantly different between PD patients and control, it is possible that the slightly elevated pressing time could have influenced the percent signal change in the motor cortex (Figure 1C). Therefore, we examined the correlation between button pressing time and percent signal change in the motor cortex, but this was not significant (p > 0.3). Thus, the relation between rigidity and percent signal change in motor cortex was likely not due to a task-related behavioral covariate.
Figure 5.
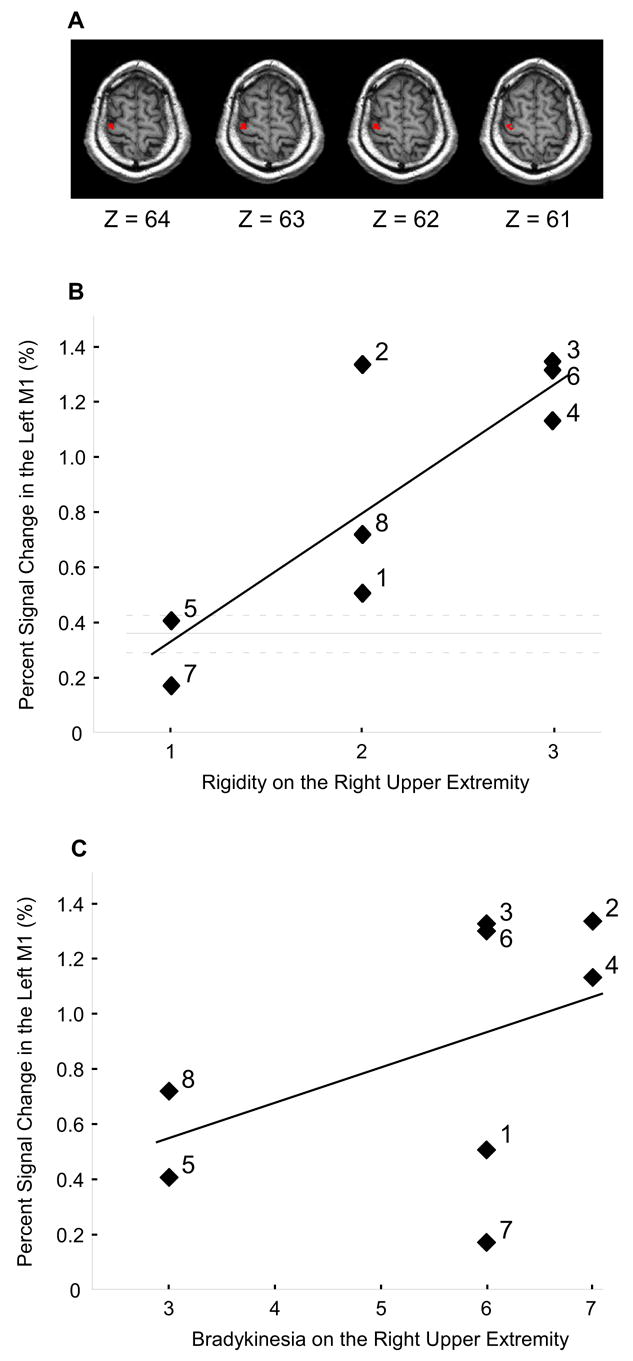
The correlation between hyperactivation in the left primary motor cortex with rigidity and bradykinesia in PD patients. A) Regions in the left M1 where PD patients had hyperactivation. B) The percent signal change in the left M1 against the rigidity score of the right upper limb in PD patients. Each percent signal change value is the average across the 900 ms and 2400 ms conditions. The horizontal solid line represents the average percent signal change of the left M1 in healthy individuals, and the dotted lines represent the standard error. A significant linear relation was found between the percent signal change in the left M1 and the rigidity score in patients (r = 0.85, p < 0.05). The number by each symbol corresponds to the patient number in Table 1. C) The percent signal change in the left M1 against the bradykinesia score from the right upper limb in PD patients. The bradykinesia score included ratings from the finger taps, hand movements, and rapid alternating movements. The linear relation was not significant (r = 0.48, p = 0.23). The number by each symbol corresponds to the patient number in Table 1.
The relation between rigidity and the percent signal change in PD patients was also tested in the right cerebellum to determine whether the relation observed in the motor cortex was specific or generalizable. The result indicated that rigidity did not correlate with the hyperactivation in the right cerebellum with the r value equal to 0.02. Also, there was no significant correlation between rigidity and the hypoactivation in the left putamen (r = 0.1). These results are consistent with hypothesis 3 that rigidity was related to the hyperactive BOLD signal in the motor cortex, and was not related to other motor regions.
Relation between hyperactivation and limb bradykinesia
The relation between hyperactivation and upper limb bradykinesia was also examined (Figure 5C). Figure 5C indicates that the slope between bradykinesia and the percent signal change in the motor cortex was positive. However, the relation between motor cortex and bradykinesia was more variable than the analysis for rigidity, and the regression analysis for bradykinesia resulted in a non-significant correlation (r = 0.48, p = 0.23). The correlation between the hyperactive right cerebellum and upper limb bradykinesia was also non-significant (r = −0.30, p = 0.47). The numbers in the graphs refer to subject numbers and make evident that the relation between M1 hyperactivation and the scores for rigidity and bradykinesia were different across subjects.
Discussion
This study determined functional correlates for hyperactivation in the cerebellum and primary motor cortex in patients with PD. There were three important findings. First, we have confirmed previous findings that in PD patients compared with healthy individuals the contralateral putamen has reduced BOLD activation, whereas the ipsilateral cerebellum and the contralateral motor cortex have increased BOLD activation. The novel contribution of this study is that we have also shown that these same findings occur in two tasks that require either periodic, i.e. relatively automatic movements, or discrete movements that require initiation and termination and are more under cognitive control with increased demands on cortical and subcortical areas (Lewis and Miall, 2003; Schaal et al., 2004). Second, there was a significant negative correlation between the BOLD activation of the ipsilateral cerebellum and the contralateral putamen, and this relation only occurred in PD patients. In contrast, the BOLD activation in the motor cortex was not correlated with the BOLD activation in the putamen. Third, the BOLD activation in the contralateral primary motor cortex was positively correlated with the severity of limb rigidity in PD patients, but not significantly correlated with upper limb bradykinesia. These findings provide some evidence that helps to disentangle the functional correlates of compensation and impaired suppression of the ipsilateral cerebellum and motor cortex in PD, and their relationship to the motor deficits of PD.
Hypoactivation in the putamen and mesial frontal areas
This study provided evidence that PD patients had hypoactivation in the left putamen, pre-SMA and SMA, and that the hypoactivation occurred across both task conditions (Figure 3). The basal ganglia system has several segregated circuits to facilitate a variety of motor and cognitive behaviors (Alexander et al., 1990; Alexander et al., 1986). The motor circuit is primarily composed of projections from the putamen to the thalamus, via the direct and indirect basal ganglia circuits, which then project to the SMA, premotor, and primary motor cortex. In PD, it has been shown that the reduction in dopamine uptake is most severe in the posterior putamen (Thobois et al., 2004), and the region of interest used in the current study was in the middle to posterior portion of the putamen. According to the classic basal ganglia model (Albin et al., 1989; DeLong, 1990), the pathological changes in PD cause excessive inhibitory outflow from the basal ganglia to thalamo-cortical areas, thereby significantly reducing the activation in mesial cortical areas. The hypoactivation in the putamen, pre-SMA, and SMA has been shown in previous imaging studies in PD patients (Buhmann et al., 2003; Jahanshahi et al., 1995; Playford et al., 1993; Rascol et al., 1997). In addition, Buhmann et al. (2003) also showed that the hypoactivation in the SMA was normalized after the administration of levodopa, indicating that the reduced cortical activation is secondary to dopamine deficiency. Previous work using PET has also shown that deep brain stimulation of the subthalamic nucleus increases the activation of mesial cortical areas (Grafton et al., 2006). Our findings extend this previous work by showing that the putamen is hypoactive during both automatic and cognitively controlled timing movements.
Compensation and hyperactivation in the cerebellum
The current study found that the left and right cerebellum had significantly higher activation in PD patients compared to age-matched healthy individuals during both tasks (Figures 2 and 4, Table 3). This finding extends two previous neuroimaging studies that have reported hyperactivation in the cerebellum. A SPECT study by Rascol and colleagues (1997) was the first to report greater activation in the ipsilateral cerebellum in PD patients compared to controls during a sequential finger-to-thumb opposition task. In addition, the authors found that the ipsilateral cerebellum was markedly active in PD patients when off antiparkinsonism medication, but not when patients were on medication. A recent fMRI study by Wu and Hallett (2005) also revealed hyperactivation in the cerebellum bilaterally in PD patients when performing sequential finger tapping movements. In contrast to studies that have found the cerebellum to be hyperactive, there is also evidence that the cerebellum in PD patients is hypoactive during a visual tracking task (Turner et al., 2003). In the current study, we examined thumb pressing movements paced by auditory tones, which is more in line with the sequential finger movement tasks used by Rascol and colleagues and Wu and Hallett. The current study was not directly designed to resolve this issue and it remains possible that whether the cerebellum is hypoactive or hyperactive is task specific and may also depend on the feedback modality (Turner et al., 2003).
It has been proposed that the hyperactivation in the cerebellum of PD patients is a mechanism of functional compensation for a defective basal ganglia (Rascol et al., 1997; Wu and Hallett, 2005). In the current study, we provide new evidence that supports this hypothesis by showing that there is a negative correlation between the activation of the ipsilateral cerebellum and the contralateral putamen (Table 4). In addition, we found that the means and standard deviations of the inter-response intervals were not different between healthy individuals and PD patients when producing automatic movements at a rate of 900 ms and during cognitively controlled movements at an average rate of 2400 ms (Figure 1). This finding regarding similar performance is consistent with previous studies in PD patients that have used inter-response intervals 666 ms, 1000 ms, 2000 ms, and 3000 ms (Jahanshahi et al., 1995; Pastor et al., 1992). It should be noted that at intervals faster than 600 ms, PD patients have been shown to have deficits in performance (Pastor et al. 1992; Harrington et al. 1998). Several studies have pointed out the critical role of the basal ganglia in producing time intervals (Harrington et al., 1998; O’Boyle et al., 1996; Wing et al., 1984), and there is also evidence indicating the involvement of the cerebellum in movement timing (Ivry and Keele, 1989; Jueptner et al., 1995; Penhune et al., 1998). Our findings are consistent with a model where both structures exert control over the production of timing intervals, and one can compensate for the other in a pathological state.
This raises the issue as to how the activation in the cerebellum and putamen are correlated and how the cerebellum may achieve compensation? We speculate on two possibilities that may not be mutually exclusive. First, we suggest that compensation could be achieved through the cerebellar-thalamo-cortical loop. For instance, the basal ganglia and cerebellum are thought to have distinct loops connecting with largely overlapping cortical areas (Middleton and Strick, 2000). In monkeys, it has been shown that the internal segment of the globus pallidus and the dentate nuclei, via different nuclei of the thalamus, project to the same arm area in the primary motor cortex (Middleton and Strick, 2000). Second, we suggest that compensation could occur more directly through projections from the cerebellum to the basal ganglia. For instance, recent evidence in monkeys indicates that the dentate nucleus communicates via a disynaptic connection with the input stage of basal ganglia processing in the striatum (Hoshi et al., 2005). This finding in monkeys supported previous work in the rat (Ichinohe et al., 2000). This pathway occurs through contralateral projections from the dentate nucleus, and is consistent with our result that only the ipsilateral cerebellum (ie. not the contralateral cerebellum) was negatively correlated with the contralateral putamen (Table 4). At the end of their discussion, Hoshi and colleagues (2005) posed an open-ended question (page 1493): “When basal ganglia activity is abnormal, is the cerebellum part of the problem or part of the solution?” Since our behavioral data were not different between patients with PD and control subjects and putamen activation was reduced in patients with PD, we hypothesize that the hyperactivation in the cerebellum may have been part of the solution in minimizing behavioral differences. This reasoning is additionally supported by the fact that the cerebellum has been discussed as an essential locus for timing. However, our data are not conclusive and further research is necessary to determine if cerebellum activation is a natural consequence of the pathophysiology in PD, or a consequence of compensatory mechanisms.
Rigidity, bradykinesia, and hyperactivation in the primary motor cortex
The current study found that the primary motor cortex was hyperactive in PD patients compared with healthy controls during both automatic and cognitively controlled movements (Figures 2 and 4, Table 3). The finding that the motor cortex is hyperactive extends previous studies in PD patients on sequential movements (Sabatini et al., 2000; Thobois et al., 2000), and single joystick movements (Haslinger et al., 2001). In contrast, using fMRI Buhmann and colleagues (2003) found that in drug naïve PD patients the primary motor cortex was hypoactive during an auditory-paced random finger opposition task, and the activation increased after L-dopa intake. The findings of Buhmann and colleagues are consistent with the standard rate model of the basal ganglia-thalamo-cortical loop. In addition, these authors also suggested that a functional reorganization of the primary motor cortex may occur after prolonged dopamine treatment. This is consistent with the view that the motor cortex is overactive in PD patients to compensate for the deficient basal ganglia function (Sabatini et al., 2000; Thobois et al., 2000). We did not find a significant correlation between the task-related BOLD activation of the primary motor cortex and the putamen (Table 4). Although not conclusive, this finding suggests that compensation may not be a mechanism for the observed hyperactivation in the primary motor cortex.
An alternative hypothesis is that the hyperactivation in the primary motor cortex is related to specific cardinal signs of the disease. Similar to the current experiment, the three studies that found hyperactivation in the primary motor cortex used akinetic-rigid patients without major tremor (Haslinger et al., 2001; Sabatini et al., 2000; Thobois et al., 2000). Thus, the abnormal pattern in the motor cortex is unlikely due to tremor because our patients either had minimal or no clinically observable tremor (Table 1). However, the abnormal pattern could have potentially been associated with rigidity. For example, TMS studies have shown that there is defective cortico-cortical inhibition in motor cortex excitability (Kleine et al., 2001; Pierantozzi et al., 2001; Ridding et al., 1995). This causes a diffused and increased response in the motor cortex that possibly underlies rigidity (Cantello et al., 1991). In the current study, all of our patients had rigidity in the right upper limb ─ UPDRS scores from 1 to 3. In addition, one of the key findings in this study showed that increased rigidity correlated positively with increased BOLD activation in the contralateral primary motor cortex in PD patients (Figure 5B). Control analyses showed that the BOLD activation in the motor cortex was not related to the button pressing time in PD patients, suggesting that a covariate of the behavior was not driving this relation. We agree with the suggestion that early in the disease prior to the dopamine treatment the primary motor cortex may be hypoactive and that as the disease progresses the motor cortex may reorganize (Buhmann et al., 2003). In addition, our data suggest that after the disease progresses the hyperactivation of the primary motor cortex activity is related to limb rigidity. It remains possible that early in the disease the BOLD activation in the motor cortex may be related to rigidity, and this issue will have to be resolved further in future work. Nevertheless, the current findings are important because they are in contrast to previous suggestions that the motor cortex may not play a significant role in rigidity (Delwaide et al., 2000). It remains to be determined if rigidity is mediated via the corticospinal tract or through subcortical projections from the basal ganglia to the motor neuron pool via the brain stem (Delwaide et al., 2000).
One of the interesting findings in this study was that although right upper limb rigidity was correlated positively with the percent signal change in the left motor cortex, no similar effect was found for upper limb bradykinesia. The correlation was moderate and positive, but not significant due to high variability between patients (Figure 5C). While the relation between bradykinesia and motor cortex was not as strong as the relation between rigidity and motor cortex, we postulate that this could change if the task demands were different. The current study purposefully investigated a task that minimized the influence of bradykinesia because we wanted to ensure that patients with PD could perform the task without major complications. This experimental strategy could have biased the signal changes in the motor cortex against a potential correlation with bradykinesia. This view is consistent with the proposal of Turner and colleagues (2003) that parkinsonian abnormalities in brain activity depend on the nature of the task being performed. Buhmann and colleagues (2003) previously showed that the BOLD signal in the motor cortex was positively related to the number of movements, suggesting that the level of bradykinesia may be negatively related to the BOLD signal in the motor cortex. The task used by Buhmann and colleagues was a maximal performance task, which is more suited for maximizing the effects of bradykinesia on motor performance. Thus, it is possible that in the same patients the signal intensity in the motor cortex could be negatively correlated with bradykinesia and positively correlated with rigidity depending the patient signs and tasks chosen to accentuate those signs.
This discussion is also interesting in the context of pathophysiological models of basal ganglia function. The rate model predicts that due to dopamine depletion, there is a reduction in the excitatory thalamic outflow to the frontal lobe thereby reducing the rate of change of the descending commands (Albin et al. 1989; Delong, 1990). The model predicts that bradykinesia would occur in PD, in that reducing the excitatory inputs to the motor cortex would slow movements. The model also predicts that levodopa and deep brain stimulation can alleviate bradykinesia (Brown et al., 1999; Vaillancourt et al., 2004). However, the model does not explain hyperactivation in the motor cortex or how changing the task demands could alter the correlation between the motor cortex and different signs of PD. An alternative model of basal ganglia-thalamo-cortical function is that normal outflow from the basal ganglia suppresses unwanted activity that may otherwise interfere with task performance (Mink, 1996; Penny and Young, 1983). This model is consistent with the current findings in that abnormal suppression from the basal ganglia in PD could lead to an increased release in the motor cortical neurons that leads to hyperexcitability in the motor cortex and rigidity as a sign of PD. Thus, it is possible that each of these models has particular merits in explaining certain aspects of pathophysiology in PD, and that in the end the basal ganglia-thalamo-cortical loop does not have a unique response to changes in dopamine depletion. The functioning of the basal ganglia-thalamo-cortical loop and the correlations between signs of PD is most likely altered by patient selection and changes in the tasks demands that accentuate signs of PD (Turner et al. 2003).
Acknowledgments
We thank Dr. Cindy Comella and the Movement Disorders Section at Rush University Medical Center for rating the UPDRS and helping to recruit patients for this study. This research was supported in part by grants from the National Institutes of Health (R01-NS-52318, R01-NS-28127, R01-HD-45639, R01-NS-40902), the National Science Foundation (BCS-0096543), and the Tobacco Settlement Funds (4100020604).
Footnotes
Publisher's Disclaimer: This is a PDF file of an unedited manuscript that has been accepted for publication. As a service to our customers we are providing this early version of the manuscript. The manuscript will undergo copyediting, typesetting, and review of the resulting proof before it is published in its final citable form. Please note that during the production process errors may be discovered which could affect the content, and all legal disclaimers that apply to the journal pertain.
References
- Albin RL, Young AB, Penney JB. The functional anatomy of basal ganglia disorders. Trends Neurosci. 1989;12:366–375. doi: 10.1016/0166-2236(89)90074-x. [DOI] [PubMed] [Google Scholar]
- Alexander GE, Crutcher MD, DeLong MR. Basal ganglia-thalamocortical circuits: parallel substrates for motor, oculomotor, "prefrontal" and "limbic" functions. Prog Brain Res. 1990;85:119–146. [PubMed] [Google Scholar]
- Alexander GE, DeLong MR, Strick PL. Parallel organization of functionally segregated circuits linking basal ganglia and cortex. Annu Rev Neurosci. 1986;9:357–381. doi: 10.1146/annurev.ne.09.030186.002041. [DOI] [PubMed] [Google Scholar]
- Bezard E, Crossman AR, Gross CE, Brotchie JM. Structures outside the basal ganglia may compensate for dopamine loss in the presymptomatic stages of Parkinson’s disease. FASEB J. 2001;15:1092–1094. doi: 10.1096/fj.00-0637fje. [DOI] [PubMed] [Google Scholar]
- Brown RG, Dowsey PL, Brown P, Jahanshahi M, Pollak P, Benabid AL, Rodriguez-Oroz MC, Obeso J, Rothwell JC. Impact of deep brain stimulation on upper limb akinesia in Parkinson’s disease. Ann Neurol. 1999;45:473–488. doi: 10.1002/1531-8249(199904)45:4<473::aid-ana9>3.0.co;2-v. [DOI] [PubMed] [Google Scholar]
- Buhmann C, Glauche V, Sturenburg HJ, Oechsner M, Weiller C, Buchel C. Pharmacologically modulated fMRI--cortical responsiveness to levodopa in drug-naive hemiparkinsonian patients. Brain. 2003;126:451–461. doi: 10.1093/brain/awg033. [DOI] [PubMed] [Google Scholar]
- Cantello R, Gianelli M, Bettucci D, Civardi C, De Angelis MS, Mutani R. Parkinson’s disease rigidity: magnetic motor evoked potentials in a small hand muscle. Neurology. 1991;41:1449–1456. doi: 10.1212/wnl.41.9.1449. [DOI] [PubMed] [Google Scholar]
- Ceballos-Baumann AO. Functional imaging in Parkinson’s disease: activation studies with PET, fMRI and SPECT. J Neurol. 2003;250:I15–23. doi: 10.1007/s00415-003-1103-1. [DOI] [PubMed] [Google Scholar]
- Cox RW. AFNI: software for analysis and visualization of functional magnetic resonance neuroimages. Comput Biomed Res. 1996;29:162–173. doi: 10.1006/cbmr.1996.0014. [DOI] [PubMed] [Google Scholar]
- Cox RW, Hyde JS. Software tools for analysis and visualization of fMRI data. NMR Biomed. 1997;10:171–178. doi: 10.1002/(sici)1099-1492(199706/08)10:4/5<171::aid-nbm453>3.0.co;2-l. [DOI] [PubMed] [Google Scholar]
- DeLong MR. Primate models of movement disorders of basal ganglia origin. Trends Neurosci. 1990;13:281–285. doi: 10.1016/0166-2236(90)90110-v. [DOI] [PubMed] [Google Scholar]
- Delwaide PJ, Pepin JL, De Pasqua V, de Noordhout AM. Projections from basal ganglia to tegmentum: a subcortical route for explaining the pathophysiology of Parkinson’s disease signs? J Neurol. 2000;247(Suppl 2):II75–81. doi: 10.1007/pl00007765. [DOI] [PubMed] [Google Scholar]
- Dirnberger G, Frith CD, Jahanshahi M. Executive dysfunction in Parkinson’s disease is associated with altered pallidal-frontal processing. NeuroImage. 2005;25:588–599. doi: 10.1016/j.neuroimage.2004.11.023. [DOI] [PubMed] [Google Scholar]
- Fahn S, Elton RL, Committee MotUD. Recent developments in Parkinson’s disease. Macmillan Health Care Information; Florham Park, NJ: 1987. [Google Scholar]
- Grafton ST, Turner RS, Desmurget M, Bakay R, Delong M, Vitek J, Crutcher M. Normalizing motor-related brain activity: subthalamic nucleus stimulation in Parkinson disease. Neurology. 2006;66:1192–1199. doi: 10.1212/01.wnl.0000214237.58321.c3. [DOI] [PubMed] [Google Scholar]
- Harrington DL, Haaland KY, Hermanowicz N. Temporal processing in the basal ganglia. Neuropsychology. 1998;12:3–12. doi: 10.1037//0894-4105.12.1.3. [DOI] [PubMed] [Google Scholar]
- Haslinger B, Erhard P, Kampfe N, Boecker H, Rummeny E, Schwaiger M, Conrad B, Ceballos-Baumann AO. Event-related functional magnetic resonance imaging in Parkinson’s disease before and after levodopa. Brain. 2001;124:558–570. doi: 10.1093/brain/124.3.558. [DOI] [PubMed] [Google Scholar]
- Hoshi E, Tremblay L, Feger J, Carras PL, Strick PL. The cerebellum communicates with the basal ganglia. Nat Neurosci. 2005;8:1491–1493. doi: 10.1038/nn1544. [DOI] [PubMed] [Google Scholar]
- Ichinohe N, Mori F, Shoumura K. A di-synaptic projection from the lateral cerebellar nucleus to the laterodorsal part of the striatum via the central lateral nucleus of the thalamus in the rat. Brain Res. 2000;880:191–197. doi: 10.1016/s0006-8993(00)02744-x. [DOI] [PubMed] [Google Scholar]
- Ivry RB, Keele SW. Timing functions of the cerebellum. Journal of Cognitive Neuroscience. 1989;1:136–152. doi: 10.1162/jocn.1989.1.2.136. [DOI] [PubMed] [Google Scholar]
- Jahanshahi M, Jenkins IH, Brown RG, Marsden CD, Passingham RE, Brooks DJ. Self-initiated versus externally triggered movements. I. An investigation using measurement of regional cerebral blood flow with PET and movement-related potentials in normal and Parkinson’s disease subjects. Brain. 1995;118:913–933. doi: 10.1093/brain/118.4.913. [DOI] [PubMed] [Google Scholar]
- Jueptner M, Rijntjes M, Weiller C, Faiss JH, Timmann D, Mueller SP, Diener HC. Localization of a cerebellar timing process using PET. Neurology. 1995;45:1540–1545. doi: 10.1212/wnl.45.8.1540. [DOI] [PubMed] [Google Scholar]
- Kleine BU, Praamstra P, Stegeman DF, Zwarts MJ. Impaired motor cortical inhibition in Parkinson’s disease: motor unit responses to transcranial magnetic stimulation. Exp Brain Res. 2001;138:477–483. doi: 10.1007/s002210100731. [DOI] [PubMed] [Google Scholar]
- Langston JW, Widner H, Goetz CG, Brooks D, Fahn S, Freeman T, Watts R. Core assessment program for intracerebral transplantation (CAPIT) Movement Disorders. 1992;7:2–13. doi: 10.1002/mds.870070103. [DOI] [PubMed] [Google Scholar]
- Lewis PA, Miall RC. Distinct systems for automatic and cognitively controlled time measurement: evidence from neuroimaging. Curr Opin Neurobiol. 2003;13:250–255. doi: 10.1016/s0959-4388(03)00036-9. [DOI] [PubMed] [Google Scholar]
- Middleton FA, Strick PL. Basal ganglia and cerebellar loops: motor and cognitive circuits. Brain Res Brain Res Rev. 2000;31:236–250. doi: 10.1016/s0165-0173(99)00040-5. [DOI] [PubMed] [Google Scholar]
- Mink JW. The basal ganglia: focused selection and inhibition of competing motor programs. Prog Neurobiol. 1996;50:381–425. doi: 10.1016/s0301-0082(96)00042-1. [DOI] [PubMed] [Google Scholar]
- O’Boyle DJ, Freeman JS, Cody FW. The accuracy and precision of timing of self-paced, repetitive movements in subjects with Parkinson’s disease. Brain. 1996;119:51–70. doi: 10.1093/brain/119.1.51. [DOI] [PubMed] [Google Scholar]
- Pastor MA, Jahanshahi M, Artieda J, Obeso JA. Performance of repetitive wrist movements in Parkinson’s disease. Brain. 1992;115:875–891. doi: 10.1093/brain/115.3.875. [DOI] [PubMed] [Google Scholar]
- Penhune VB, Zatorre RJ, Evans AC. Cerebellar contributions to motor timing: A PET study of auditory and visual rhythm reproduction. Journal of cognitive neuroscience. 1998;10:752–765. doi: 10.1162/089892998563149. [DOI] [PubMed] [Google Scholar]
- Penney JB, Young AB. Speculations on the functional anatomy of basal ganglia disorders. Annu Rev Neurosci. 1983;6:73–94. doi: 10.1146/annurev.ne.06.030183.000445. [DOI] [PubMed] [Google Scholar]
- Pierantozzi M, Palmieri MG, Marciani MG, Bernardi G, Giacomini P, Stanzione P. Effect of apomorphine on cortical inhibition in Parkinson’s disease patients: a transcranial magnetic stimulation study. Exp Brain Res. 2001;141:52–62. doi: 10.1007/s002210100839. [DOI] [PubMed] [Google Scholar]
- Playford ED, Jenkins IH, Passingham RE, Frackowiak RS, Brooks DJ. Impaired activation of frontal areas during movement in Parkinson’s disease: a PET study. Adv Neurol. 1993;60:506–510. [PubMed] [Google Scholar]
- Rascol O, Sabatini U, Fabre N, Brefel C, Loubinoux I, Celsis P, Senard JM, Montastruc JL, Chollet F. The ipsilateral cerebellar hemisphere is overactive during hand movements in akinetic parkinsonian patients. Brain. 1997;120:103–110. doi: 10.1093/brain/120.1.103. [DOI] [PubMed] [Google Scholar]
- Ridding MC, Inzelberg R, Rothwell JC. Changes in excitability of motor cortical circuitry in patients with Parkinson’s disease. Ann Neurol. 1995;37:181–188. doi: 10.1002/ana.410370208. [DOI] [PubMed] [Google Scholar]
- Sabatini U, Boulanouar K, Fabre N, Martin F, Carel C, Colonnese C, Bozzao L, Berry I, Montastruc JL, Chollet F, Rascol O. Cortical motor reorganization in akinetic patients with Parkinson’s disease: a functional MRI study. Brain. 2000;123:394–403. doi: 10.1093/brain/123.2.394. [DOI] [PubMed] [Google Scholar]
- Samuel M, Ceballos-Baumann AO, Blin J, Uema T, Boecker H, Passingham RE, Brooks DJ. Evidence for lateral premotor and parietal overactivity in Parkinson’s disease during sequential and bimanual movements. A PET study. Brain. 1997;120:963–976. doi: 10.1093/brain/120.6.963. [DOI] [PubMed] [Google Scholar]
- Schaal S, Sternad D, Osu R, Kawato M. Rhythmic arm movement is not discrete. Nat Neurosci. 2004;7:1136–1143. doi: 10.1038/nn1322. [DOI] [PubMed] [Google Scholar]
- Talairach J, Tournoux P. Co-Planar Stereotaxic Atlas of the Human Brain. Thieme: Stuttgard, Germany; 1988. [Google Scholar]
- Thobois S, Dominey P, Decety J, Pollak P, Gregoire MC, Broussolle E. Overactivation of primary motor cortex is asymmetrical in hemiparkinsonian patients. Neuroreport. 2000;11:785–789. doi: 10.1097/00001756-200003200-00026. [DOI] [PubMed] [Google Scholar]
- Thobois S, Jahanshahi M, Pinto S, Frackowiak R, Limousin-Dowsey P. PET and SPECT functional imaging studies in Parkinsonian syndromes: from the lesion to its consequences. Neuroimage. 2004;23:1–16. doi: 10.1016/j.neuroimage.2004.04.039. [DOI] [PubMed] [Google Scholar]
- Thulborn KR. Visual feedback to stabilize head position for fMRI. Magn Reson Med. 1999;41:1039–1043. doi: 10.1002/(sici)1522-2594(199905)41:5<1039::aid-mrm24>3.0.co;2-n. [DOI] [PubMed] [Google Scholar]
- Turner RS, Grafton ST, McIntosh AR, DeLong MR, Hoffman JM. The functional anatomy of parkinsonian bradykinesia. Neuroimage. 2003;19:163–179. doi: 10.1016/s1053-8119(03)00059-4. [DOI] [PubMed] [Google Scholar]
- Vaillancourt DE, Prodoehl J, Verhagen Metman L, Bakay RA, Corcos DM. Effects of deep brain stimulation and medication on bradykinesia and muscle activation in Parkinson’s disease. Brain. 2004;127:491–504. doi: 10.1093/brain/awh057. [DOI] [PubMed] [Google Scholar]
- Wing AM, Keele S, Margolin DI. Motor disorder and the timing of repetitive movements. Ann N Y Acad Sci. 1984;423:183–192. doi: 10.1111/j.1749-6632.1984.tb23428.x. [DOI] [PubMed] [Google Scholar]
- Wu T, Hallett M. A functional MRI study of automatic movements in patients with Parkinson’s disease. Brain. 2005;15:15. doi: 10.1093/brain/awh569. [DOI] [PubMed] [Google Scholar]