Abstract
This mini-review provides a general understanding of electrospray ionisation mass spectrometry (ESI-MS) which has become an increasingly important technique in the clinical laboratory for structural study or quantitative measurement of metabolites in a complex biological sample. The first part of the review explains the electrospray ionisation process, design of mass spectrometers with separation capability, characteristics of the mass spectrum, and practical considerations in quantitative analysis. The second part then focuses on some clinical applications. The capability of ESI-tandem-MS in measuring bio-molecules sharing similar molecular structures makes it particularly useful in screening for inborn errors of amino acid, fatty acid, purine, pyrimidine metabolism and diagnosis of galactosaemia and peroxisomal disorders. Electrospray ionisation is also efficient in generating cluster ions for structural elucidation of macromolecules. This has fostered a new and improved approach (vs electrophoresis) for identification and quantification of haemoglobin variants. With the understanding of glycohaemoglobin structure, an IFCC reference method for glycohaemoglobin assay has been established using ESI-MS. It represents a significant advancement for the standardisation of HbA1c in diabetic monitoring. With its other applications such as in therapeutic drug monitoring, ESI-MS will continue to exert an important influence in the future development and organisation of the clinical laboratory service.
Introduction
Mass spectrometry is an analytical technique that can provide both qualitative (structure) and quantitative (molecular mass or concentration) information on analyte molecules after their conversion to ions. The molecules of interest are first introduced into the ionisation source of the mass spectrometer, where they are first ionised to acquire positive or negative charges. The ions then travel through the mass analyser and arrive at different parts of the detector according to their mass/charge (m/z) ratio. After the ions make contact with the detector, useable signals are generated and recorded by a computer system. The computer displays the signals graphically as a mass spectrum showing the relative abundance of the signals according to their m/z ratio.
Over the last decade, electrospray ionisation mass spectrometry (ESI-MS) has emerged as an important technique in clinical laboratories. It provides a sensitive, robust, and reliable tool for studying, at femto-mole quantities in micro-litre sample volumes, non-volatile and thermally labile bio-molecules that are not amenable to analysis by other conventional techniques. Coupled with a high performance liquid chromatograph (HPLC) for molecular fractionation prior to mass spectrometric analysis, HPLC/ESI-MS has become a very powerful technique capable of analysing both small and large molecules of various polarities in a complex biological sample. With the additional separation capabilities of tandem mass spectrometry (MS in a series, commonly denoted as MS/MS), complicated sample purification and procedures for derivative formation commonly used in gas chromatography (GC)-MS can be much simplified. Together with automated sample introduction, HPLC/ESI-MS/MS is a flow analysis technique for rapid analysis and high sample throughput. The focus of MS manufacturers in recent years has been on the development of MS analysers controlled by user-friendly computer software. Clinical biochemists and other biomedical scientists can manage this technique without an in-depth understanding of the complicated physical processes and mathematics principles. This article aims to provide a basic understanding of the ESI process, mass analysers, data acquisition, and specific requirements for qualitative and quantitative molecular analysis. Methods for the study of inborn errors of metabolism (small molecules) and haemoglobin variants (macromolecules) will be summarised for illustration of clinical applications.
Electrospray Ionisation Mass Spectrometry
1. The Electrospray Ionisation Process
ESI uses electrical energy to assist the transfer of ions from solution into the gaseous phase before they are subjected to mass spectrometric analysis. Ionic species in solution can thus be analysed by ESI-MS with increased sensitivity. Neutral compounds can also be converted to ionic form in solution or in gaseous phase by protonation or cationisation (e.g. metal cationisation), and hence can be studied by ESI-MS.
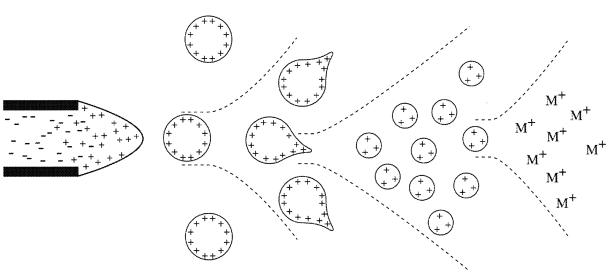
The transfer of ionic species from solution into the gas phase by ESI involves three steps: (1) dispersal of a fine spray of charge droplets, followed by (2) solvent evaporation and (3) ion ejection from the highly charged droplets (Figure 1). tube, which is maintained at a high voltage (e.g. 2.5 – 6.0 kV) relative to the wall of the surrounding chamber. A mist of highly charged droplets with the same polarity as the capillary voltage is generated. The application of a nebulising gas (e.g. nitrogen), which shears around the eluted sample solution, enhances a higher sample flow rate. The charged droplets, generated at the exit of the electrospray tip, pass down a pressure gradient and potential gradient toward the analyser region of the mass spectrometer. With the aid of an elevated ESI-source temperature and/or another stream of nitrogen drying gas, the charged droplets are continuously reduced in size by evaporation of the solvent, leading to an increase of surface charge density and a decrease of the droplet radius. Finally, the electric field strength within the charged droplet reaches a critical point at which it is kinetically and energetically possible for ions at the surface of the droplets to be ejected into the gaseous phase. The emitted ions are sampled by a sampling skimmer cone and are then accelerated into the mass analyser for subsequent analysis of molecular mass and measurement of ion intensity. The ESI mechanism is described in greater detail a recent review.1
Figure 1. Mechanism of electrospray ionisation.
Within an ESI source, a continuous stream of sample solution is passed through a stainless steel or quartz silica capillary
To obtain structural information, the precursor ions of interest can be mass selected and further fragmented in a collision cell. The fragment ions can then be mass analysed by a second mass analyser of a tandem mass spectrometer system to be described below.
2. Mass Analysers
I. The quadrupole mass analyser
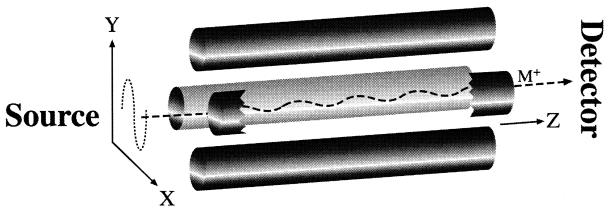
When ions travel through a magnetic or electrical field, their movement is affected by their m/z ratio and this is the main principle of separating ions in MS. In the clinical laboratory, a quadrupole mass analyser is most commonly used. In such system, an assembly of 4 parallel metal rods is kept at equal distance (Figure 2). Each pair of opposite rods is connected electrically. An equal but opposite DC voltage superimposed with a radio frequency (RF) AC voltage is applied to the diagonally placed pair of rods. The resulting electrical field causes the ions to travel forward in the z direction with oscillatory motion in the x-y plane. The amplitude of oscillation bears a unique relationship with the m/z ratio and can be controlled by changing the DC and RF voltages simultaneously in a pre-fixed ratio. These DC and RF voltages can be set so that amplitudes of oscillation for desirable m/z ratios are “stable” with the ions travelling along the z-axis without hitting the quadrupole rods, and finally reaching the detector. On the other hand, the oscillatory amplitudes of undesirable ions are large and “unstable”; they hit the metal rods, get neutralised, and fail to reach the detector. Quadrupole mass analysers are robust, economical, physically small, and more readily interfaced with a wide variety of inlet systems when compared with other conventional mass analysers like the magnetic sector.
Figure 2.
Operation of a quadrupole mass analyser. The ion (M+) travels from the source, through the 4 metal rods arrangement in the unique oscillating pattern, and reaches the detector.
II. Tandem quadrupole system
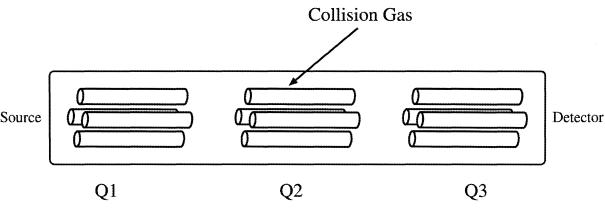
In a typical tandem quadrupole system there are three quadrupoles set up in a linear fashion, often called “triple-quad” (Figure 3). The analyte ion of interest (usually called the precursor ion) is mass-selected by the first quadrupole (Q1) and allowed to collide with a collision gas (usually argon) in a second RF-only quadrupole collision cell (Q2), where the precursor ions are activated by collision and undergo further fragmentation. This process is known as collision-induced dissociation (CID). The daughter ions resulting from CID are related to the molecular structure of the ions and can be monitored by a third quadrupole mass analyser (Q3) providing structural information of the molecular ions. This tandem system is commonly denoted as MS/MS in the literature. When Q1 is set to select only one specific m/z ratio, it filters out other molecular ions having different m/z ratios. This is a “purification” step inside the MS system, eliminating complicated and time-consuming sample purification procedures prior to MS analysis.
Figure 3.
Schematic diagram of a triple quadrupole system. The first (Q1) and third (Q3) are mass spectrometers and the centre (Q2) is a collision cell.
The following modes of data acquisition are commonly used in a tandem quadrupole system:
Product scan (daughter scan): Q1 is static allowing only one ion of specific m/z ratio to pass through and Q3 scans the different CID product ions. This mode can be used for studying molecular structure; for example, amino acids sequencing of a peptide molecule.
Precursor scan (parent scan): Q1 scans over a range of possible precursor ions and Q3 is static focusing on one unique product ion resulting from CID of a class of precursor ions. For example, m/z ratio of 85 is a common fragment ion from all the butylated acylcarnitines precursor ions (C2–C18).2
Neutral loss: Both Q1 and Q3 scan together at a constant difference in m/z ratio. This is used to monitor the loss of a neutral fragment for a class of molecules from CID. For example, there is a neutral loss of 102 from most of the butylated amino acids.2
Multiple reaction monitoring: Both Q1 and Q3 are static for a pre-determined pair of precursor and product ions. This confers the highest specificity and sensitivity and is commonly used in ESI-MS/MS quantification procedures.
III. The ion trap mass analyser
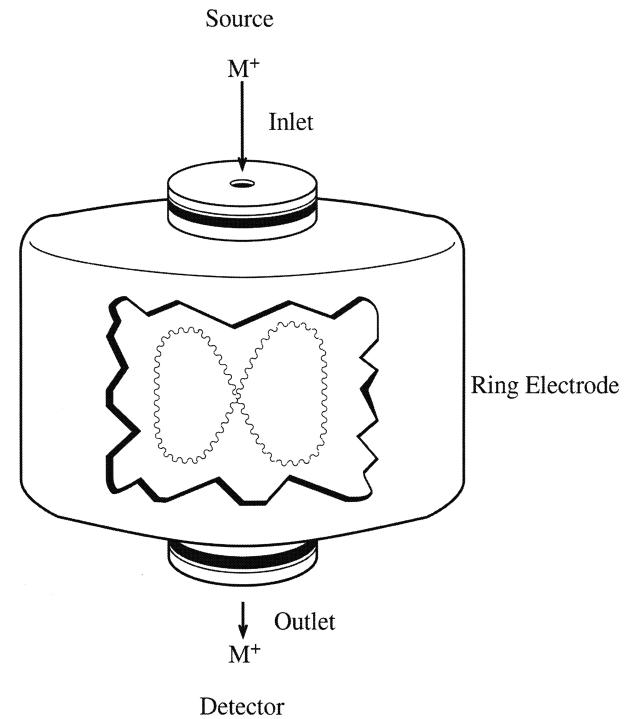
This system, which has become recently available, has the advantages of being smaller in size and cheaper, and being capable of performing tandem CID monitoring. It consists of three hyperbolic electrodes: the ring electrode, the entrance end cap electrode, and the exit end cap electrode (Figure 4). These electrodes form a cavity in which it is possible to trap (store) and analyse ions. Both end cap electrodes have a small hole in their centres through which the ions can travel. The ring electrode is located halfway between the two end cap electrodes. Ions produced from the source enter the trap through the quadrupole and the entrance end cap electrode. Various voltages are applied to the electrodes to trap and eject ions according to their m/z ratios. The ring electrode RF potential, an AC potential of constant frequency and variable amplitude, is applied to the ring electrode to produce a 3-dimensional quadrupolar potential field within the trapping cavity. This will trap ions in a stable oscillating trajectory confined within the trapping cell. The nature of the trajectory is dependent on the trapping potential and the m/z ratio of the ions. During detection, the electrode system potential is altered to produce instabilities in the ion trajectories and thus eject the ions in the axial direction. The ions are ejected in order of increasing m/z ratio, focused by the exit lens and detected by the ion detector system.
Figure 4.
Schematic diagram of an ion trap mass analyser. The trap is made up of the 2 end cap electrodes and the ring electrodes. Inside the trap, the ions rotate and oscillate in an 8-shaped trajectory.
During tandem MS, the precursor ion is selected inside the trap where an inert gas is introduced for CID. After that, the product ions are ejected for detection. Alternatively, the product ions can be kept inside the trap and another CID reaction can be initiated and this repeat CID reaction can continue for several times (denoted as MSn in which n is the number of CID reactions). This can help differentiate molecules with similar structures. However, ion trap analysers cannot provide precursor scan and neutral loss modes of data acquisition. For quantification, ion trap analysers are 10 times less sensitive when compared with the tandem quadrupole system operated in multiple reactions monitoring mode.
3. The Mass Spectrum
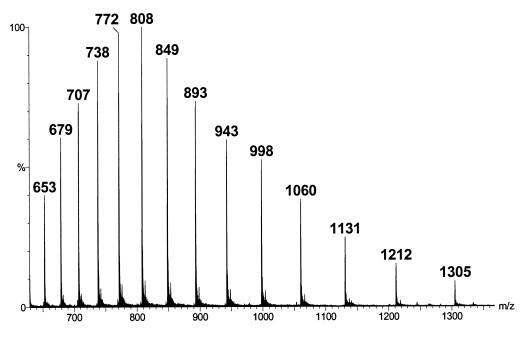
The mass spectrum is a graphical display of the relative a bundance of ion signals against the m/z ratios. It is a common practice that the highest signal is taken as 100% abundance and all the other signals are expressed as a percentage of this. Fragmentation of the protonated or de-protonated molecular ions generated from ESI is generally limited, and the mass spectra are relatively simple. However, multiple-protonation of proteins and peptides occurs in the ESI process, and the ESI mass spectra might become more complicated. Figure 5 is the mass spectrum for a highly purified horse myoglobin preparation (5 μmol/L in 50% acetonitrile containing 0.2% formic acid). A single protein will show its characteristic cluster ions containing multiple-charged ions. The number of charges on the protein molecules will depend on the molecular weight of the protein and the number of accessible basic sites (e.g. arginine, histidine, and lysine). Three basic assumptions are made in the determination of the molecular weight of a single protein. Namely, that (1) adjacent peaks in a series only differ by one charge; (2) charging is only due to proton attachment to the molecular ions; and (3) ionisation occurs to only the intact molecule. To calculate the molecular weight of the protein, one can use 2 simultaneous equations derived from 2 adjacent ions. As an example, for the ion with a m/z ratio = 1212, it has an adjacent peak with m/z ratio = 1131. The adjacent peak must have an additional charge on the molecular ions. Therefore, 2 simultaneous equations can be set up: m/z = 1212, and m/(z+1) = 1131, solving to z = 14 and m = 16968 for the molecule.
Figure 5.
Mass spectrum of the cluster ions of a highly purified horse myoglobin protein standard solution (5 μmol/L in 50% acetonitrile solution containing 0.2% formic acid)
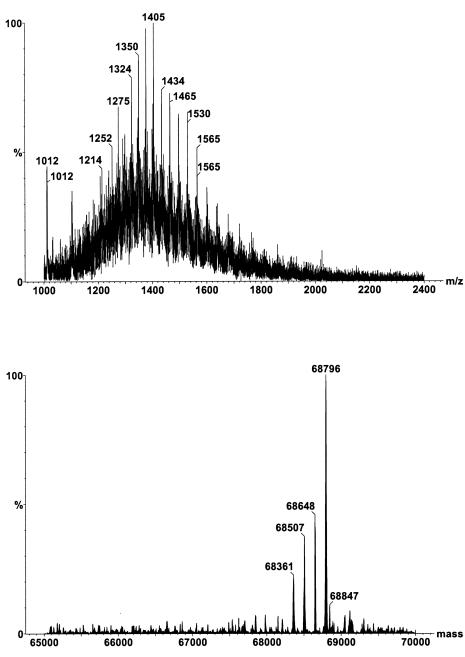
The situation becomes more complicated if there are mixtures of different proteins present in a sample. Different MS manufacturers provide their own software for transforming complicated raw mass spectrum into the individual relative molecular masses. Figure 6 (top) illustrates a mass spectrum of a mixture of purified alpha-foetal protein glycoforms. The Micromass MaxEnt programme (Micrormass, Manchester, UK) deconvolutes the mass spectrum into the individual glycoforms (Figure 6 - bottom). In this way, an ESI-MS system designed for measuring the m/z ratios of 4000 Da/e is capable of determining the molecular weight of large protein molecules over 100,000 Da. ESI-MS can also be applied to the study of other macromolecules, for example, oligonucleotides. The accuracy of ESI-MS for protein molecules has been documented to be ± 0.01% when compared with the theoretical amino acids sequence.3
Figure 6.
Mass spectrum of a mixture of serum alpha-foetal proteins purified by affinity chromatography. The top spectrum comprises the raw data showing the composite cluster ions of the different glycoforms. The bottom spectrum is the deconvoluted spectrum on the true mass scale after the Micromass MaxEnt processing.
4. Quantitative Analysis
In ESI-MS, the ion signal is proportional to analyte concentration and largely independent of flow rate and injection volume used for sample introduction.1 The signal is linear from the limit of detection (usually pmol/L) to around 10 μmol/L of analyte concentration. For quantitative measurement, it is important to incorporate an internal standard in the procedure to compensate for losses during sample preparation and variable detection sensitivity of the MS system. The internal standard should have a structure similar to that of the analyte and the ideal practice is to synthesise an internal standard by incorporating stable isotopes on the molecules of interest. For example, for the quantification of free carnitine (m = 162), an internal standard containing 3 deuterium atoms to replace 3 hydrogen atoms was used (m = 165).4 When an ideal internal standard is not available, molecules with similar structure can also be used. For example, ascomycin has been used as an internal standard for ESI-MS/MS analysis of the immunosuppressant tacrolimus.5
Another critical issue in quantitative ESI-MS is suppression of ionisation due to matrix interference. A biological sample would give significantly lower ionisation signals compared to pure standard solutions with similar analyte concentrations. This phenomenon is the result of high concentrations of non-volatile materials from the biological sample being present in the spray with the analyte.6 Possible non-volatile interfering solutes are salts and lipids in the biological samples. To overcome the matrix interference, extensive sample purification processes are required; for example, liquid-liquid extraction and solid phase extraction by disposable columns. However, these elaborate procedures are time-consuming and can cause poor recovery. A recent development is to use short LC columns (or guard columns) and apply a fast HPLC purification (e.g. for 2–5 minutes) prior to MS analysis.7 The HPLC serves to separate the non-volatile compounds from the analyte. For HPLC systems with column-switching capability, the analyte in the biological sample can be purified and concentrated on separate columns before MS analysis. Such an automated sample purification system utilising affinity chromatography is best illustrated by a recently published rapid quantification method for transferrin isoforms in serum.8
Clinical Applications
1. Screening for Inborn Errors of Metabolism
One of the most common clinical applications of ESI-MS is in screening for inborn errors of metabolism (IEM). Patients with IEM inherit defective metabolic pathways leading to either accumulation of toxic metabolites, or deficiency in metabolites vital for homeostasis. Many of these defects have serious clinical consequences, including mild to severe mental retardation, physical handicap, and even fatality. Early diagnosis and management of some of these disorders has proven very effective in preventing clinical consequences. Among them only a small number have been successfully screened on nation-wide neonatal screening programmes; for example, phenylketonuria (PKU) and neonatal hypothyroidism. The problems with the screening methods include laborious sample preparation, long analytical time, high false-positive rates, and the narrow disease spectrum covered by each method. The principle of the ESI-MS makes this method most suitable for measuring the same class of bio-molecules sharing similar molecular structures, and the MS/MS capability obviates complicated and tedious sample preparation procedures. Since the early 1990s, the use of ESI-MS/MS has revolutionised neonatal screening for IEM in many developed countries.9
I. Neonatal screening for disorders of amino acid and fatty acid metabolism
Currently, nation-wide neonatal screening programmes in North America, Europe and Australia are using automated ESI-MS/MS for metabolic profiling of amino acids and acylcarnitines from blood spots. State-of-the-art laboratories can screen several hundred samples per day. Sampling of blood spots on the Guthrie card, extraction of analytes, formation of derivatives, ESI-MS/MS analysis, and electronic data processing with computer-alert of abnormal results can all be fully automated now using micro-plate batch processing.9
Amino acid profiling can detect major aminoacidopathies, such as phenylketonuria (PKU), maple syrup urine disease, homocystinuria, and galactosaemia. In the past, PKU screening required the use of blood samples collected on or after Day 5 of birth, so that sufficient phenylalanine had accumulated for detection by the insensitive Guthrie qualitative bacterial inhibition test. Utilising ESI-MS/MS measurement of the phenylalanine to tyrosine concentration ratio, screening can now be performed with high specificity and sensitivity using Day 1 blood spots.10 Acylcarnitines screening is mainly for fatty acid oxidation defects. Examples of IEM being screened are: medium-chain and very-long-chain acyl-CoA dehydrogenase deficiencies; glutaric acidemia types I and II; carnitine palmitoyl transferase type II / translocase deficiencies; primary carnitine deficiency; isovaleric acidemia / 2-methylbutyryl-CoA dehydrogenase deficiency; and long-chain hydroxyacyl-CoA dehydrogenase/trifunctional protein deficiencies. Recently, these cost-effective screening methods have been used to study potential IEM in sudden infant death.11
II. Neonatal screening for galactosaemia
Galactosaemia (incidence, 1: 35,000 in Denmark)12 is a life-threatening IEM with severe symptoms in the neonatal period. It is most commonly caused by deficiency of the enzyme galactose-1-phosphate uridyl transferase. In this disorder, galactose derived from ingested lactose in milk and milk products accumulates in the blood and urine, leading to high intracellular concentrations of galactose-1-phosphate that is toxic to several tissues, especially the liver, brain, and renal tubules. Clinical manifestations, including vomiting, diarrhoea, jaundice and lethargy appear in neonates shortly after milk ingestion, progressing to coma and death from septicaemia, hepatic or renal failure. Early treatment with a galactose-free diet causes regression of signs and symptoms within 1–2 weeks. A novel ESI-MS/MS method has been developed for the measurement of total hexose mono-phosphates on blood spots as a marker for galactose-1-phosphate.12 The procedure is simple and does not require sample processing for derivative formation. A retrospective study has demonstrated a diagnostic sensitivity and specificity of 100% for 12 patients amongst 2055 controls.12
III. Neonatal screening for cholestatic hepatobiliary diseases
In prolonged neonatal jaundice, it is important to diagnose the presence of cholestatic hepatobiliary disease such as extrahepatic biliary atresia; a condition that can result in serious morbidity and mortality. A simple and efficient ESI-MS method has been developed for measuring conjugated bile acids on blood spots,13 and used in the attempt to set up a neonatal screening programme for cholestatic hepatobiliary diseases.14 However, the segregation of conjugated bile acid concentrations between patients and the general population was insufficient to make mass screening for cholestatic hepatobiliary diseases a feasible option with this method alone. Low birth weight infants without the pathological conditions could also have significantly high bile acid concentrations, thereby affecting the specificity of the method. Furthermore, this screening method is also affected by the significant increases seen in bile acid concentration after feeding. Therefore, accurate sampling time might be required to improve its usefulness.
IV. Screening for peroxisomal disorders
The peroxisomes are intracellular organelles responsible for the β-oxidation of very long chain and branched chain fatty acids. Peroxisomal disorders are a heterogeneous group of IEM characterised by impaired, reduced or totally absent peroxisomes. Examples of such include the Zellweger syndrome, X-linked adrenoleukodystrophy, acyl-CoA oxidase deficiency, bifunctional protein deficiency and peroxisomal thiolase deficiency.15 Patients suffering from these disorders may have abnormal increases in very long chain fatty acids (VLCFA), pristanic or phytanic acids in serum. Tedious GC/MS methods have been used for the diagnosis of these conditions. A rapid ESI-MS/MS method was reported for screening peroxisomal disorders.16 VLCFA (C20:0 eicosanoic, C22:0 docosanoic, C24:0 tetracosanoic and C26:0 hexacosanoic acids) in blood spots or serum need to be converted to dimethylaminoethyl esters. The sample purification, and derivative formation procedures are relatively simple compared with traditional GC/MS methods. Since the final step in bile acid biosynthesis takes place in peroxisomes, another HPLC/ESI-MS/MS method for plasma C27 and C29 conjugated bile acids has also been proposed, to screen for peroxisomal disorders.17 This method does not require sample processing for derivative formation, and is similar to the method described above.14
V. Screening for disorders in purine and pyrimidine metabolism
Inborn errors of purine and pyrimidine metabolism have a wide variety of clinical presentations; for example, gout, anaemia, immunodeficiency, kidney stones, convulsions, mental retardation, autism and growth retardation.18 Diagnosis is based on the presence of abnormal metabolites or the absence of normal metabolites in serum, urine or red blood cells. An HPLC/ESI-MS/MS screening method has been developed for the quantification of 17 purines and pyrimidines in urine or urine-soaked filter paper strips with a turn-around-time of 15 minutes per sample.19
2. Identification and Quantification of Haemoglobin Variants
Since the first report on the successful measurement of large bio-molecules by ESI-MS, there has been a revolution in the identification of protein molecules in biochemical research. In the clinical laboratory, quantification of glycohaemoglobin (GHb) provides a useful tool for the monitoring of glycaemic control in diabetic patients. ESI-MS has been the recognised technology for development of the reference method. In addition, haemoglobin (Hb) variants need to be identified for the investigation of haemolytic anaemia, methaemoglobinaemia, sickle cell disease and thalassaemia. Occasionally, these variants are detected incidentally because they interfere with the measurement of GHb. ESI-MS has also become the preferred technique for a rapid systematic approach to definitive characterisation of Hb variants.20
I. Quantification of glycohaemoglobin
GHb is the product of irreversible non-enzymatic glycation of Hb. The percentage GHb represents an integration of the patient’s average plasma glucose concentration over the life span of his/her erythrocytes (2–3 months). It has been used for monitoring diabetic control for many years. A recent review reiterated that improved glycaemic control in diabetic patients is strongly associated with decreased development and/or progression of complications.21 HbA1c is the predominant species of GHb and is measured in clinical laboratories using either HPLC with ion-exchange or affinity column, or automated immunoassays. Most of these methods have acceptable analytical precision and efficiency. However, they suffer from interference by Hb variants, giving falsely high or low results. Considerable confusion on the accuracy of the methods has been reported due to the lack of international standardisation. The fundamental issue has been the lack of understanding of the specific nature of HbA1c. The use of ESI-MS eliminates this problem.
The IFCC working group on international standardisation defines HbA1c as Hb that is irreversibly glycated at one or both N-terminal valines of the β globin chains.22 Based on this definition, a candidate reference method was developed using HPLC/ESI-MS.23 It requires an overnight endoproteinase Glu-C digestion, followed by HPLC separation of the peptides. The ESI signal intensities of the specific β N-terminal hexa-peptides of Hb0 and HbA1c are used for calculating the percentage HbA1c in the sample. This method was later adopted as the IFCC reference method.24 Preliminary reference values reported by IFCC, 3.36 ± 0.48% (mean ± 2 SD), were significantly lower than those developed by other methods.
Subsequently, this reference method was modified for adaptation in clinical laboratories. The separation of peptides by reverse-phase HPLC method took 24 minutes. It was improved by using a different gradient mobile phase and analysis time was reduced to 8 minutes.25 To improve on the specificity of the measurement, multiple reactions monitoring signal acquisition was used. Precision of the method was also improved using signal intensities from both the singly- and doubly-charged peptide ions.26 To reduce the running cost of the method, an immobilised endoproteinase Glu-C preparation was also introduced. It has been shown that this reference method can overcome interferences by Hb variants.27 Despite the various improvements to the IFCC reference method, it is still too demanding for routine application.
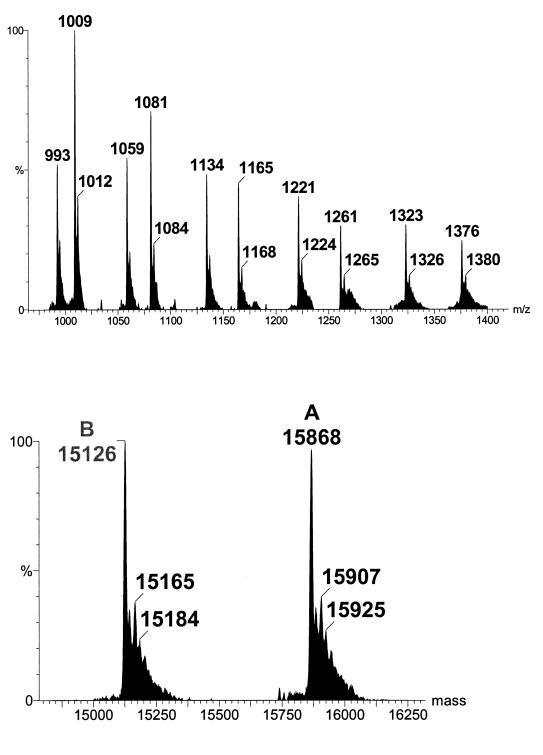
An alternative ESI-MS method for GHb had been developed.28 In this method a whole blood sample is diluted 500-fold before it is analysed by ESI-MS for intact Hb globin chains. Figure 7 (top) shows a typical ESI mass spectrum of normal Hb. The cluster ions have been deconvoluted into true molecular weights by computer softwares (Figure 7 - bottom). Normal α and β globin chains have molecular weights of 15126.4 and 15867.2 respectively. A mass increase of 162 Da is assigned due to the addition of glucose (mass, 180 Da) and elimination of water (−18 Da). The advantages of this ESI-MS method are that it is simple and fast, with an analysis time of 3 minutes per sample, and can be easily automated. Moreover, it is not affected by Hb variants as variant globin chains and their glycated species can also be measured easily. This proposed method has also been tested for long-term performance.29 Over a 4-month period of routine operation, the between-assay imprecision was 1.6–5.0%, with results that were correlated well with the HPLC ion-exchange method, and the β-glycated Hb percentage agreed closely with established reference values.29
Figure 7.
Mass spectrum of normal haemoglobin. The top spectrum comprises the raw data showing the cluster ions of both α and β globins. The bottom spectrum is the deconvoluted spectrum on the true mass scale after software transformation.
II. Identification of haemoglobin variants
Electrophoresis and automated HPLC are currently the major methods used in clinical laboratories for the identification of Hb variants. However, these methods do not provide definitive characterisation of the variants, especially those with amino acid substitutions not resulting in any changes to the overall charges on the Hb molecule. In the past, definitive characterisation of Hb variants involved tedious and time-consuming analytical procedures requiring days and even months for completion. Recently, a strategy for rapid definitive characterisation of Hb variants was reported using ESI-MS technique.20 It identified 95% of the Hb variants in over 250 samples with a turn-around-time of not more than 2 days for each sample. The procedure comprises the following steps:
- Molecular weight profiling of intact α and β globin chains by direct ESI-MS on a 500-fold dilution of the whole blood sample. The cluster ion spectrum is then deconvoluted to a true molecular weight scale using computer software that is usually supplied with the MS analyser system. This step can detect Hb variants with molecular weight difference of more than 6 Da when compared with the wild type globin chains.
- Overnight trypsin digestion for investigation of the amino acid substitution on the Hb variants. ESI-MS on the tryptic digest can identify the specific peptide harbouring the substituted amino acid.
- ESI-MS/MS of the target peptide can provide the amino acid sequence of the peptide and thus the position of the substituted amino acid.
Summary
The large number of ESI-MS methods that have been presented in recent scientific literature and conferences speak for their increasing applications in the clinical laboratory. They represent the state-of-the-art technology for precise, accurate and efficient qualitative and quantitative analyses of normal and pathological metabolites. Although the initial capital investment for an ESI-MS equipment is substantial compared to our other routine clinical laboratory analysers, its operational costs are low. This technology is expected to exert an important influence in the future development and organisation of the clinical laboratory service.
References
- 1.Bruins AP. Mechanistic aspects of electrospray ionization. J Chromatogr A. 1998;794:345–57. [Google Scholar]
- 2.Rashed MS, Ozand PT, Bucknall MP, Little D. Diagnosis of inborn errors of metabolism from blood spots by acylcarnitines and amino acids profiling using automated electrospray tandem mass spectrometry. Pediatr Res. 1995;38:324–31. doi: 10.1203/00006450-199509000-00009. [DOI] [PubMed] [Google Scholar]
- 3.Jardine I. Molecular weight analysis of proteins. In: McCloskey JA, editor. Methods in Enzymology, Volume 193, pp 441–55. Pasadena: Academic Press, 1990. [DOI] [PubMed]
- 4.Stevens RD, Hillman SL, Worthy S, Sanders D, Millington DS. Assay for free and total carnitine in human plasma using tandem mass spectrometry. Clin Chem. 2000;46:727–9. [PubMed] [Google Scholar]
- 5.Zhang Q, Simpson J, Aboleneen HI. A specific method for the measurement of tacrolimus in human whole blood by liquid chromatography / tandem mass spectrometry. Thera Drug Monit. 1997;19:470–6. doi: 10.1097/00007691-199708000-00018. [DOI] [PubMed] [Google Scholar]
- 6.King R, Bonfiglio R, Fernandez-Metzler C, Miller-Stein C, Olah T. Mechanistic investigation of ionization suppression in electrospray ionization. J Am Soc Mass Spectrom. 2000;11:942–50. doi: 10.1016/S1044-0305(00)00163-X. [DOI] [PubMed] [Google Scholar]
- 7.Matuszewski BK, Constanzeer ML, Chavez-Eng CM. Matrix effect in quantitative LC/MS/MS analyses of biological fluids: a method for determination of finasteride in human plasma at picogram per milliliter concentrations. Anal Chem. 1998;70:882–9. doi: 10.1021/ac971078+. [DOI] [PubMed] [Google Scholar]
- 8.Lacey JM, Bergen HR, Magera MJ, Naylor S, O’Brien JF. Rapid determination of transferrin isoforms by immunoaffinity liquid chromatography and electrospray mass spectrometry. Clin Chem. 2001;47:513–8. [PubMed] [Google Scholar]
- 9.Rashed MS, Bucknall MP, Little D, Awad A, Jacob M, Alamoudi M, et al. Screening blood spots for inborn errors of metabolism by electrospray tandem mass spectrometry with a microplate batch process and a computer algorithm for automated flagging of abnormal profiles. Clin Chem. 1997;43:1129–41. [PubMed] [Google Scholar]
- 10.Chace DH, Sherwin JE, Hillman SL, Lorey F, Cunningham GC. Use of phenylalanine-to-tyrosine ratio determined by tandem mass spectrometry to improve newborn screening for phenylketonuria of early discharge specimens collected in the first 24 hours. Clin Chem. 1998;44:2405–9. [PubMed] [Google Scholar]
- 11.Chace DH, DiPerna JC, Mitchell BL, Sgroi B, Hofman LF, Naylor EW. Electrospray tandem mass spectrometry for analysis of acylcarnitines in dried postmortem blood specimens collected at autopsy from infants with unexplained cause of death. Clin Chem. 2001;47:1166–82. [PubMed] [Google Scholar]
- 12.Jensen UG, Brandt NJ, Christensen E, Skovby F, Nogaard-Pedersen B, Simonsen H. Neonatal screening for galactosemia by quantitative analysis of hexose monophosphate using tandem mass spectrometry: a retrospective study. Clin Chem. 2001;47:1364–72. [PubMed] [Google Scholar]
- 13.Mills KA, Mushtaq I, Johnson AW, Whitfield PD, Clayton PT. A method for the quantitation of conjugated bile acids in dried blood spots using electrospray ionization-mass spectrometry. Pediatr Res. 1998;43:361–8. doi: 10.1203/00006450-199803000-00009. [DOI] [PubMed] [Google Scholar]
- 14.Mushtaq I, Logan S, Morris M, Johnson AW, Wade AM, Kelly D, et al. Screening of newborn infants for cholestatic hepatobiliary disease with tandem mass spectrometry. BMJ. 1999;319(7208):471–7. doi: 10.1136/bmj.319.7208.471. [DOI] [PMC free article] [PubMed] [Google Scholar]
- 15.Wanders RJA, Schutgens RBH, Barth PG. Peroxisomal disorders. In: Blau N, Duran M, Blaskovics ME, editors. Physician’s guide to the laboratory diagnosis of metabolic diseases, pp 359–76. Oxford: Chapman & Hall Medical, 1996.
- 16.Johnson DW. A rapid screening procedure for the diagnosis of peroxisomal disorders: quantification of very long-chain fatty acids, as dimethylaminoethyl esters, in plasma and blood spots, by electrospray tandem mass spectrometry. J Inherit Metab Dis. 2000;23:475–86. doi: 10.1023/a:1005612214179. [DOI] [PubMed] [Google Scholar]
- 17.Bootsma AH, Overmars H, van Rooij A, van Lint AE, Wanders RJ, van Gennip AH, et al. Rapid analysis of conjugated bile acids in plasma using electrospray tandem mass spectrometry: application for selective screening of peroxisomal disorders. J Inherit Metab Dis. 1999;22:307–10. doi: 10.1023/a:1005543802724. [DOI] [PubMed] [Google Scholar]
- 18.Simmonds HA. Purine and pyrimidine disorders. In: Holton JB, editor. The inherited metabolic diseases, pp 297–349. London: Churchill Livingstone.1994.
- 19.Ito T, Van Kuilenburg ABP, Bootsma AH, Haasnoot AJ, Cruchten AV, Wada Y, et al. Rapid screening of high-risk patients for disorders of purine and pyrimidine metabolism using HPLC-electrospray tandem mass spectrometry of liquid urine or urine-soaked filter paper strips. Clin Chem. 2000;46:445–52. [PubMed] [Google Scholar]
- 20.Wild BJ, Green BN, Cooper EK, Lalloz MR, Erten S, Stephens AD, et al. Rapid identification of hemoglobin variants by electrospray ionization mass spectrometry. Blood Cells Mol Dis. 2001;27:691–704. doi: 10.1006/bcmd.2001.0430. [DOI] [PubMed] [Google Scholar]
- 21.Krishnamurti U, Steffes MW. Glycohemoglobin: a primary predictor of the development or reversal of complications of diabetes mellitus. Clin Chem. 2001;47:1157–65. [PubMed] [Google Scholar]
- 22.Hoelzel W, Miedema K. Development of a reference system for the international standardization of HbA1c/glycohemoglobin determinations. JIFCC. 1996;9:62–7. [PubMed] [Google Scholar]
- 23.Kobold U, Jeppsson JO, Dulffer T, Finke A, Hoelzel W, Miedema K. Candidate reference methods for hemoglobin A1c based on peptide mapping. Clin Chem. 1997;43:1944–51. [PubMed] [Google Scholar]
- 24.Jeppsson JO, Kobold U, Barr J, Finke A, Hoelzel W, Hoshino T, et al. IFCC reference method for measurement of HbA1c in human blood. IFCC Ref Method HbA1c. 2001:1–23. doi: 10.1515/CCLM.2002.016. 04.04.2001. [DOI] [PubMed] [Google Scholar]
- 25.Willekens E, Thienpont LM, Stockl D, Kobold U, Hoelzel W, De Leenheer AP. Quantification of glycohemoglobin in blood by mass spectrometry applying multiple-reaction monitoring. Clin Chem. 2000;46:281–3. [PubMed] [Google Scholar]
- 26.Nakanishi T, Shimizu A. Determination of ionization efficiency of glycated and non-glycated peptides from the N-terminal of hemoglobin beta-chain by electrospray ionization mass spectrometry. J Chromatogr B Biomed Sci Appl. 2000;746:83–9. doi: 10.1016/s0378-4347(00)00115-8. [DOI] [PubMed] [Google Scholar]
- 27.Nakanishi T, Miyazaki A, Iguchi K, Shimizu A. Effect of hemoglobin variants on routine glycohemoglobin measurements assessed by a mass spectrometric method. Clin Chem. 2000;46:1689–92. [PubMed] [Google Scholar]
- 28.Roberts NB, Green BN, Morris M. Potential of electrospray mass spectrometry for quantifying glycohemoglobin. Clin Chem. 1997;43:771–8. [PubMed] [Google Scholar]
- 29.Roberts NB, Amara AB, Morris M, Green BN. Long-term evaluation of electrospray ionization mass spectrometric analysis of glycated hemoglobin. Clin Chem. 2001;47:316–21. [PubMed] [Google Scholar]


