

Abstract
Steric constraints, charged interactions and many other forces important to protein structure and function can be explored by mutagenic experiments. Research of this kind has led to a wealth of knowledge about what stabilizes proteins in their folded states. To gain a more complete picture requires that we perturb these structures in a continuous manner, something mutagenesis cannot achieve. With high pressure crystallographic methods it is now possible to explore the detailed properties of proteins while continuously varying thermodynamic parameters. In this paper, we detail the structural response of the cavity-containing mutant L99A of T4 lysozyme, as well as its pseudo wild-type (WT*) counterpart, to hydrostatic pressure. Surprisingly, the cavity has almost no effect on the pressure response: virtually the same changes are observed in WT* as in L99A under pressure. The cavity is most rigid, while other regions deform substantially. This implies that while some residues may increase the thermodynamic stability of a protein, they may also be structurally irrelevant. As recently shown, the cavity fills with water at pressures above 100 MPa while retaining its overall size. The resultant picture of the protein is one in which conformationally fluctuating side groups provide a liquid-like environment, but which also contribute to the rigidity of the peptide backbone.
Introduction
The L99A mutant of T4 lysozyme was originally produced to study the stabilizing effects of packing hydrophobic amino acid residues into the core of a protein 1; 2; 3. Besides the L99A mutant studied here, a large number of other cavity-creating mutants were made, and the structures of many of these mutants were determined by x-ray crystallography. In each case, thermal unfolding was used to characterize changes in unfolding thermodynamics due to the mutation. In all cases, the folded cavity mutants were less stable to unfolding than the WT* parent protein. The change in stability can be approximated by two contributions. One depends only on the mutation, and is equal to the difference in free energy upon transfer from a nonpolar solvent to water. In the case of L99A, the alanine transfer free energy is smaller than that for leucine by about 2 kcal/mol (so that the L99A mutant folded state is destabilized). A second contribution depends roughly on the volume of the cavity, and decreases the stability of the protein by roughly 22 cal/mol·Å3(1; 2; 3).
The mutant T4 lysozyme cavities were generally, though not always, smaller than would have been predicted solely from the parent WT* structure. For M6A, the predicted cavity size was 71Å3, and the crystallographically measured cavity volume was 68Å3. In that case, two water molecules fill the cavity at ambient pressure, making hydrogen bonds with the protein. The cavity volume reduction is due to small side chain rearrangements. In one spectacular case, M102A, the cavity volume predicted from the WT* structure is 109Å3, but was observed to be 83Å3 in the crystallographic structure3; 4. It is remarkable that this collapse was primarily due to side chain rearrangement and that the helical fold of this part of the protein could be affected by further side chain truncations4. The L99A mutant, however, had a cavity slightly larger than would have been predicted on the basis of the WT* structure alone (150 versus 139Å3) so that the amino acids surrounding the mutation site clearly had some steric freedom. (Note that due to differences in how the cavity is measured, cavity volumes quoted later in the present study will be larger; the instrinsic difficulties in defining cavity volumes mean that we can only meaningfully discuss differences in volume, not the absolute values.) This region of the protein, deeply buried in T4 lysozyme, might therefore be taken to be stabilized thermodynamically by van der Waals interactions between hydrophobic residues. The Leu99 residue does not appear to impose any steric constraint on surrounding residues, at least no constraint that is not redundant.
The change in stability upon mutation includes a contribution well modeled by the free energy of transferring the amino acids from oil into water. This is good evidence for the so-called “liquid hydrocarbon model” of the protein interior. Based on arguments about cavity size distributions within several proteins, Liang and Dill 5 concluded that proteins bear many characteristics of liquids. In fact, the cavity-size distribution in proteins is remarkably similar to that of randomly packed spheres near a percolation threshold. They also found that the unfolding enthalpies per residue are virtually independent of packing density, seemingly at odds with the results on the cavity mutants of T4 lysozyme. Although proteins have remarkably high packing densities, sometimes higher than corresponding amino-acid crystals, Liang and Dill imply that packing density, in and of itself, has not been selected for evolutionarily.
While it is clear that protein interiors are not true liquids, it is interesting to ask how solid they may be, and what sort of solid they most closely approximate,. If subjected to hydrostatic pressure, would the cavity collapse like a void in a gel or would it retain its shape? For now, we assume a cavity volume of about 180 Å3, about what we measure in this study. At ambient pressure, it is not surprising that a cavity in a solid would persist, as the pΔV energy associated with it is only about 0.1 MPa • 180 Å3, or 0.005 kBT, where kB is Boltzmann’s constant and T is the absolute temperature. At 200 MPa, the free energy of this cavity is 9 kBT, sufficiently large that it becomes an important thermodynamic term. (The qualitative result that this energy in significant at 200 MPa is no different if we use the original measurement of about 150Å3.)
In a related manner it is important to ask how hydrophobicity applies to a folded protein. All evidence suggests that hydrophobicity plays a crucial role in the stability and folding or proteins, but the non-specific interactions between amino acids in the folded protein do not seem, in and of themselves, enough to convey much rigidity to the protein. In such a view, the protein interior is similar to margarine or butter, which have some rigidity, but which under pressure of only a few MPa will fail to support any void contained within. Moreover, if the protein is indeed rigid and the cavity does not collapse, we have to ask what about the protein confers that rigidity.
The fact that many proteins show large functional responses to pressure 6; 7; 8 indicates that the pressure-induced changes to the protein free energy are quite significant. For this reason high-pressure crystallography, as well as high-pressure NMR9; 10; 11; 12; 13, has been developed as a means to provide insight into the function of proteins 14; 15. Full-structure high pressure protein crystallography was first demonstrated in 1986 by Kundrot and Richards 16; 17. One particularly useful feature of high-pressure experiments is that, unlike thermal or chemical perturbations, pressure is an easily controlled thermodynamic parameter which does not in general damage protein crystals. High-pressure crystallography is also showing great promise for obviating cryoprotection problems for many crystals 18 and for the study of virus structure 19.
We propose to explore the character of proteins by treating them like ordinary materials. Proteins studied under pressure have thus far proven to be quite incompressible, with most of the structural rearrangements coming from realignment of domains or subdomains of a protein. In spite of this, one may expect to find significant collapse of the primarily α-helical region surrounding the engineered cavity of the L99A lysozyme. If the protein has much liquid or plastic character at all, intuition tells us the cavity should at least deform. Instead, we find that the cavity has no significant effect on the pressure response of the protein, reinforcing the earlier conclusion that while the Leu99 residue participates in the thermodynamic stability of the protein, it enforces no appreciable steric constraint on surrounding amino acids. This reinforces the view, well confirmed by NMR experiments20, that the cavity is accesible to water under pressure, that the peptide backbone is a rather rigid skeleton, while the remaining volume of the protein is filled by rapidly fluctuating side groups that allow relatively rapid liquid-like diffusion of both hydrophobic and hydrophilic molecules throughout the protein matrix. Our own work on this protein has shown that it is possible that non-polar cavities are transiently and infrequently populated with polar molecules such as water14, even in this apparently rigid protein where there is no access to the cavity in the crystallographic structure. The fact that the innermost hydrophobic interior of the protein is readily visited by hydrophilic molecules has implications for many hydrophobic drugs.
The ultimate question in this situation is what confers the rigidity of the backbone, and therefore of subdomains or the whole protein: is it an intrinsic property of the backbone itself (e.g. strong hydrogen bonding or charge interactions leading to helix-formation) or a property conferred by the steric interactions of the amino acid side chains.? For reasons we discuss below, we favor the latter interpretation.
Results
T4 Lysozyme Structure Under Pressure
Before considering structural details, we discuss some simple responses of the protein and crystal to pressure. As can be seen in Table 1, the unit cell lengths decrease with pressure. The c-axis is “softer”, decreasing about 1.0% in length while the a- and b-axes shorten by about 0.5% as pressure is raised to 200 MPa. This is also true for the WT* protein. The WT* unit cell is slightly larger than the L99A unit cell, and the difference is maintained throughout the pressure range studied. The unit cell parameters cluster tightly at all pressures, so that the changes with pressure are larger than any uncertainty in the parameters.
Table 1.
X-ray refinement statistics1
| Pressure (MPa) | 0.1 | 100 | 150 | 200 |
| Number of datasets | 3 | 3 | 1 | 3 |
| Resolution (Å) | 2.3 | 2.1 | 2.1 | 2.1 |
| Unit cell parameters | ||||
| a = b (Å) | 60.96 | 60.76 | 60.68 | 60.61 |
| c (Å) | 96.60 | 96.07 | 95.80 | 95.65 |
| Rwork/Rfree | 0.15/0.21 | 0.17/0.22 | 0.16/0.21 | 0.16/0.20 |
| Number of atoms | 1407 | 1473 | 1475 | 1497 |
| Protein | 1289 | 1289 | 1289 | 1289 |
| Ligand/ion | 10 | 10 | 10 | 10 |
| Water | 108 | 174 | 176 | 198 |
| B-factors (Å2) | ||||
| Protein | 25.4 | 22.7 | 22.5 | 22.6 |
| Ligand/ion | 79.8 | 69.7 | 84.4 | 77.4 |
| Water | 45.4 | 44.0 | 45.4 | 45.5 |
| R.m.s deviations | ||||
| Bond lengths (Å) | 0.020 | 0.018 | 0.016 | 0.016 |
| Bond angles (°) | 1.58 | 1.53 | 1.44 | 1.36 |
Values listed are averages over datasets at each pressure.
Both the molecular volume of the protein and the volume of the L99A cavity decrease with pressure. The molecular volume of the L99A mutant decreased from 21,088 Å3 to 20,894Å3 at 200 MPa, and the WT* molecular volume decreases from 21,070 Å3 to 20,860 Å3, both slightly less than 1% so that the compressibility is 0.05 GPa-1. There is considerably more scatter in the molecular volume estimates than for unit cell parameters at any one pressure, but the distributions do not overlap. The standard deviation of molecular volumes for all of the datasets at any one pressure, is about 26 Å3. For comparison, the compressibilities of hen egg-white lysozyme17 and sperm-whale myoglobin15 determined by x-ray crystallography were found to be 0.05 GPa-1 and 0.09 GPa-1, respectively.
Cavity volumes in the L99A mutant decrease by about 3% from 185 Å3 to 179 Å3 over 200 MPa. In this case the scatter is yet larger, and the values for different datasets overlap (e.g. the largest estimate for cavity size at 100 MPa is 184.9 Å3, and the smallest at 0.1 MPa is 183.6 Å3). The cavity does appear to decrease in size slightly, but the average standard deviations of the values at each pressure, is about 3 Å3. This is comparable to the changes observed, and there is substantial uncertainty arising solely out of how the volume is defined, we cannot argue that this decrease in volume is significant.
Figure 1 shows the displacements of the α-Carbon backbone from the ambient structure for the L99A mutant at 100, 150 and 200 MPa. In the figure, the structures have been aligned for comparison using only the C-terminal domain (residues 80–160) peptide backbone atoms. This choice is somewhat arbitrary, but was made because alignment of the proteins based on some subset of atoms will highlight displacements relative to that subset. Alignment using residues 80–160 highlights displacements of the N-terminal domain relative to the C-terminal domain; this subset of atoms is also centered on the cavity, which should make any isotropic compression of the cavity region more obvious. It is clear from the figure that the most significant changes in the protein are a domain realignment in which the N-terminal domain (residues 13–55) moves approximately 0.1 Å/100 MPa relative to the C-terminal domain, and a displacement of about 0.2 Å/100 MPa in the C-terminal end of helix C (near residues 75–80). This last feature is particularly robust in that it is apparent regardless of how the protein alignment is done.
Figure 1.
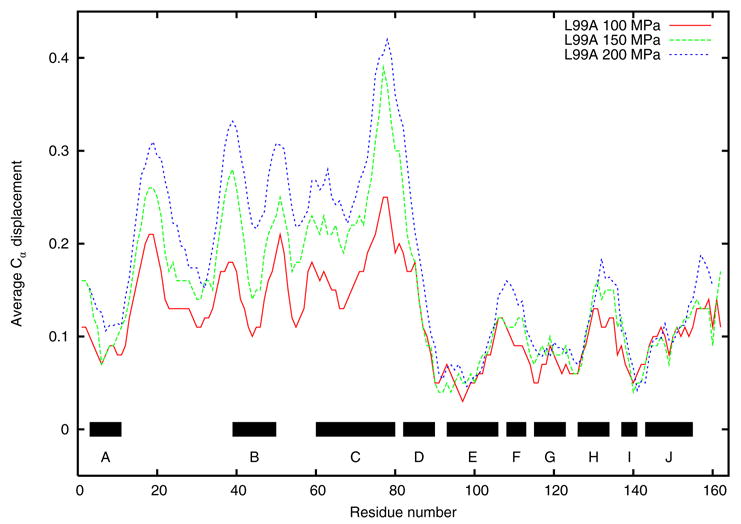
Displacement of L99A α-carbon atoms from the ambient structure in Å, at 100, 150, and 200 MPa, as obtained by aligning residues in the C terminal domain. Bars indicate positions of α-helices.
We note that the displacements in Figure 1 follow the thermal B-factors derived from crystallography to the extent that the peaks in Figure 1 correspond to a peak in a similar plot of B-factors in all but one case (helix F). This correlation, while far from perfect in the details of exact peak positions and amplitudes, might be anticipated from the thermodynamic relation between the compressibility of a system and its volume fluctuations.
The N-terminal domain changes are best viewed in relation to the principal axes of inertia of the protein, as shown in Figure 2. The figure is a view along the first principal axis of inertia (that is, the axis along which the protein’s inertial moment is largest). The N-terminal domain, highlighted in blue at ambient pressure and orange at high pressure (with displacements magnified 5 times) moves almost perpendicular to the first principal axis of inertia. The average displacement vector and the second principal axis of inertia are nearly parallel. As a result, only the moment of inertia along the second principal axis changes significantly with increasing pressure. As will be discussed below there is no significant difference between the N-terminal response to pressure in L99A and WT* lysozyme, which is to be expected as the L99A mutation is in a separate subdomain. This seems to indicate that, for mechanical purposes, the two subdomains do not interact strongly.
Figure 2.
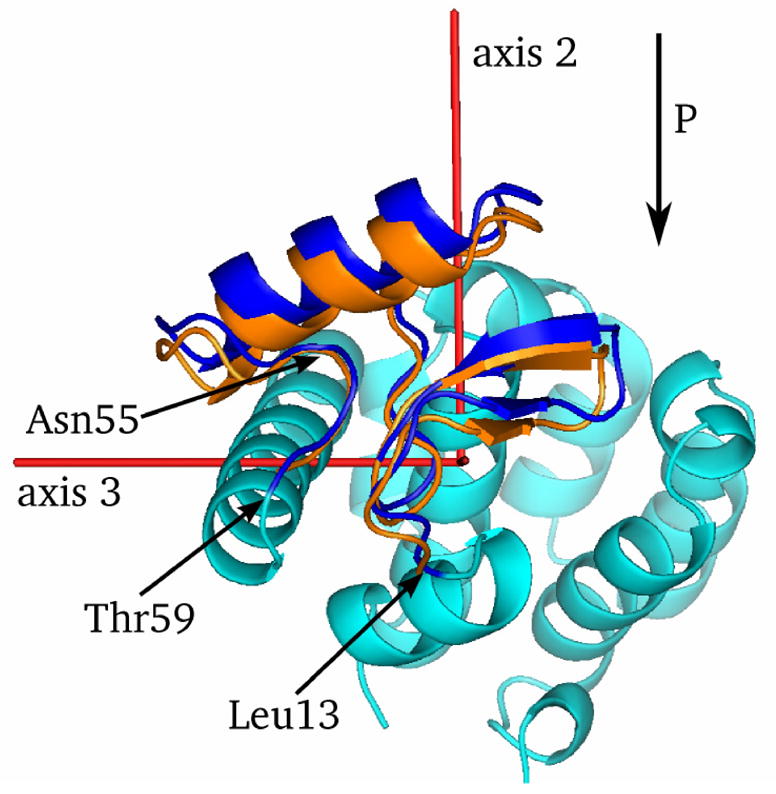
Displacement of the N-terminal domain. The arrow labelled “P” indicates the direction of pressure-induced displacement of the N-terminal domain. Red lines indicate the three principal axes of inertia of the ambient pressure L99A structure. The ambient pressure N-terminal domain is shown in dark blue, and the 200 MPa displacements are magnified by 5 and shown in orange. The remainder of the protein is shown in light blue, with the cavity slightly below and to the right of the beta-sheet in the N-terminal domain as viewed in this figure.
The local minimum in displacement near residue 30, visible in Figure 1, appears to correspond to a hydrogen bond between Asp70 and His30. There are no other obvious contacts constraining this region, although as the structure compresses Leu66 blocks the motion of His30 in the direction of overall N-terminal domain displacement. Leu66 is also relevant as it appears to be involved in kinking the C-helix at elevated pressure, and will be discussed further below.
Figure 1 indicates many significant peaks in the displacements of N-terminal domain residues, e.g., those near or above an RMS value of 0.2 Å. Compare, for example, the pressure induced displacements in myoglobin [7]. Independent alignment of the N-terminal domains at the three different pressures shows that in fact the N-terminal domain moves almost entirely as a whole, with little internal deformation. As has been observed for Hen egg-white lysozyme, the primary response to pressure is rearrangement of subdomains relative to each other 17.
Three peaks in the C-terminal domain are above the 0.1 Å uncertainty level discussed earlier, one near the break between helices E and F, one near helix H, and one at the C-terminal end of the protein. Only the displacements near helix H are constrained by strong electron density. Helix F is poorly constrained in all the refined structures, as is the C-terminus of the protein. Since they line the cavity and are robust, we will be most interested in the changes near the C-terminal end of the C-helix and changes in the H-helix.
Changes in the C-helix are shown in Figure 3. The C-terminal end of this helix is bent inward towards the cavity and this displacement is the largest in the protein as pressure increases from 0.1 to 200 MPa (see Figure 1). This displacement is coupled to a motion of helix D primarily along the helix D axis, visible in Figure 3. Helix D also moves slightly inward towards the cavity.
Figure 3.
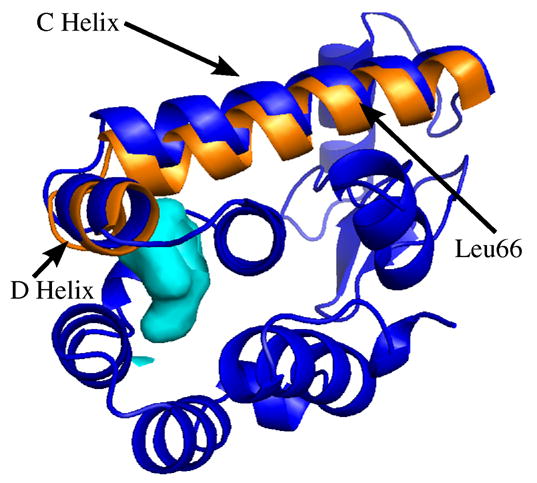
Displacements in helix C. The view is along helix E, with the N-terminal domain shown here behind helix C. The ambient pressure structure is shown in a cartoon view colored blue. Helices C and D are shown with their 2 kbar displacements magnified 5 times in orange. Arrow indicates position of Leu66, on the back side of the C-helix in this view. The cavity is shown in light blue for reference. While residues before Leu66 displace very little, those beyond Leu66 have progressively larger displacements under pressure, clearly visible as a “kink” in the helix near Leu66.
Most notable is that helix C not only displaces with increasing pressure but also deforms. Helix C kinks near Leu66, which was also implicated in interactions with the N-terminal domain. This residue makes a number of close contacts with residues in the E and A helices, leading us to wonder whether this especially rigid region of the protein might be a nucleation center in folding (e.g. 21; 22). The deformation of helix-C, coupled to the knowledge that its C-terminal end makes few contacts with helices D and E, should make it clear that the helix backbone itself is not particularly rigid. The N-terminal end of the C-helix more closely follows the N-terminal domain displacements.
Helix H also displaces significantly as pressure increases, as shown in Figure 4. The helix tilts, so that its C-terminal end is displaced almost 0.2 Å towards the cavity, but its N-terminal end is displaced very little. It is evident from this figure that the displacements of the C, D and H helices are all towards the central cavity region of the C-terminal domain, which would seem to indicate that the protein is relaxing in a manner which reduces the cavity volume and thus reduces the total system volume in response to pressure. Indeed, the rotation of the H-helix seems consistent with its N-terminal end being pinned by steric contacts, while its C-terminal end is exposed to the cavity. Much to our surprise, these changes with pressure are independent of the L99A mutation.
Figure 4.
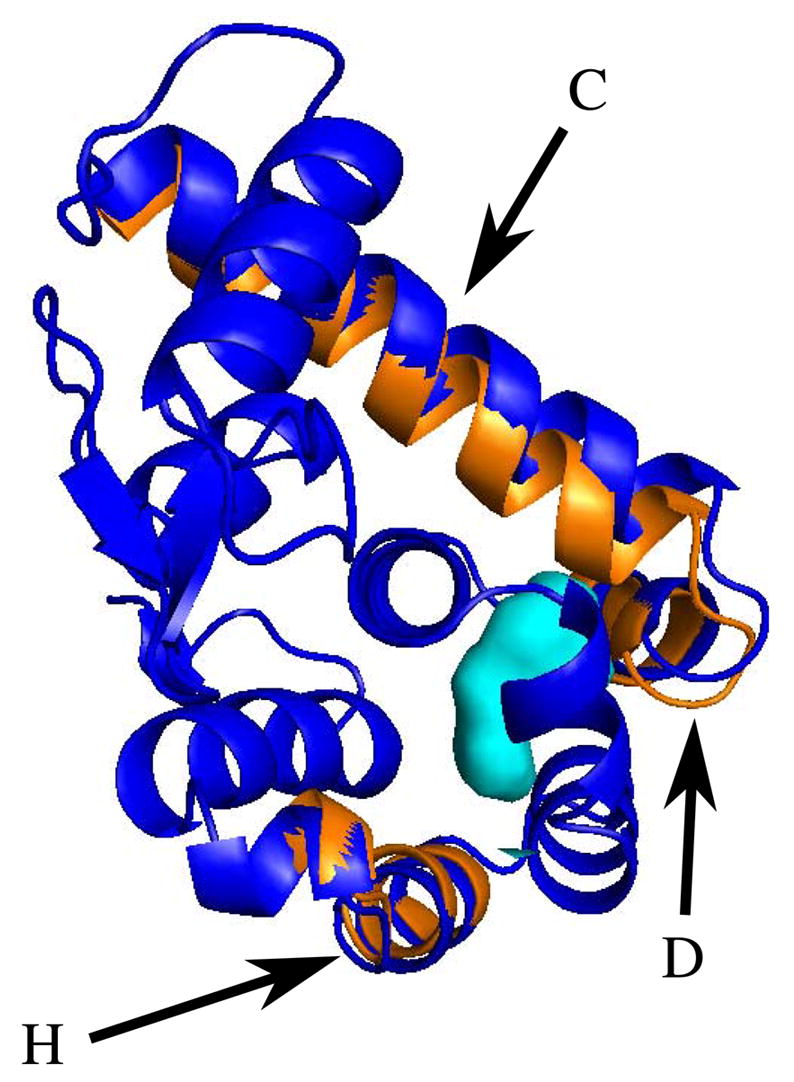
Displacements of the C, D and H helices. This view is opposite that in Figure 3; colors are as in Figure 3. Helices C and D are shown at the top of this figure, labelled by their respective letters. The arrow labelled “H” indicates the C-terminal end of helix H, which displaces slightly towards the cavity (shown in light blue.)
Figure 5 compares the displacements of the WT* and L99A α-carbon backbones at 200 MPa. Although there are some differences, the overall agreement is excellent. That is, the cavity has no detectable effect on the pressure response of the L99A mutant when compared to the WT* protein. There are noticeable differences, but in all cases except the F helix, these differences are well below our detection limits. The only significant difference between the pressure responses of the L99A and WT* proteins is that in the F helix, which is in poor electron density and thus somewhat suspect.
Figure 5.
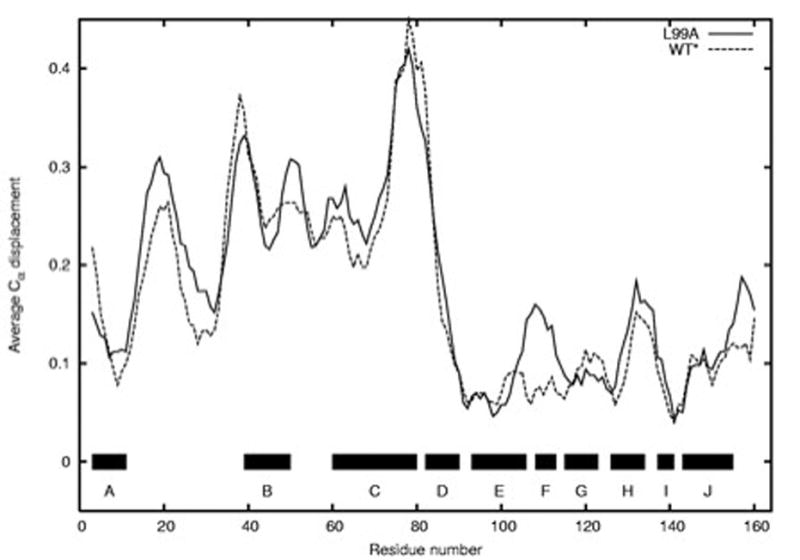
Comparison of WT* and L99A response to pressure. Bars and letters at bottom indicate positions of helices. Solid trace: displacements in L99A at 200 MPa; dashed trace: displacements in WT* at 200 MPa.
These are the major changes observable in the protein as pressure increases. Other helices do shift, but their displacements are sufficiently small as to be unreliable. Thus the domain realignment, deformation of helix C and associated changes in helix D, and the rotation of helix H towards the cavity, constitute the pressure response of both WT* and L99A T4 Lysozyme at pressures up to 200 MPa. Next we consider how other recently published aspects of the pressure response relate to this structural rigidity.
Water enters the L99A cavity at high pressure
The stiff structural response to pressure of the L99A cavity mutant was only one of our unexpected findings. We also observed that the crystallographically determined electron density in the cavity increased as the pressure increased 14. At ambient pressure, the cavity was found to be empty within the experimental. Since X-ray crystallography measures an average electron density, transient water penetration events must be rare at ambient pressure, if they occur at all. In contrast, at 200 MPa approximately two water molecules occupy the cavity on average, as estimated from the electron density integrated over the cavity volume. Molecular dynamics simulation showed that this was a primarily cooperative transition, in that water preferred to exist in clusters of four inside the cavity. Single water molecules and other clusters (2, 3 or 5 water molecules) contribute somewhat to the cavity hydration, but much less so than the four water molecule clusters.
For the purposes of this paper, the water-filling of this highly “hydrophobic” cavity is important because water is able to access the cavity. The observed filling of the cavity by water is a consequence of the pressure-induced increase in the free energy of water in the bulk relative to that of water in the nonpolar cavity. With the structure of the cavity suffering only modest changes up to at least 200 MPa, the system can lower its overall volume, and thereby its free energy, by filling the cavity. Such water penetration into the protein interior is believed to constitute a major factor in the pressure-induced destabilization of protein “hydrophobic” cores23, thus resolving Kauzmann’s paradoxical observation that proteins unfold under pressure even though transfer of hydrocarbons into water is disfavored by high pressures24.
This, however, is a statement about equilibrium; to establish that equilibrium, water must be able to diffuse into the cavity. The slight decrease in protein volume at elevated pressure indicates a tighter matrix, but water is still able to diffuse through to the cavity. If water diffuses through hydrophobic portions of the protein at elevated pressure, it is plausible that water continues to diffuse into less tightly packed hydrophobic regions found at room pressure. Though there is no equilibrium condition at room pressure which keeps water in the cavity, evidenced by the lack of electron density in the cavity at room pressure 1; 14; 25, water is probably moving in and out constantly.
Hydrophobic molecules, such as toluene, are known to occupy the cavity at room pressure 26; 27. This is not surprising, given the hydrophobic environment of the cavity. The fact that water also diffuses through the hydrophobic matrix is less expected, though not unreasonable since some water will dissolve even in oil. Accordingly, molecular dynamics simulations were performed to see possible routes of entry for water molecules 14. We observed two water escape events in two independent simulations, one from a tightly filled cavity (occupancy N=5), and a second one from a cavity filled with only one water molecule. In the N=5 simulation, escape is initiated when the confined water cluster reorganizes from a 4+1 hydrogen-bond structure (i.e., a square-like arrangement of four water molecules with a fifth one loosely attached) to a linear chain. The resulting 1D water wire extends from the cavity volume toward the phenyl ring of Phe114. The terminal water molecule of the water chain briefly forms a hydrogen bond to a water molecule at the protein-water surface through a narrow “channel” between Met106, Phe114, Ser136, and Trp138. However, as that hydrogen bond breaks, the terminal water molecule appears to be pushed into the adjacent “channel” between the side chains of Phe114 and Ser136, and the backbone of Leu133. From there, it forms a tight hydrogen bond to a surface water molecule that is itself hydrogen bonded to the backbone carbonyl oxygen of Asn132. In this configuration, the hydrogen bond breaks between the terminal water molecule and the rest of the water chain in the cavity. On a picosecond-timescale, the terminal water molecule escapes into the solvent, and the remaining four water molecules recede into the cavity. We observe a similar scenario in the escape of the single water molecule in the N=1 simulation. Again, the water molecule first moves from the cavity volume toward Phe114, then forms an elongated and correspondingly transient hydrogen bond to surface water through a narrow channel between Met106, Phe114, Ser136, and Trp138 before escaping through the adjacent channel between the side chains of Phe114 and Ser136, and the backbone of Leu133, assisted by a tight hydrogen bond to a surface water molecule. Most of these residues have been previously implicated in cavity ligand access by NMR studies28, the results of which were ultimately interpreted as implying an open and closed state for the cavity, with exchange times on the order of 0.5–1 ms. We conclude from these two independent observations in the simulation that this narrow channel is the likely entrance/exit pathway for water. Experimental support for a dynamic “opening and closing” in this region comes from the fact that the crystallographic B-factor of Phe114 is substantially higher than that of other phenylalanines in the protein.
Discussion
Two features in the pressure response of the T4 lysozyme mutants were surprising. First, the cavity in the L99A mutant was very resistant to collapse, even though this, of itself, could lower the system free energy by about 9 kBT. The other surprise is that the two mutants, one with a large cavity, and the other with a much smaller cavity in the C-terminal domain, have almost exactly the same response to pressure. It has been previously established that the creation of the large cavity in the L99A mutant destabilizes the protein by about 8 kBT, relative to the WT* mutant, so the presence of the cavity has severe thermodynamic consequences. In contrast, it has almost no structural consequence. We therefore urge caution in assigning volume properties of proteins to individual pairwise interactions; were we to do so here, we would find that hydrophobic type interactions have no volume dependence, a clearly unphysical result.
We find this interesting in light of the continuing discussion about the solid-like versus liquid-like nature of the protein interior. There are two obvious ways for the L99A mutant to respond to pressure to reduce the overall system volume: The cavity can collapse or it can fill with water. The fact that it does the latter has some implications for the material properties of proteins.
The cavity would not be expected to isotropically compress, since side groups have some shape, and like the stones in a bridge they simply cannot move in towards the cavity. But the cavity lining helices might be able to shear or deform, and in this way reduce the volume of the protein. Both our own simulation and crystallographic observations indicating that water is free to pass between the outside bulk and the cavity, and the general NMR result that side chain fluctuations are unaffected by pressure13 (that is, the compressibility is independent of pressure) indicate that the side chains should have a great deal of freedom to rearrange.
But we see no evidence for deformations or compressions that can be tied to the presence of the cavity. The cavity volume and shape is very unresponsive up to at least pressures of 200 MPa. What makes the structure so rigid? Two features are needed. First there must be strong interactions, and second these interactions must be directional, not isotropic. Side groups, viewed atomically, are bumpy surfaces, and these bumpy surfaces can interlock, providing resistance to both compression and shear. Yet small molecules can diffuse through the protein matrix, suggesting that the side groups execute significant fluctuations (as has been demonstrated by NMR, see Introduction).
While it is well established that in general side chains execute large fluctuations and the backbone is comparatively rigid, it has not been entirely clear why the backbone is rigid. Is it, for instance, hydrogen bonding alone? Akasaka’s NMR work, recently reviewed13, indicates that hydrogen bonds themselves are quite unresponsive to pressure. This is consistent with a small volume change of the hydrogen bond itself, but the NMR method used for that determination is less sensitive to the overall role the hydrogen bond plays in the bending rigidity of a helix. (Akasaka states, for instance, that only qualitative information is available about the peptide bond angles13.) It is clear from our observed deformation of helix C in the L99A T4 lysozyme that helices without close contacts to other neighboring structural elements of the protein are not in fact intrinsically rigid, but are relatively easily deformed. At its carboxy terminal end, helix C displaces by about 0.25Å (with a peak displacement of about 0.4Å) as pressure increases by 200 MPa. While the helix is pinned in place by a network of close contacts and hydrogen bonds near its middle point, at its C-terminus the atomic packing density is smaller. So clearly a helix can bend in response to pressure, and at a level that is probably significant to protein function (see, for instance, Urayama et al.15). Thus hydrogen bonds, while individually unresponsive to pressure, are not enough to resist deformation of the entire helix. Combined with our examination of the cavity, we see that side chain steric constraints can contribute substantially to the rigidity of a helix.
This raises a curious paradox: the side chains themselves fluctuate in many ways like a liquid, but confer on the backbone some measure of solid-like behavior. If the backbone is not intrinsically very rigid, and the side chains fluctuate so much, why aren’t they able to reorganize and allow deformations which would reduce the cavity volume? To reconcile these two observations, we have to consider what it means to be a liquid. In so doing we hope the reader will conclude, as we have, that the rigidity of the large cavity—and therefore of the backbone itself—of T4 Lysozyme mutant L99A is likely due to side chain steric interactions.
A liquid, by definition, has a translational symmetry that a protein amino acid side chain cannot have: the side chains are not interchangable, as are molecules of a liquid. The term “liquid-like” persists because of the demonstrated20 fast fluctuations of these side chains. But the amino acids are not free to translate past each other: topologically constrained by the backbone, the amino acids surrounding the cavity cannot shear and thus allow the cavity to deform. Nor can the helices rotate significantly, because of the interlocking nature of the side chains. Presumably, the backbone holds each amino acid in rough position, and the surface roughness (due to side chain shape) of each helix is sufficient that the helices neither rotate nor move past each other to reduce the cavity volume present in the L99A mutant.
We stress that neither is it new to say that the backbone is typically more rigid than the side chains, nor are we challenging this notion. Instead, what we find surpising is that the rigidity and order of the backbone depends on the side chains, an intrinsically fluctuating, less ordered medium. We are not aware of prior research which has come to this conclusion, and we find it remarkable because the same medium that allows small hydrophobic and hydrophilic molecules through the protein matrix is that which confers rigidity to other parts of the molecule.
Thus whether the protein looks like a solid or like a liquid thus appears to depend on the size of probe molecule. The fact that both toluene and water can diffuse through to occupy the L99A cavity suggests that hydrophobicity may be a less important constraint on the dynamics of the folded protein than the more fundamental considerations of topology.
The fact that the cavity does not collapse under pressure is also intriguing in light of the NMR data available on L99A T4 lysozyme, which found increased μs to ms dynamics only in the region immediately surrounding the cavity, versus the wild-type protein28. Combined, the two observations may imply that side chain fluctuations are correllated, rather than independent, which has occasionally been observed by NMR20. Yet, even if this is the case, we have identified at least one side chain (99) which is seemingly uninvolved in such correlated motion. More work to characterize the side chain dynamics differences in these T4 Lysozymes would be especially interesting.
Evidence of collective motions supports the notion that ligand access to the cavity is via an open-closed state transition, rather than random diffusion through an array of independently fluctuating amino acid side chains. It also supports the notion of context-dependent secondary and tertiary structure, discussed more below. In such a picture, the helical tendency of particular amino acid sequences provides only a rough template for the side chains. Detailed interactions, including steric effects, of the side chains then decide the final structure.
This might matter for protein folding, in particular because it seems that the helix cannot be fully formed until it aligns with its neighbors (e.g. 29; 30). Despite an apparently normal packing density, side chain interactions in the region around residue 67 on helix C lead to an unusually rigid part of both the L99A and WT* mutants of T4 lysozyme, visible as a pronounced “kink” in helix C in Figure 3. Since the rest of the helix is apparently deformable, it must be these side chain interactions, involving a hydrogen bond between His31 and Asp70, and side chain close contacts involving Phe4, Ile7, Ile29, Phe67, Val71, and Phe104. All of these residues appear as local displacement minima in Figure 1. Crystallographic B-factors, which measure atomic fluctuations, are lower for these residues than their surroundings as well. These residues define the kink in the middle of Helix C as pressure increases. We note that this region has been implicated before as a possible nucleation site in folding. In particular, the A, C, and E helices are the strongest helix formers22, the E-helix has been directly implicated as a folding nucleation site21, and tertiary contacts in this region are important for folding stability31.
But the question remains whether the A, C, and E helices are involved in folding nucleation because they are strong helix formers on their own, as suggested by Najbar22, or because these helices are involved in particularly important tertiary contacts. Even that study concedes that while helices A, C and E are the strongest helix formers, helices A and C rely mostly on tertiary contacts for their ultimate stability. Only the E helix is an especially strong helix former, with close to 50% helicity in all the solvents tested22. Our analysis, which might have been anticipated on the basis of thermal B-factors, suggests that tertiary contacts play the most important role in the formation of the protein structure. Such contacts between side chains appear to define the rigidity of the structure and the folding behavior as well, in good accord with prior studies emphasizing the importance of context in determining secondary structure30.
We also see possible implications for protein function. Regions of low compressibility are regions which do not have—at least in an average, ensemble sense—large volume fluctuations. While this does not exclude the possibility that a region has an important functional role20; 32, it does suggest that such a region has a greatly reduced number of accessible conformational states, making it less likely to be actively involved in the protein’s function. With the increased ability to see at high resolution (our error limits in this work are roughly 0.1Å), even small changes in the “width” of an ensemble distribution, should be apparent. Similarly, if under applied pressure two domains or structural elements are unable to move past or relative to each other, this should demonstrate a limitation on the motions at ambient pressure as well. Thus an analysis of the pressure response of proteins may help in establishing the possible functional modes of structural change of proteins, which is of increasing interest. Both NMR techniques, as have been demonstrated in excellent detail by Akasaka and others 9; 10; 33; 34; 35, crystallography like that demonstrated here and by others 15; 16; 17; 18, and simulations will be of use in understanding these effects.
Indeed the major pressure response of T4 Lysozyme is that the N-terminal and C-terminal domains move towards each other, evocative of the relative motions of these domains seen in molecular dynamics simulations36 and even more so of the dramatic reorientations of the two domains found in different crystal packing arrangements37. So far, preliminary studies with simple network analysis and normal mode calculations are able to reproduce some of the features of the pressure response of T4 Lysozymes, but only in an incomplete manner. We propose that high-pressure protein crystallography will be a useful tool in testing theories of protein function and modes of fluctuation.
Our presently speculative ideas about the nature of the rigidity of the L99A cavity should present a starting point in understanding how proteins fluctuate in their native states. In particular it would be useful to understand the contributions of specific atoms or interactions. With the present data, this requires the assumption that the various interactions are linearly independent of each other; based on our first analysis, this is likely not the case. But further combined mutagenesis and high pressure studies should be able to separate the various interactions and make more clear the interactions that control protein function and dynamics.
Methods
Crystal Growth
Crystals of both the L99A and WT* (cysteine-free) mutants of T4 Lysozyme were grown using the hanging drop vapor-diffusion method, as described previously 2. The protein concentrations were near 15 mg/mL, and wells were filled with a solution near 2 M Na/K-phosphate buffers at pH 6.9–7.1 with 50 mM of beta-mercaptoethanol added to improve crystal contacts. Crystals were grown at 4 C, but in some cases nucleation was induced by leaving the trays at room temperature for 2–3 days initially. Many crystals grew to small sizes around 100–200 μm, but all crystals used for these experiements were between 700 μm and 1 mm in their largest dimension. The crystals have a distinct triangular prism shape. In all cases, crystals were grown in space group P3221.
High Pressure Protein Crystallography
The high pressure equipment used for this work has been described previously by Urayama et al. 15. We use a beryllium high pressure cell based on the original design by Kundrot and Richards16, modified so that it can reach 200 MPa, as described in detail by Urayama 38. The cell itself is a high-purity rod of beryllium (Brush-Wellman grade I-250) with less than 3% beryllium-oxide (BeO) mixed in for strength. It is 25 mm long, 6.35 mm in diameter, and has a 1 mm blind hole 19mm deep drilled at one end. The open end is threaded for attachment to a pressure system. Because of the difficulty and hazards associated with machining Beryllium, the cell was machined to specification by Brush-Wellman, Inc.
Standard thin-wall glass x-ray capillaries (Charles Supper Co.) are first loaded with a mixture of Sephadex G-200 and the mother liquor of the crystals before loading the crystals themselves. This mixture is centrifuged to the bottom of the capillary. Crystals are most easily harvested with standard crystallographic loops and then transferred to the capillary. Crystals of T4 Lysozyme float in their mother liquor, so they cannot be centrifuged into the capillary. Instead, they must be gently pushed into the mother liquor-Sephadex mixture; a thin (0.3mm) capillary with a large glass bead (produced by flaming the tip) at the end is useful for this task. Care must be taken to hydrate the Sephadex fully, and to treat the crystal very gently, or the crystal will dehydrate or crack. Multiple crystals can be placed in one capillary, with bits of copper wire separating them. These bits of wire make later location of the crystals in the optically opaque Be cell possible. Careful measurement of the position of the crystals relative to the wires, used in combination with x-ray absorption measurements revealing the shadows of the copper wire, make crystal location straightforward. Finally, the capillary is sealed with a plug of syringe-injected stopcock grease to separate it from the pressurization medium.
Once the capillary is loaded, it is placed in the Be cell, and the cell connected to a home built adapter which connects to standard pressure fittings. The Be cell connection is a modified Bridgman seal using a small Viton O-ring. All other seals are standard high-pressure cone seals. A hand-cranked high pressure piston press (High Pressure Equipment Company, Erie, PA) capable of 200 MPa is used to generate pressure, and the pressure monitored using a strain-dependent resistor (Sensotec, Columbus, OH). A thin stainless steel capillary connects the press to the cell, permitting rotation of the cell for crystallographic data collection. The pressurization medium is Fluorinert FC-77 (3M Corporation; this fluid is a mixture of fluorocarbons having average molecular weight 416 g/mol). Data are otherwise collected using standard crystallographic protocols.
Refinement
Diffraction from the Beryllium cell itself limits the available resolution to about 2.0 Angstroms. DENZO 39 and Scalepack [ref] were used integrate and reduce the data. All structures were then refined using programs from the CCP4 suite 40, using either Protein Data Bank (PDB) entries 1L90 or 1L63 as a starting model for the L99A and WT* mutant, respectively. In both cases, refinement parameters were optimized globally over all 10 L99A and 6 WT* datasets, and one final set of parameters was used to refine the structures presented here. The program arp_waters (as implemented in the CCP4 suite) was used to examine and modify the water model after each refinement step. Manual modification was not found to be necessary after inspecting electron density maps using the program O 41. As pressure increases two residues, Ile29 and Phe114, begin to emerge from the most preferred Ramachandran regions in almost all of the structures. Ile29 is constrained by strong electron density, and Phe114 is in a region known to have generally poor density. Both deviate from the most-preferred regions (as defined in the program MOLEMAN2 42, available from xray.bmc.uu.se/usf) by as much as 5 degrees in both main chain torsional angles φ and ψ. That the appearance of these outliers is so consistent over all datasets gives some confidence that the deviations are real, although they could be consistent artifacts. Table 1 lists other important refinement parameters for the L99A mutant, averaged over datasets at each pressure. WT* refinement is essentially identical.
Comparison of refined structures
Structural comparisons discussed in this paper are based on alignment of the peptide backbone positions using a least-squares residual and only rotations of the molecules in question. The alignments were made using only coordinates of residues 80–160 in the C-terminal domain of the protein, for reasons given below. In order to emphasize structural changes no isotropic scaling was performed. The choice to align molecules using only the C-terminal domain serves two purposes: First, it emphasizes any displacements of the N-terminal domain relative to the C-terminal domain. Second, it facilitates examination of displacements within the C-terminal domain which are towards its center—that is, towards the center of the large cavity in this domain.
Since there are multiple structures at each pressure (as many as three), they are aligned to each other and averaged in real space first. This is done using a simplex algorithm as there is no analytic solution to the simultaneous alignment of more than two structures. The computer code is given in Collins 43. After averaging, the structures are aligned pairwise between pressures for comparison.
Detection limits
A key issue is to determine which displacements are statistically robust. The collection of multiple datasets and alignment of their refined structures makes this possible without recourse to any other arguments. The whole-molecule root-mean-square displacement of the peptide backbone between aligned structures at any given pressure is below 0.9Å for all pressures and both WT* and L99A mutants. This rms displacement decreases with pressure (as do the crystallographic B-factors). Therefore, displacements larger than twice this uncertainty, or about 0.18Å, are statistically significant. Displacements closer to the uncertainty level of ~ 0.1Å are certainly more suspect and the atomic model and crystallographic electron density should be closely compared before concluding that such a displacement is significant. Urayama also concluded, by other means, that displacements of ~0.1 Å could be considered real 38. Nevertheless, the quality of the electron density calculated from the diffraction data must be considered in each case. In almost all cases the electron density is of very high quality. Only near the C-terminus and near residue 116 is the electron density suspect.
Volume calculations
All volume calculations reported in this paper are made with the program VOLBL, described by Liang, et al. 44; 45. This program uses the so-called alpha-shape formalism [11, 12], which is similar to Voronoi decomposition, but overcomes some difficulties, particularly in defining the molecular envelope.
Acknowledgments
This work is supported by DOE-BER grant FG02-97ER62443 to SMG and NIH grant GM21967 to BWM. CHESS is supported by the NSF and NIH via NSF grant DMR-0225180. GH was supported by the intramural research program of the NIH, NIDDK. MDC is indebted to Chris Heaton, Bill Miller, Marian Szebenyi and David Schuller of MacCHESS for their assistance in this work, to Nozomi Ando for her encouragement and help with pressure equipment, and to Gil Toombes for many helpful conversations and encouragement.
Footnotes
Publisher's Disclaimer: This is a PDF file of an unedited manuscript that has been accepted for publication. As a service to our customers we are providing this early version of the manuscript. The manuscript will undergo copyediting, typesetting, and review of the resulting proof before it is published in its final citable form. Please note that during the production process errors may be discovered which could affect the content, and all legal disclaimers that apply to the journal pertain.
References
- 1.Eriksson AE, Baase WA, Matthews BW. Similar hydrophobic replacements of Leu99 and Phe153 within the core of T4 lysozyme have different structural and thermodynamic consequences. J Mol Biol. 1993;229:747–769. doi: 10.1006/jmbi.1993.1077. [DOI] [PubMed] [Google Scholar]
- 2.Eriksson AE, Baase WA, Zhang XJ, Blaber M, Baldwin EP, Matthews BW. Response of a protein structure to cavity-creating mutations and its relation to the hydrophobic effect. Science. 1992;255:178–183. doi: 10.1126/science.1553543. [DOI] [PubMed] [Google Scholar]
- 3.Xu J, Baase WA, Baldwin E, Matthews BW. The response of T4 Lysozyme to large-to-small substitutions within the core and its relation to the hydrophobic effect. Protein Sci. 1998;7:158–177. doi: 10.1002/pro.5560070117. [DOI] [PMC free article] [PubMed] [Google Scholar]
- 4.Baldwin E, Baase WA, Zhang X, Feher V, Matthews BW. Generation of ligand binding sites in T4 lysozyme by deficiency-creating substitutions. J Mol Biol. 1998;277:467–85. doi: 10.1006/jmbi.1997.1606. [DOI] [PubMed] [Google Scholar]
- 5.Liang J, Dill KA. Are proteins well-packed? . Biophys J. 2001;81:751–766. doi: 10.1016/S0006-3495(01)75739-6. [DOI] [PMC free article] [PubMed] [Google Scholar]
- 6.Frauenfelder H, Alberding NA, Ansari A, Braunstein D, Cowen BR, Hong MK, et al. Proteins and pressure. J Phys Chem. 1990;94:1024–1037. [Google Scholar]
- 7.Gross M, Jaenicke R. Proteins under pressure: the influence of high hydrostatic pressure on structure, function, and assembly of proteins and protein complexes. Eur J Biochem. 1994;221:617. doi: 10.1111/j.1432-1033.1994.tb18774.x. [DOI] [PubMed] [Google Scholar]
- 8.Mozhaev VV, Heremans K, Frank J, Masson P, Balny C. High pressure effects on protein structure and function. Proteins: Struct, Funct, Genet. 1996;24:81–91. doi: 10.1002/(SICI)1097-0134(199601)24:1<81::AID-PROT6>3.0.CO;2-R. [DOI] [PubMed] [Google Scholar]
- 9.Kamatari YO, Kitahara R, Yamada H, Yokoyama S, Akasaka K. High-pressure NMR spectroscopy for characterizing folding intermediates and denatured states of proteins. Methods. 2004;34:133–143. doi: 10.1016/j.ymeth.2004.03.010. [DOI] [PubMed] [Google Scholar]
- 10.Kitahara R, Yokoyama S, Akasaka K. NMR snapshots of a fluctuating protein structure: ubiquitin at 30 bar--3 kbar. J Mol Biol. 2005;347:277–285. doi: 10.1016/j.jmb.2005.01.052. [DOI] [PubMed] [Google Scholar]
- 11.Fuentes EJ, Wand AJ. Local Stability and Dynamics of Apocytochrome b562 Examined by the Dependence of Hydrogen Exchange on Hydrostatic Pressure. Biochemistry. 1998;37:9877–9883. doi: 10.1021/bi980894o. [DOI] [PubMed] [Google Scholar]
- 12.Hitchens TK, Bryant RG. Pressure dependence of amide hydrogen-deuterium exchange rates for individual sites in T4 lysozyme. Biochemistry. 1998;37:5878–5887. doi: 10.1021/bi972950b. [DOI] [PubMed] [Google Scholar]
- 13.Akasaka K. Probing conformational fluctuation of proteins by pressure perturbation. Chem Rev. 2006;106:1814–1835. doi: 10.1021/cr040440z. [DOI] [PubMed] [Google Scholar]
- 14.Collins MD, Hummer G, Quillin ML, Matthews BW, Gruner SM. Cooperative water filling of a nonpolar protein cavity observed by high-pressure crystallography and simulation. Proc Natl Acad Sci USA. 2005;102:16668–16671. doi: 10.1073/pnas.0508224102. [DOI] [PMC free article] [PubMed] [Google Scholar]
- 15.Urayama P, Phillips GN, Gruner SM. Probing substates in sperm whale myoglobin using high-pressure crystallography. Structure. 2002;10:51–60. doi: 10.1016/s0969-2126(01)00699-2. [DOI] [PubMed] [Google Scholar]
- 16.Kundrot CE, Richards FM. Collection and Processing of X-ray Diffraction Data from Protein Crystals at High Pressure. J Appl Crystallogr. 1986;19:208–213. [Google Scholar]
- 17.Kundrot CE, Richards FM. Crystal structure of hen egg-white lysozyme at a hydrostatic pressure of 1000 atmospheres. J Mol Biol. 1987;193:157–170. doi: 10.1016/0022-2836(87)90634-6. [DOI] [PubMed] [Google Scholar]
- 18.Kim CU, Kapfer R, Gruner SM. High-pressure cooling of protein crystals without cryoprotectants. Acta Crystallogr. 2005;D61:881–890. doi: 10.1107/S090744490500836X. [DOI] [PubMed] [Google Scholar]
- 19.Girard E, Kahn R, Mezouar M, Dhaussy AC, Lin T, Johnson JE, et al. The first crystal structure of a macromolecular assembly under high pressure:CpMV at 330 MPa. Biophys J. 2005 doi: 10.1529/biophysj.104.058636. [DOI] [PMC free article] [PubMed] [Google Scholar]
- 20.Igumenova TI, Frederick KK, Wand AJ. Characterization of the Fast Dynamics of Protein Amino Acid Side Chains Using NMR Relaxation in Solution. Chem Rev. 2006;106:1672–1699. doi: 10.1021/cr040422h. [DOI] [PMC free article] [PubMed] [Google Scholar]
- 21.Llinas M, Gillespie B, Dahlquist FW, Marqusee S. The energetics of T4 lysozyme reveal a hierarchy of conformations. Nat Struct Biol. 1999;6:1072–8. doi: 10.1038/14956. [DOI] [PubMed] [Google Scholar]
- 22.Najbar LV, Craik DJ, Wade JD, McLeish MJ. Identification of initiation sites for T4 lysozyme folding using CD and NMR spectroscopy of peptide fragments. Biochemistry. 2000;39:5911–5920. doi: 10.1021/bi000070i. [DOI] [PubMed] [Google Scholar]
- 23.Hummer G, Garde S, Garcia AE, Paulaitis ME, Pratt LR. The pressure dependence of hydrophobic interactions is consistent with the observed pressure denaturation of proteins. Proc Natl Acad Sci USA. 1998;95:1552–1555. doi: 10.1073/pnas.95.4.1552. [DOI] [PMC free article] [PubMed] [Google Scholar]
- 24.Kauzmann W. Thermodynamics of unfolding. Nature. 1987;325:763–764. [Google Scholar]
- 25.Quillin ML, Breyer WA, Griswold IJ, Matthews BW. Size versus polarizability in protein-ligand interactions: Binding of noble gases within engineered cavities in phage T4 lysozyme. J Mol Biol. 2000;302:955–977. doi: 10.1006/jmbi.2000.4063. [DOI] [PubMed] [Google Scholar]
- 26.Morton A, Baase WA, Matthews BW. Energetic origins of specificity of ligand binding in an interior nonpolar cavity of T4 lysozyme. Biochemistry. 1995;34:8564–8575. doi: 10.1021/bi00027a006. [DOI] [PubMed] [Google Scholar]
- 27.Eriksson AE, Baase WA, Wozniak JA, Matthews BW. A cavity-containing mutant of T4 lysozyme is stabilized by buried benzene. Nature. 1992;355:371–373. doi: 10.1038/355371a0. [DOI] [PubMed] [Google Scholar]
- 28.Mulder FAA, Hon B, Muhandiram DR, Dahlquist FW, Kay LE. Flexibility and ligand exchange in a buried cavity mutant of T4 lysozyme studied by multinuclear NMR. Biochemistry. 2000;39:12614–12622. doi: 10.1021/bi001351t. [DOI] [PubMed] [Google Scholar]
- 29.Cheung MS, Garcia AE, Onuchic JN. Protein folding mediated by solvation: water expulsion and formation of the hydrophobic core after collapse. Proc Natl Acad Sci USA. 2002;99:685–690. doi: 10.1073/pnas.022387699. [DOI] [PMC free article] [PubMed] [Google Scholar]
- 30.Minor DL, Kim PS. Context-dependent secondary structure formation of a designed protein sequence. Nature. 1996;380:730–734. doi: 10.1038/380730a0. [DOI] [PubMed] [Google Scholar]
- 31.Llinas M, Marqusee S. Subdomain interactions as a determinant in the folding and stability of T4 lysozyme. Protein Sci. 1998;7:96–104. doi: 10.1002/pro.5560070110. [DOI] [PMC free article] [PubMed] [Google Scholar]
- 32.Cooper A, Dryden DTF. Eur Biophys J. 1984;11:103. doi: 10.1007/BF00276625. [DOI] [PubMed] [Google Scholar]
- 33.Refaee M, Tezuka T, Akasaka K, Williamson MP. Pressure-dependent changes in the solution structure of hen egg-white lysozyme. J Mol Biol. 2003;327:857–865. doi: 10.1016/s0022-2836(03)00209-2. [DOI] [PubMed] [Google Scholar]
- 34.Williamson MP, Akasaka K, Refaee M. The solution structure of bovine pancreatic trypsin inhibitor at high pressure. Protein Sci. 2003;12:1971–1979. doi: 10.1110/ps.0242103. [DOI] [PMC free article] [PubMed] [Google Scholar]
- 35.Kitahara R, Royer C, Yamada H, Boyer M, Saldana J-L, Akasaka K, et al. Equilibrium and pressure-jump relaxation studies of the conformational transitions of P13MTCP1. J Mol Biol. 2002;320:609–628. doi: 10.1016/s0022-2836(02)00516-8. [DOI] [PubMed] [Google Scholar]
- 36.Mann G, Hermans J. Modeling protein-small molecule interactions: structure and thermodynamics of noble gases binding in a cavity in mutant phage T4 lysozyme L99A. J Mol Biol. 2000;302:979–989. doi: 10.1006/jmbi.2000.4064. [DOI] [PubMed] [Google Scholar]
- 37.Zhang X-j, Wozniak JA, Matthews BW. Protein flexibility and adaptability seen in 25 crystal forms of T4 lysozyme. J Mol Biol. 1995;250:527–552. doi: 10.1006/jmbi.1995.0396. [DOI] [PubMed] [Google Scholar]
- 38.Urayama PK. Techniques for High Pressure Macromolecular Crystallography and the Effects of Pressure on the Structure of Sperm Whale Myoglobin. Princeton University; 2001. [Google Scholar]
- 39.Otwinowski Z, Minor W. Processing of X-ray Diffraction Data Collected in Oscillation Mode. In: Carter JCW, Sweet RM, editors. Methods Enzymol. Vol. 276. Academic Press; 1997. pp. 307–326. [DOI] [PubMed] [Google Scholar]
- 40.Collaborative Computational Project N. The CCP4 suite: Programs for protein prystallography. Acta Crystallogr. 1994;D50:760–763. doi: 10.1107/S0907444994003112. [DOI] [PubMed] [Google Scholar]
- 41.Kleywegt GJ, Zou JY, Kjeldgaard M, Jones TA. Around O. In: Rossman MG, Arnold E, editors. {International Tables for Crystallography, Vol F Crystallography of Biological Macromolecules} Dordrecth; Kluwer Academic Publishers, The Netherlands: 2001. pp. 353–356.pp. 366–367. [Google Scholar]
- 42.Kleywegt GJ, Jones TA. Phi/Psi-chology: Ramachandran revisited. Structure. 1996;4:1395–1400. doi: 10.1016/s0969-2126(96)00147-5. [DOI] [PubMed] [Google Scholar]
- 43.Collins MD. High Pressure X-ray Crystallography and Core Hydrophobicity of T4 Lysozymes. Cornell University; 2006. [Google Scholar]
- 44.Liang J, Edelsbrunner H, Fu P, Sudhakar PV. Analytical Shape Computation of Macromolecules: I. Molecular Area and Volume Through Alpha Shape. Proteins: Structure, Function and Genetics. 1998;33:1–17. [PubMed] [Google Scholar]
- 45.Liang J, Edelsbrunner H, Fu P, Sudhakar PV. Analytical Shape Computation of Macromolecules: II. Inaccessible Cavities in Proteins. Proteins: Structure, Function and Genetics. 1998;33:18–29. [PubMed] [Google Scholar]