
Figure 1.
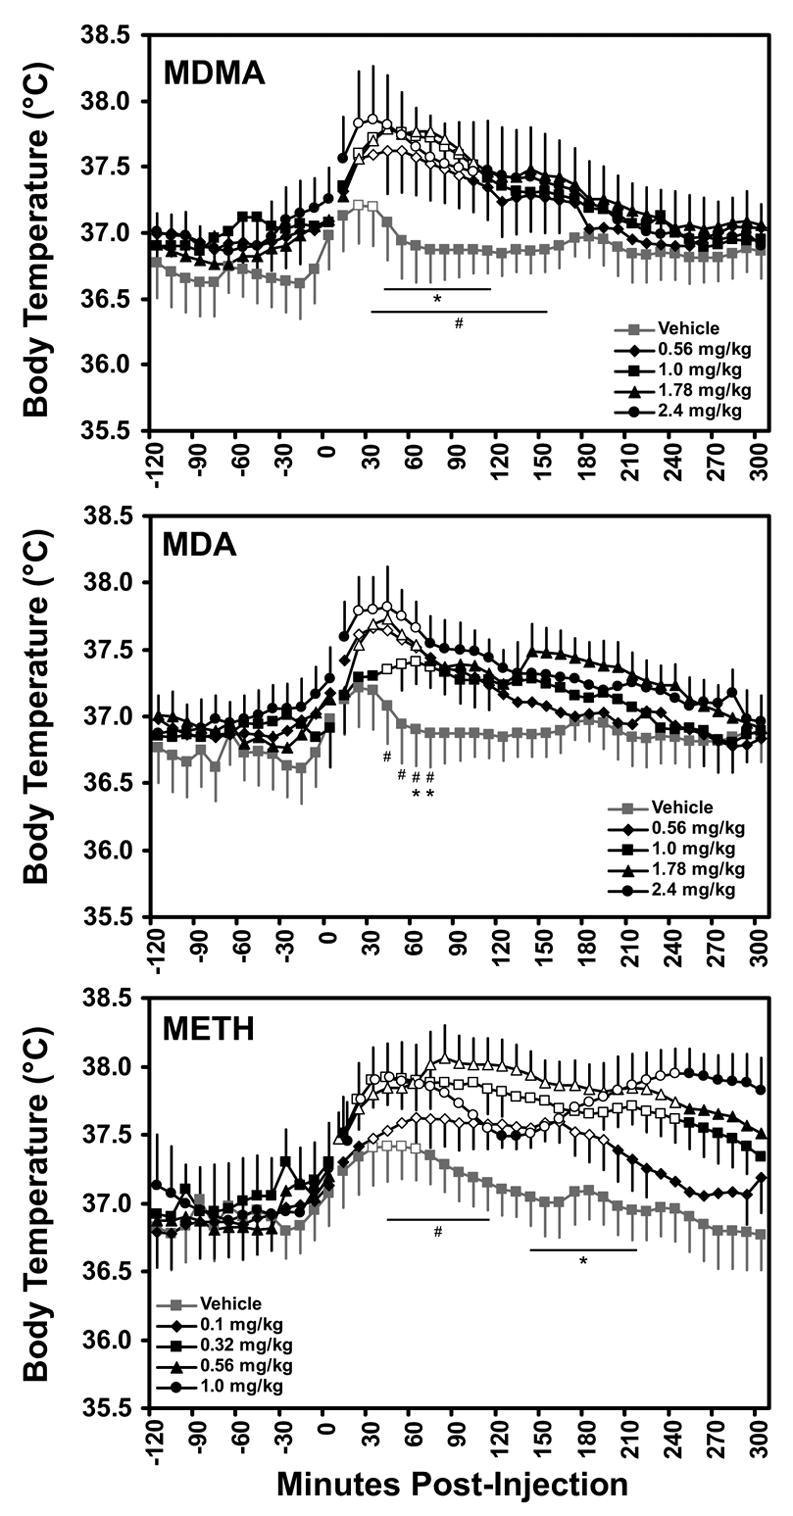
The mean (N=6, bars indicate SEM) subcutaneous temperature values following acute challenge with doses of (±)3,4-methylenedioxymethamphetamine (MDMA), (±)3,4-methylenedioxyamphetamine (MDA) and (+)methamphetamine (METH) are presented. Breaks in the series indicate the time of injection. The statistical analysis included the interval −10 to 240 minutes after injection and a significant change from the −10 min time point is indicated by the open symbol for each treatment condition. The * and # indicate timepoints in which all four (*) or three of four (#) active dose conditions differed significantly from the vehicle temperature; see text for additional effects determined to be statistically reliable.