
Figure 4.
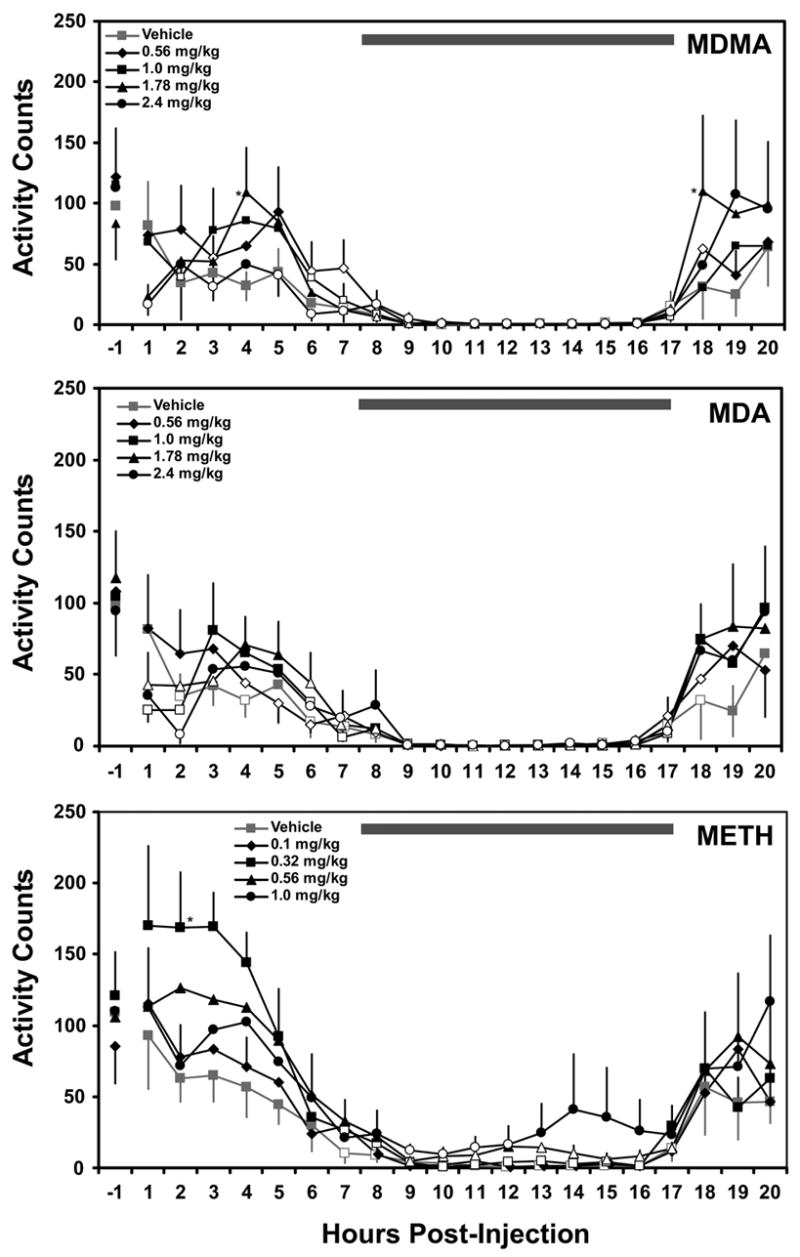
The mean (N=6, bars indicate SEM) activity values in the 20 hours following acute challenge with doses of (±)MDMA, (±)MDA and (+)METH are presented. Error bars (SEM) are selectively presented for visual clarity. The statistical analysis included the interval −1 to 18 hours after injection and the open symbols indicate a significant difference from the pre-injection baseline and a significant increase from the vehicle conditions is indicated by *.