

Abstract
We previously reported loss of expression of p27Kip1 (p27) protein in rat GH3 and mouse GHRH-CL1 pituitary tumor cells compared with normal pituitary (NP). The molecular basis for the loss of expression of p27 protein in GH3 and GHRH-CL1 cells is unknown. To determine the role of p27 gene methylation in the regulation of the expression of this cell cycle protein, the methylation patterns of p27 in normal and neoplastic pituitary cells was analyzed. Inhibition of DNA methyltransferase (DNA-MTase) with 5-aza-2′-deoxycytidine (AZAdC) induced expression of both p27 protein and mRNA when GH3 and GHRH-CL1 cells were treated for 7 days in vitro. DNA methylation correlated inversely with the expression of p27 gene products in NP and pituitary tumor cell lines. Bisulfite genomic sequencing analysis showed that the normally unmethylated cytosines in exon 1 in NP and AtT20 cells were extensively methylated in GH3 and GHRH-CL1 cells. After treatment of GH3 and GHRH-CL1 cells with 10 μmol/L AZAdC, there were decreased numbers of methylated cytosines (by 60% to 90%) with variable methylation patterns observed by bisulfite genomic sequencing. Analysis of genomic DNA with methylation-sensitive enzymes showed that all SmaI, HhaI, and AvaI enzyme sites of the p27 gene in exon 1 were methylated in GH3 cells but not in NP, confirming the bisulfite genomic sequencing results. AtT20 cells and a human pituitary null cell adenoma cell line (HP75), which expressed abundant p27, had a methylation pattern similar to the NP. DNA-MTase activity was elevated fourfold in GH3 cells and twofold in GHRH-CL1 cells compared with DNA-MTase activity in NP and AtT20 cells. These results suggest that increased DNA methylation is another mechanism of silencing of the p27 gene in some pituitary tumors and possibly in other types of neoplasms.
The p27Kip1 (p27) gene has been implicated as a tumor suppressor gene, because expression of p27 protein is often decreased in many tumor cells. In addition, p27-deficient mice develop increased body weight, visceromegaly, and tumors of the intermediate lobe of the pituitary. 1-4 However, unlike other traditional tumor suppressor genes, homozygous deletions and point mutations are uncommon in the p27 gene. 5,6 Interestingly, the absence of p27 protein expression is a negative prognostic marker in an increasing number of neoplasms, including colorectal, breast, and non-small-cell lung carcinomas. 7-9 We previously reported loss of expression of p27 protein in rat GH3 and mouse GHRH-CL1 pituitary tumor cell lines compared with normal pituitary (NP). 1 Although some recent experiments suggested that enhanced degradation by the proteasome ubiquitin pathway is the principal post-translational mechanism that regulates p27 in aggressive tumors, it is possible that multiple mechanisms are involved in the inactivation of the p27 gene in some of these tumors. 10,11
In normal tissues, methylation of the promoter region CpG islands is associated with transcriptional silencing of imprinted alleles and genes on the inactive X chromosome. 12-14 These patterns of methylation are often altered in tumors. Indeed, aberrant DNA methylation of the promoter region CpG islands can serve as an alternative to mutations in the coding region for the inactivation of tumor suppressor genes, including the retinoblastoma gene (Rb), p16INK4A, and p15INK4B. 15-19 Hypermethylation of the p16 CpG island promoter correlated with transcriptional silencing, whereas treatment with 5-aza-2′-deoxycytidine (AZAdC) reactivated transcription in some tumors and cell lines. 13,18,19 Thus, multiple mechanisms for inactivation of the remaining p16 allele in primary tumors with 9p21 loss of heterozygozity have been reported, but the frequency of these mechanisms varies with different tumor types. Promoters silenced by methylation can be reactivated in many cases by treatment with the drug AZAdC, which is a well established inhibitor of DNA methylation. 12-19 Moreover, DNA methylation abnormalities in neoplastic cells is associated with an apparent increase in DNA methyltransferase (DNA-MTase) activity. 20,21
To determine whether methylation of the p27 gene is involved in loss of expression of p27 protein in GH3 and GHRH-CL1 cells, we used bisulfite-modified genomic sequencing to provide a detailed map of the methylation patterns in the p27 gene in normal rat pituitary and in various pituitary tumor cell lines and methylation-specific polymerase chain reaction (PCR) to detect methylation sites in exon 1 of the p27 gene. DNA-MTase mRNA expression and its activity in NP and pituitary tumor cells were also measured. Our results showed that DNA methylation of the p27 gene is an important mechanism regulating p27 expression in pituitary tumor cells.
Materials and Methods
Animals and Chemicals
NPs were obtained from female 60-day-old Wistar-Furth rats (Harlan, Indianapolis, IN). Total RNA was extracted with the TRIzol reagent kit (Life Technologies, Gaithersburg, MD) as specified by the manufacturer. Genomic DNA was prepared by previously reported. 22 The monoclonal antibody to p27 was purchased from Transduction Laboratories (Lexington, KY). The prolactin (PRL) antibody was from the National Pituitary Agency (Bethesda, MD).
Reverse Transcription PCR
p27 expression was examined by reverse transcription (RT)-PCR and immunocytochemistry (ICC). 1 DNA-MTase gene transcripts (mRNA) were measured by semiquantitative RT-PCR as previously described. 1,23 DNA-MTase and GAPDH were co-amplified in the same reaction. Primer sequences of DNA-MTase were as follows: sense, 5′-GGA AAG CAG AAA TGG CAG ACT-3′ (296 to 316), and the antisense, 5′-GAT TCA TTT GCG TTT CCC TTT-3′ (495 to 515). 24
Cell Culture and Treatment with AZAdC
The rat GH3 cell line secreting PRL and growth hormone (GH) derived from the rat MtT W5 pituitary tumor and the AtT20 mouse pituitary cell line secreting adrenocorticotrophin were obtained from the American Type Culture Collection (Rockville, MD). The mouse GHRH-CL1 cell line was developed from a GH-releasing hormone transgenic mouse pituitary tumor. 1,23 HP75 human pituitary tumor cell line was generated in our laboratory. 25 Cell lines were grown in Dulbecco’s modified Eagle’s medium supplemented with 15% horse serum, 2.5% fetal calf serum, 1 μg/ml insulin, and 1% antibiotics (100 U/ml penicillin, 100 μg/ml streptomycin, and 0.25 μg/ml fungizone). GH3 and GHRH-CL1 cells were treated with different concentrations of AZAdC (Sigma Chemical Co., St. Louis, MO; 0.5 to 30 μmol/L) for 1 to 7 days and then harvested, aliquots of cells were placed on slides by cytocentrifugation (1 × 10 5 cells per slide), and the remainder (10 × 10 6 cells per group) was used for RNA and DNA preparations. 1,22 Cell proliferation analyses and ICC were done as previously reported. 1,23
Bisulfite Genomic Sequencing
Denatured genomic DNA was modified by reaction with bisulfite under conditions that convert all unmethylated cytosines to uracils. Genomic DNA from NP and pituitary tumor cells was modified by bisulfite using standard procedures. 26 Briefly, 2 μg of genomic DNA was denatured in a final volume of 29 μl, with freshly prepared NaOH at a final concentration of 0.3 mol/L for 15 minutes at 37°C, and 208 μl of freshly prepared 2.2 mol/L sodium metabisulfite (Sigma)/0.5 mmol/L hydroquinone (Sigma) mixture (pH 5.0) was added to each denatured DNA sample and incubated under mineral oil at 50°C for at least 16 hours. Bisulfite-modified DNA was recovered using the Wizard resin (Promega, Madison, WI) and desulfonated before PCR amplification in 50 μl of H2O followed by treatment with NaOH at a final concentration of 0.3 mol/L for 20 minutes at 37°C. The reaction was neutralized with 30 μl of 10 mol/L ammonium acetate. Each DNA sample was purified by ethanol precipitation and resuspended in 50 μl of H2O. The PCR reaction was performed in a volume of 100 μl. 1 PCR primers (Figure 1) ▶ were designed to be complementary to the converted DNA sequences with a minimum of CpG dinucleotides in the corresponding region of the original unconverted DNA. Each DNA sample was analyzed four times for bisulfite conversion reaction. To ensure that the bisulfite conversion was complete, a control digestion was performed with Hsp 92II enzyme, which has a recognition sequence (CATG) that should be destroyed by the bisulfite conversion. Any cleavage by Hsp 92II indicated either non-CpG DNA methylation or incomplete sodium bisulfite conversion. 27 PCR-generated DNA fragments were ligated into the Topo TA cloning vector using standard protocols (Invitrogen, Carlsbad, CA). Cloning of PCR products amplified from bisulfite-modified DNA was performed with at least four plasmid clones, which were then sequenced using forward and reverse M13 primers that yielded sequences from both strands. Sequence data analyses were performed using the GCG program (University of Wisconsin, Madison, WI). The sequence of the p27 gene from NP and tumor cell lines before and after bisulfite modification was compared with the original sequence in the GenBank database (accession numbers D86924, U09968, and U10906 for rat, mouse, and human, respectively). Automated sequencing was done in the Molecular Biology Core at the Mayo Clinic using an ABI PRISM 377 DNA sequencer (Perkin Elmer, Norwalk, CT).
Figure 1.

Schematic map of p27 gene. The sites for methylation-sensitive and other restriction enzymes are shown as vertical lines. The primer sets (arrows) are indicated with the approximate position (GenBank accession number D86924, rat sequence). Primers used for bisulfite genomic DNA sequencing were 1) sense, 5′-ATG TTA AAT GTG AGA GTG TTT AAT GGG AG-3′ (1 to 29) and 2) antisense, 5′- CTT CTA CCA CAA ATC ACT TCC TCA TCC-3′ (449 to 475). Primers for PCR-based methylation analysis were 3) sense, 5′-AGA GTG TCT AAC GGG AGC CCG-3′ (13 to 33), 4) sense, 5′-GAG GGC AGA TAC GAG TGG CAG-3′ (211 to 231), 5) antisense, 5′-CTG GAC ACT GCT CCG CTA ACC-3′ (428 to 448), and 6) antisense, 5′-CTT CTT GGG CGT CTG CTC CAC-3′ (550 to 570). *Restriction site for Hsp 92II, a methylation-insensitive enzyme. SS, sense; AS, antisense.
PCR-Based Methylation Assay
A PCR-based method was used to confirm p27 gene methylation patterns from the bisulfite DNA sequencing. Genomic DNA (500 ng) was digested with methylation-sensitive enzymes under conditions specified by the manufacturer, and 50 ng of DNA was used for amplification with the exon 1 primer sets of p27 (Figure 1) ▶ flanking the restriction sites. Identical restriction sites could be examined in exon 1 of p27, which included SmaI, HhaI, and AvaI. Controls included p27 gene completely digested by PstI, undigested p27 gene incubated with HindIII, and DNA without enzyme digestion. The PCR conditions used were as described previously. 1,23 To rule out the possibility of incomplete digestion, all samples were digested with each of the enzymes in two independent experiments. PCR amplifications from each of the duplicate digests were repeated at least twice. To prevent overcycling, the cycle number was determined for each primer set by performing a cycle curve number using undigested template and template digested with PstI restriction enzyme, which did not produce any signal.
DNA-MTase Activity Assay
The activity of DNA-MTase was determined as described by Adams et al. 20,28 NP and tumor cells were homogenized on ice in 500 μl of lysis buffer (50 mmol/L Tris, pH 7.8, 1 mmol/L EDTA, 1 mmol/L dithiothreitol, 0.01% sodium azide, 6 mg/100 ml phenylmethylsulfonyl fluoride, 10% glycerol, and 1% Tween 80). This suspension was then passed twice through a 25-gauge needle, frozen at −70°C, and then thawed at 37°C. The freeze-thaw cycle was repeated three times. The protein concentration in the extracts was determined using a protein assay kit (Bio-Rad Laboratories, Hercules, CA). Five micrograms of cellular protein was mixed with 500 ng of poly(dI-dC)·poly(dI-dC) (Pharmacia Biotechnology, Piscataway, NJ) and 3 μCi of [methyl-3H]S-adenosyl-l-methionine (75 Ci/mmol; Amersham, Arlington Heights, IL) in a total volume of 20 μl, and this solution was incubated at 37°C for 2 hours. The reaction was stopped by adding 300 μl of a solution containing 1% sodium dodecyl sulfate, 2 mmol/L EDTA, 3% 4-aminosalicylate, 5% butanol, 125 mmol/L sodium chloride, 0.25 mg/ml carrier salmon testis DNA, and 1 mg/ml proteinase K. After an additional 30 minutes of incubation at 37°C, the mixture was then extracted twice with phenol/chloroform/isoamyl alcohol (25:24:1) and ethanol precipitation. RNA was removed by resuspension in 0.3 mol/L sodium hydroxide and incubation at 37°C for 30 to 45 minutes, and the final solution was spotted on a Whatman GF/C filter and then dried at 80°C for 5 minutes, washed in ice-cold 5% trichloroacetic acid followed by 70% ethanol, placed in 5 ml of scintillation fluid (Beckman Instrument, Fullerton, CA), and counted in a Beckman scintillation counter. Negative control reactions lacked poly(dI-dC)·poly(dI-dC). Results are expressed as cpm per 5 μg of protein per 2 hours incubation minus the value of the negative control.
Statistical Analysis
A minimum of three independent experiments using three or more replicates per treatment group were done. Statistical analysis was done with the Student’s t-test. Results are expressed as the mean ± SE.
Results
p27 Expression Induced by AZAdC in GH3 and GHRH-CL1 Pituitary Tumor Cells
After immunostaining with the anti-p27 antibody, p27 protein was readily detected in NP cells, as nuclear staining (Figure 2 ▶ , left), but not in GH3 cells (Figure 2 ▶ , middle). GH3 cells were exposed for different times (range, 1 to 7 days) with various concentrations of AZAdC between 0.5 and 30 μmol/L. Treatment with 10 μmol/L AZAdC for 7 days produced the maximal induction of p27 with the lowest toxicity. p27 expression evaluated by ICC was localized in the nucleus of GH3 cells. After 10 μmol/L AZAdC treatment for 7 days, approximately 50% of GH3 cells were positive for p27 by ICC (Figure 2 ▶ , right). GHRH-CL1 cells also were negative for p27 staining. After AZAdC treatment for 7 days, up to 40 to 50% of GHRH-CL1 cells were stained with anti-p27 antibody as strong nuclear positive. AtT20 and HP75 cells normally expressed p27 with 60 to 70% and 30 to 40% positive cells detected by ICC, respectively (data not shown).
Figure 2.

Immunocytochemical staining for p27 protein. Normal pituitary cells are positive as indicated by brown nuclear staining (left) whereas control GH3 cells are negative (middle). After treatment with AZAdC for 7 days, the GH3 cells show increased p27 expression as positive nuclear staining (right). Hematoxylin was used as a counterstain and resulted in blue nuclear staining.
RT-PCR analysis showed the presence of a 238-bp PCR product in NP, AtT20, AZAdC-treated GH3, and GHRH-CL1 cells with the PCR primers shown in Figure 1 ▶ . Duplex RT-PCR using GAPDH as an internal standard in the same reaction was used to confirm the mRNA quality (Figure 3) ▶ . Three weeks after discontinuation of AZAdC treatment, 40 to 50% of GH3 cells remained positive for p27. There was more than a twofold increase in PRL expression (control, 9.8 ± 1.1%; treated, 22.5 ± 1.6%; P < 0.01) by ICC in AZAdC-treated cells. AZAdC inhibited GH3 cell proliferation as shown by [3H]thymidine incorporation ([3H]thymidine labeling index: control, 25.6 ± 0.8%; treated, 8.2 ± 0.5%; P < 0.001).
Figure 3.

p27 mRNA expression in NP and pituitary tumor cells and the effects of AZAdC on p27 gene transcription by RT-PCR. Total RNA from NP and pituitary tumor cells was analyzed by semiquantitative RT-PCR, and p27 and GAPDH were co-amplified in the same reaction. Top: PCR fragment, GAPDH (495 bp). Bottom: PCR fragment p27 (238 bp), generated from primers 4 and 5. Lane 1, NP; lane 2, GH3 cell control; lane 3, AZAdC-treated GH3 cells; lane 4, GHRH-CL1 cell control; lane 5, AZAdC-treated GHRH-CL1; lane 6, AtT20 cells.
The p27 Gene Is Extensively Methylated in GH3 and GHRH-CL1 Cells Compared with Normal Pituitary
Sequencing analysis of exon 1 and exon 2 (primers 3 and 6 in Figure 1 ▶ ) showed that p27 gene mutations were not present in GH3 tumor cells. The splicing sites for exons 1 and 2 in the rat p27 gene were confirmed by sequencing of intron 1 (data not shown).
To elucidate the specific location of DNA methylation in the p27 gene, we used the bisulfite genomic sequencing method, which allows unambiguous identification of sites of methylated cytosines in clones derived from individual DNA strands. Bisulfite DNA sequencing showed complete conversion of the control enzyme restriction site (Hsp 92II). PCR products were not cleaved by the Hsp 92II, which confirmed the bisulfite sequencing data. To eliminate the possibility that our analyses were affected by selection bias introduced by the cloning procedures, after cloning of the each PCR reaction product in Topo TA plasmid, at least four randomly selected clones with the correct size inserts were sequenced. Detailed sequence data are shown for seven different representative samples covering bases 34 to 153 (Figure 4) ▶ . A total of eight methylated cytosines in GH3 cells and seven methylated cytosines in GHRH-CL1 cells were found in this region, but no methylated cytosines were present in the NP and AtT20 cells in this region.
Figure 4.
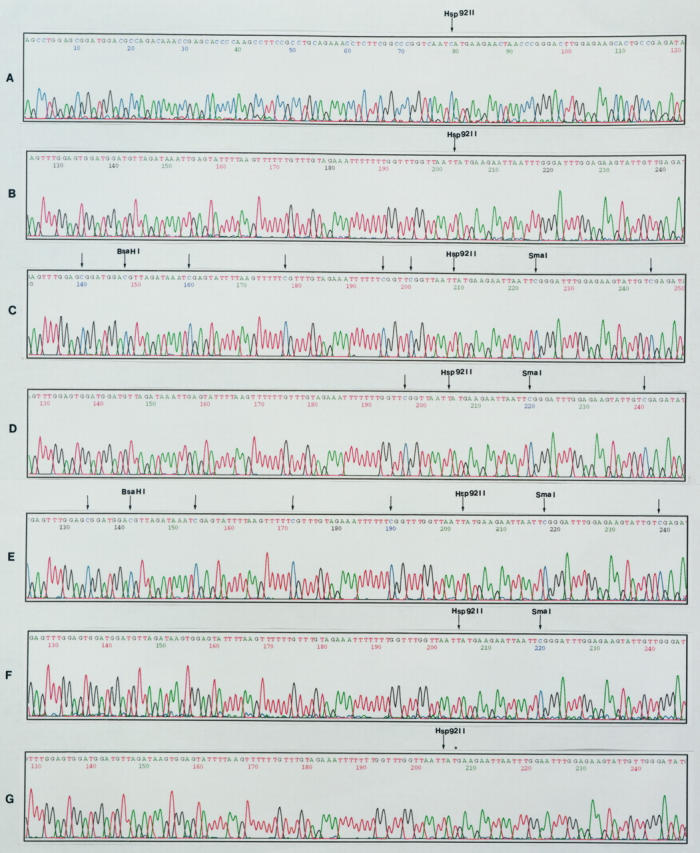
Alignment of automated DNA sequencing traces corresponding to bases 34 to 153 (sense strand) of the p27 gene. The location of unreactive (methylated) cytosines in bisulfite-modified DNA from NP and pituitary tumor cell lines are shown by the arrows. NP and AtT20 cells show complete bisulfite C to T conversion in this region. Eight methylated (unreactive) cytosines in GH3 control cells and seven methylated cytosines in GHRH-CL1 control cells were detected in this region. The number of methylated cytosines decreased to three and one in AZAdC-treated GH3 and GHRH-CL1 cells, respectively. Bisulfite conversion of the Hsp 92II restriction site is indicated. A: The sequence of p27 gene in GH3 cells without bisulfite reaction; B: NP; C: GH3 cells without AZAdC treatment; D: AZAdC-treated GH3 cells; E: GHRH-CL1 cells without AZAdC treatment; F: AZAdC-treated GHRH-CL1 cells; G: AtT20 cells.
To further confirm the correlation between the absence of p27 gene expression and increased methylation of the p27 gene in GH3 and GHRH-CL1 cells, we treated GH3 and GHRH-CL1 cells with AZAdC. Partial demethylation of DNA was observed after treatment with 10 μmol/L AZAdC for 7 days. As shown in Figure 4 ▶ , the methylation pattern of the p27 gene in treated GH3 and GHRH-CL1 cells was different from that of the untreated GH3 and GHRH-CL1 cells. AZAdC treatment had decreased numbers of methylated cytosines in different plasmid clones as measured by bisulfite genomic sequencing in exon 1 of p27 gene ranging from 60 to 90%.
A 98% sequence similarity in p27 gene between mouse and rat allowed the use of same primers (sense primer 1 was identical, and antisense primer 2 had one mismatch between rat and mouse) for the bisulfite analysis. However, because there was only 88% sequence homology between rat and human, we modified the primers to match the human sequence for HP75 human cell analyses. The mouse GHRH-CL1 cell line showed similar changes in methylation as the rat GH3 cell line. A total of 28 methylated cytosines were found in exon 1 of the p27 gene in both GH3 and GHRH-CL1 cells. One methylated cytosine located at 104 in GH3 cells shifted to 382 in GHRH-CL1 cells. There were decreased methylation and increased p27 protein expression after AZAdC treatment. In contrast, the mouse AtT20 cell line, which expressed abundant p27 protein with approximately 60% of cells stained with anti-p27 antibody without AZAdC treatment, contained only one methylated cytosine at position 410 in exon 1 (Figure 5) ▶ . Human HP75 cells showed a similar methylation pattern with AtT20 cells. One methylated cytosine was found in HP75 cells with variable location in the different plasmid clones, but it disappeared after AZAdC treatment (data not shown).
Figure 5.

Diagrammatic summary of bisulfite genomic DNA sequencing showing the differences in methylation patterns in exon 1 of the p27 gene between NP, GH3, GHRH-CL1, and AtT20 cells. •, methylated cytosines; ○, unmethylated cytosines.
PCR-based methylation analyses with NP and GH3 cells confirmed the bisulfite sequencing data (Figure 6) ▶ . The results from SmaI, HhaI, and AvaI cleavage supported the conclusion that p27 methylation patterns of exon 1 of the p27 gene between NP and GH3 cells were very different (Figure 5) ▶ .
Figure 6.

PCR-based methylation analyses showing the relationship between enzyme digestion and PCR amplification. A total of 500 ng of each DNA sample was digested with methylation-sensitive enzymes, including HhaI, AvaI, and SmaI. DNA completely digested with PstI and with the methylation-insensitive HindIII, which does not cleave the p27 gene and uncut DNA, served as controls. DNAs were amplified with the primer sets indicated by the arrows in Figure 1 ▶ . Top: NP; Bottom: GH3. Lanes 1 to 6, 436-bp product generated with primers 3 and 5; lanes 7 to 12, 238-bp PCR product generated with primers 4 and 5; lanes 1 and 7, uncut; lanes 2 and 8, HindIII; lanes 3 and 9, PstI; lanes 4 and 10, SmaI; lanes 5 and 11; AvaI; lanes 6 and 12, HhaI.
Enhanced DNA-MTase mRNA Expression and Enzyme Activity in GH3 and GHRH-CL1 Cells
There was an increase in the mRNA expression of DNA-MTase in GH3 and GHRH-CL1 cells compared with NP and AtT20 cells detected by semiquantitative RT-PCR (Figure 7) ▶ . DNA-MTase activity was elevated approximately fourfold in GH3 and twofold in GHRH-CL1 cells compared with NP and AtT20 cells. DNA-MTase activity decreased significantly after GH3 and GHRH-CL1 cells were treated with 10 μmol/L AZAdC for 7 days (Figure 8) ▶ . DNA-MTase mRNA expression and activity correlated with DNA methylation of the p27 gene in NP and pituitary tumor cells.
Figure 7.

DNA-MTase mRNA level in NP and various pituitary tumor cell lines determined by RT-PCR. DNA-MTase and GAPDH were co-amplified in the same reaction. Top: PCR fragment of GAPDH (495 bp). Bottom: PCR fragment of DNA-MTase (220 bp). Lane 1, NP; lane 2, GH3 control cells; lane 3 , GHRH-CL1 control; lane 4, AtT20 cells.
Figure 8.

DNA-MTase activity in NP and various pituitary tumor cell lines. GH3 and GHRH-CL1 cells have a higher DNA-MTase activity compared with NP and AtT20 cells. aP < 0.01 compared with all other groups; bP < 0.05 compared with NP and AtT20.
Discussion
The present study indicates that increased methylation may be an important mechanism of inactivation of p27 in GH3 and GHRH-CL1 cells. Treatment of GH3 and GHRH-CL1 cells with AZAdC led to a striking increase in the expression of p27 protein and mRNA in these cells. To elucidate the mechanism regulating the loss of expression of p27 protein in GH3 and GHRH-CL1 cells, we analyzed the methylation pattern of the p27 gene.
The methylation pattern of the p27 gene was analyzed by bisulfite genomic sequencing and by the cleavage of genomic DNA with methylation-sensitive enzymes, including SmaI, HhaI, and AvaI. Bisulfite genomic sequencing showed that the normally unmethylated CpG in exon 1 in NP was extensively methylated in GH3 cells. All SmaI, HhaI, and AvaI enzyme sites of the p27 gene at exon 1 were methylated in GH3 cells but not in NP. The results obtained with both techniques were similar.
Because exon 2 (120 bp) of the p27 gene contains the methylation-sensitive restriction sites located at the 3′ end, it was difficult to design primers to amplify this region. The present study was focused on exon 1 (475 bp) of the p27 gene. Genomic sequencing of bisulfite-treated DNA has several advantages. 1) It is easy to evaluate because it gives a positive display of the position of the methylated cytosine in a DNA sequence, which is distinct from the absence of all unmethylated cytosines. 2) Unlike methods depending on restriction enzyme specificity, it enables the methylation status of all cytosines in a target DNA sample to be determined irrespective of nearest neighbor compositions, which is critical in studying the potential silencing of genes involved in development and imprinting and in cancer. 3) The PCR products can be cloned and sequenced to provide methylation maps of single DNA molecules. 4) It allows the identification of hemi-methylated sites not normally detected with restriction enzymes. 26 High levels of both p27 protein and mRNA expressions in NP were detected by immunoblotting and RT-PCR in this study and in our previous report. 1 In the present study, GH3 and GHRH-CL1 cells had undetectable p27 protein, although these cells had very low levels of p27 mRNA as detected by RT-PCR. 1
The possible role of p27 as a tumor suppressor gene has been analyzed by various investigators. 1-4,10,11,29 Analysis of over 500 tumors to date has shown only a few mutations, including point mutations in 2 of 36 primary breast carcinomas. 5-9 When an astrocytoma cell line was transfected with p27 there was decreased malignant behavior, supporting the concept that loss of p27 expression may be associated with tumor progression. 30 There is aberrant expression of p27 protein in neoplasms with a marked decrease of p27 during progression from normal to benign and malignant tumors. 5-8,29 p27 protein has been shown to be degraded by the ubiquitin-proteasome pathway, and the degradation is increased in some tumor tissues. 8,11 Although ubiquitination is a principal post-translational regulatory path for p27 protein, our study shows that DNA methylation can also regulate p27 expression in rodent pituitary cells. We have also observed that ubiquitination is one of the regulatory mechanism for p27 expression in the immortalized HP75 human pituitary cell line (unpublished observation). This cell line was also used in the current study and showed a low level of methylation of the p27 gene.
Cancer cells often show altered patterns of DNA methylation. This change may contribute to genomic instability. 31 In some tumors, the normally unmethylated CpG islands in the promoter region of critical genes can become highly methylated, and the associated transcriptional silencing becomes an epigenetic alternative to coding region mutations in causing loss of tumor suppressor gene function. 12-19
The methylation patterns are generated by DNA-MTase, although the actual mechanism involved is still unclear. One of the characterized DNA-MTases in mammalian cells has a pronounced sequence selectivity for the methylation of cytosine in hemi-methylated CG sequences.. 12-14 DNA-MTase activity is generally severalfold higher in various transformed cells compared with normal cultured murine and human cells. 20,21 Our study has shown that DNA-MTase mRNA levels and enzyme activity are much higher in GH3 and GHRH-CL1 cells than in NP and AtT20 cells. Because AZAdC is a cytidine analog and causes a powerful inhibition of DNA-MTase, GH3 and GHRH-CL1 cells treated with AZAdC had increased expressed p27 and had decreased DNA-MTase activity. The present study suggests that the level of increased DNA-MTase activity could involve increased methylation of regional or specific genes. Changes in DNA methylation may be accompanied by changes in tumor cell phenotype and induction of differentiation in vitro, 12-14,22,32 which was observed in the GH3 cells,;ie, these cells had increased PRL expression and decreased proliferation after AZAdC treatment.
Treatment of GH3 and GHRH-CL1 cells with AZAdC for 7 days in vitro decreased the number of methylated cytosines and induced expression of both p27 protein and mRNA. Variable methylation patterns of the p27 gene were detected in AZAdC-treated GH3 and GHRH-CL1 cells, because these cells were heterogeneous with respect to DNA methylation after treatment. DNA methylation correlated inversely with the expression of the p27 gene in NP, GH3, and GHRH-CL1 cells.
The mouse GHRH-CL1 cell line, which produces PRL and GH, was very similar to the rat GH3 cell line, which also produces PRL and GH, with respect to p27 expression and methylation of exon 1 of the p27 gene. However, the AtT20 mouse pituitary cell line, which produces adrenocorticotrophic hormone (ACTH), had abundant p27 protein and few methylated cytosines in exon 1. These observations substantiate our findings about the inverse relationship of p27 expression and DNA methylation and suggest that the methylation regulatory mechanisms in these cell lines may be related to the specific phenotype of the pituitary cell line.
In the p27 knockout models, the ACTH cells from the intermediate lobe developed ACTH cell hyperplasia, suggesting a greater regulatory role of p27 on ACTH cells. 2-4 Additional studies are needed to analyze the relationship of pituitary cell phenotype and p27 gene methylation.
In summary, this is the first demonstration that the p27 gene in some rodent pituitary cell lines, including GH3 and GHRH-CL1, have increased methylation that results in p27 gene silencing. These results offer a molecular explanation for p27 aberrant gene inactivation in some pituitary tumors and possibly in other types of neoplasms.
Footnotes
Address reprint requests to Dr. R. Lloyd, Department of Laboratory Medicine and Pathology, 200 First Street, SW, Rochester, MN 55905. E-mail: lloyd.ricardo@mayo.edu.
Supported in part by NIH grants CA 37231 and CA 42951.
References
- 1.Qian X, Jin L, Grande JP, Lloyd RV: Transforming growth factor-β and p27 expression in pituitary cells. Endocrinology 1996, 137:3051-3060 [DOI] [PubMed] [Google Scholar]
- 2.Fero ML, Rivkin M, Tasch M, Porter P, Carow CE, Firpo E, Polyak K, Tsai LH, Broudy V, Perlmutter RM, Kaushansky K, Roberts JM: A syndrome of multiorgan hyperplasia with features of gigantism, tumorigenesis, and female sterility in p27Kip1 deficient mice. Cell 1996, 85:733-744 [DOI] [PubMed] [Google Scholar]
- 3.Kiyokawa H, Kineman RD, Manova-Todorova KO, Soares VC, Hoffman ES, Ono M, Khanam D, Hayday AC, Frohman LA, Koff A: Enhanced growth of mice lacking the cyclin-dependent kinase inhibitor function of p27 Kip1. Cell 1996, 85:721-732 [DOI] [PubMed] [Google Scholar]
- 4.Nakayama K, Ishida N, Shirane M, Inomata A, Inoue T, Shishido N, Horii I, Loh DY, Nakayama K: Mice lacking p27 kip1 display increased body size, multiple organ hyperplasia, retinal dysplasia, and pituitary tumors. Cell 1996, 85:707-720 [DOI] [PubMed] [Google Scholar]
- 5.Ponce-Castaneda MV, Lee MH, Latres E, Polyak K, Lacombe L, Montgomery K, Mathew S, Krauter K, Sheinfeld J, Massague J: p27kip1: chromosomal mapping to 12p12–12p13.1 and absence of mutations in human tumors. Cancer Res 1995, 55:1211-1214 [PubMed] [Google Scholar]
- 6.Stegmaier K, Takeuchi S, Golub TR, Bohlander SK, Bartram CR, Koeffler HP: Mutational analysis of the candidate tumor suppressor genes TEL and KIP1 in childhood acute lymphoblastic leukemia. Cancer Res 1996, 56:1413-1417 [PubMed] [Google Scholar]
- 7.Esposito V, Baldi A, De Luca A, Groger AM, Loda M, Giordano GG, Caputi M, Baldi F, Pagano M, Giordano A: Prognostic role of the cyclin-dependent kinase inhibitor p27 in non-small cell lung cancer. Cancer Res 1997, 57:3381-3385 [PubMed] [Google Scholar]
- 8.Loda M, Cukor B, Tam SW, Lavin P, Fiorentino M, Draetta GF, Jessup JM, Pagano M: Increased proteasome-dependent degradation of the cyclin-dependent kinase inhibitor p27 in aggressive colorectal carcinomas. Nature Med 1997, 3:231-234 [DOI] [PubMed] [Google Scholar]
- 9.Tan P, Cady B, Wanner M, Worland P, Cukor B, Magi-Galluzzi C, Lavin P, Draetta G, Pagano M, Loda M: The cell cycle inhibitor p27 is an independent prognostic marker in small (T1a,b) invasive breast carcinomas. Cancer Res 1997, 57:1259-1263 [PubMed] [Google Scholar]
- 10.Alessandrini A, Chiaur DS, Pagano M: Regulation of the cyclin-dependent kinase inhibitor p27 by degradation and phosphorylation. Leukemia 1997, 11:342-345 [DOI] [PubMed] [Google Scholar]
- 11.Pagano M, Tam SW, Theodoras AM, Beer-Romero P, Del- Sal G, Chau V, Yew PR, Draetta GF, Rolfe M: Role of the ubiquitin- proteasome pathway in regulating abundance of the cyclin-dependent kinase inhibitor p27. Science 1995, 269:682-685 [DOI] [PubMed] [Google Scholar]
- 12.Baylin SB: Tying it all together: epigenetics, genetics, cell cycle, and cancer. Science 1997, 277:1948-1949 [DOI] [PubMed] [Google Scholar]
- 13.Laird PW: Oncogenic mechanisms mediated by DNA methylation. Mol Med Today 1997, 3:223-229 [DOI] [PubMed] [Google Scholar]
- 14.Counts JL, Goodman JI: Alterations in DNA methylation may play a variety of roles in carcinogenesis. Cell 1995, 83:13-15 [DOI] [PubMed] [Google Scholar]
- 15.Woloschak M, Yu A, Post KD: Frequent inactivation of the p16 gene in human pituitary tumors by gene methylation. Mol Carcinog 1997, 19:221-224 [DOI] [PubMed] [Google Scholar]
- 16.Ohtani-Fujita N, Dryja TP, Rapaport JM, Fujita T, Matsumura S, Ozasa K, Watanabe Y, Hayashi K, Maeda K, Kinoshita S, Matsumura T, Ohnishi Y, Hotta Y, Takahashi R, Kato MV, Ishizaki K, Sasaki MS, Horsthemke B, Minoda K, Sakai T: Hypermethylation in the retinoblastoma gene is associated with unilateral, sporadic retinoblastoma. Cancer Genet Cytogenet 1997, 98:43-49 [DOI] [PubMed] [Google Scholar]
- 17.Herman JG, Jen J, Merlo A, Baylin SB: Hypermethylation-associated inactivation indicates a tumor suppressor role for p15INK4B. Cancer Res 1996, 56:722-727 [PubMed] [Google Scholar]
- 18.Wong DJ, Barrett MT, Stoger R, Emond MJ, Reid BJ: p16INK4a promoter is hypermethylated at a high frequency in esophageal adenocarcinomas. Cancer Res 1997, 57:2619-2622 [PubMed] [Google Scholar]
- 19.Lo KW, Cheung ST, Leung SF, Van Hasselt A, Tsang YS, Mak KF, Chung YF, Woo JK, Lee JC, Huang DP: Hypermethylation of the p16 gene in nasopharyngeal carcinoma. Cancer Res 1996, 56:2721-2725 [PubMed] [Google Scholar]
- 20.Issa JP, Vertino PM, Wu J, Sazawal S, Celano P, Nelkin BD, Hamilton SR, Baylin SB: Increased cytosine DNA-methyltransferase activity during colon cancer progression. J Natl Cancer Inst 1993, 85:1235-1240 [DOI] [PubMed] [Google Scholar]
- 21.Baylin SB, Herman JG, Graff JR, Vertino PM, Issa JP: Alterations in DNA methylation: a fundamental aspect of neoplasia. Adv Cancer Res 1998, 72:141-196 [PubMed] [Google Scholar]
- 22.Kulig E, Landefeld TD, Lloyd RV: The effects of estrogen on prolactin gene methylation in normal and neoplastic rat pituitary tissues. Am J Pathol 1992, 140:207-214 [PMC free article] [PubMed] [Google Scholar]
- 23.Qian X, Jin L, Kulig E, Lloyd RV: Expression of D-type cyclins in normal and neoplastic rat pituitary. Endocrinology 1998, 139:2058-2067 [DOI] [PubMed] [Google Scholar]
- 24.Ohsawa K, Imai Y, Ito D, Kohsaka S: Molecular cloning and characterization of annexin V-binding proteins with highly hydrophilic peptide structure. J Neurochem 1996, 67:89-97 [DOI] [PubMed] [Google Scholar]
- 25.Jin L, Kulig E, Qian X, Scheithauer BW, Eberhardt NL, Lloyd RV: A human pituitary adenoma cell line proliferates and maintains some differentiated functions following expression of SV40 large T-antigene. Endocr Pathol 1998, 9:169-186 [Google Scholar]
- 26.Grigg GW: Sequencing 5-methylcytosine residues by the bisulphite method. DNA Sequence 1996, 6:189-198 [DOI] [PubMed] [Google Scholar]
- 27.Xiong Z, Laird PW: COBRA: a sensitive and quantitative DNA methylation assay. Nucleic Acids Res 1997, 25:2532-2534 [DOI] [PMC free article] [PubMed] [Google Scholar]
- 28.Adams RL, Rinaldi A, Seivwright C: Microassay for DNA methyltransferase. J Biochem Biophys Methods 1991, 22:19-22 [DOI] [PubMed] [Google Scholar]
- 29.Lloyd RV, Jin L, Qian X, Kulig E: Aberrant p27Kip1 expression in endocrine and other tumors. Am J Pathol 1997, 150:401-407 [PMC free article] [PubMed] [Google Scholar]
- 30.Chen J, Willingham T, Shuford M, Nisen PD: Tumor suppression and inhibition of aneuploid cell accumulation in human brain tumor cells by ectopic overexpression of the cyclin-dependent kinase inhibitor p27Kip1. J Clin Invest 1996, 97:1983-1988 [DOI] [PMC free article] [PubMed] [Google Scholar]
- 31.Ahuja N, Mohan AL, Li Q, Stolker JM, Herman JG, Hamilton SR, Baylin SB, Issa JP: Association between CpG island methylation and microsatellite instability in colorectal cancer. Cancer Res 1997, 57:3370-3374 [PubMed] [Google Scholar]
- 32.Taylor SM: 5-Aza-2′-deoxycytidine, cell differentiation, and DNA methylation. Leukemia 1993, 7:3-8 [PubMed] [Google Scholar]