

Abstract
Hepatic stellate cells (HSC), a pericyte-like nonparenchymal liver cell population, are regarded as the principal matrix-synthesizing cells of fibrotic liver. They might also play a role during liver inflammation. The present study analyzed (i) expression of cell adhesion molecules (CAMs) mediating cell infiltration, like intercellular adhesion molecule-1 (I-CAM-1) and vascular cell adhesion molecule-1 (V-CAM-1), by HSC, (ii) CAM regulation in HSC by growth factors and inflammatory cytokines, and (iii) CAM expression in situ during liver inflammation, using immunochemistry and Northern blot analysis. I-CAM-1 and V-CAM-1 expression was present in HSC in vitro and in cells located in the sinusoidal/perisinusoidal area of normal liver. Growth factors, eg, transforming growth factor-β1, down-regulated I-CAM-1- and V-CAM-1-coding mRNAs and stimulated N-CAM expression of HSC. In contrast, inflammatory cytokines like tumor necrosis factor-α reduced N-CAM-coding mRNAs, whereas induction of I-CAM-1- and V-CAM-1-specific transcripts increased severalfold. In situ, messengers specific for I-CAM-1 and V-CAM-1 were induced 3 hours after CCl4 treatment (thereby preceding mononuclear cell infiltration starting at 12 hours), were expressed at maximal levels 9–12 hours after CCl4 application, and decreased afterwards. I-CAM-1 and V-CAM-1 immunoreactivity increased in a linear fashion starting 3 hours after CCl4-induced liver injury, was detected in highest amounts at 24–48 hours characterized by maximal cell infiltration, and returned to baseline values at 96 hours. Interestingly, the induction/repression of CAM-specific messengers paralleled the time kinetics of tumor necrosis factor-α/transforming growth factor-β1 expression in injured liver. HSC might be important during the onset of hepatic tissue injury as proinflammatory elements and might interact with I-CAM-1 and V-CAM-1 ligand-bearing cells, namely lymphocyte function-associated antigen-1- or Mac-1/very late activation antigen-4-positive inflammatory cells, thereby modulating the recruitment and migration of mononuclear cells within the perisinusoidal space of diseased livers.
Hepatic tissue repair reactions in response to liver injury are characterized by infiltration of the parenchyma by inflammatory cells, principally lymphocytes, granulocytes, and monocytes/macrophages. Infiltration is a multistep process comprising the so-called rolling followed by sticking of blood cells to the endothelial layer and transmigration through the hepatic endothelial lining into the tissue. 1-3 The recruitment of specific leukocyte populations is mediated by chemokines and by the interaction of adhesion molecules on inflammatory cells and on endothelial cells on the other side. 1-3 Recently some of the basic mechanisms responsible for the transmigration of leukocytes through the hepatic endothelial lining have been elucidated; however, the further migration and resulting accumulation of inflammatory cells in areas of liver damage are poorly characterized. 4,5
Hepatic stellate cells (HSC), also designated as Ito cells, fat storing cells, or lipocytes, play a major role in vitamin A metabolism and are presently regarded as the principal cell type responsible for matrix accumulation during liver repair reactions including fibrosis. 6-8 HSC are situated in the space of Disse between the sinusoidal endothelium and hepatocytes and exhibit long cytoplasmic processes that underlie the endothelium and embrace the sinusoid but also have contact with hepatocytes. Because HSC reflect the cell population immediately contacting transmigrated leukocytes on one side and hepatocytes on the other side, they could play a role in the recruitment of inflammatory cells into the liver parenchyma and subsequently in their targeting to damaged hepatocytes.
To address this question, the present study analyzed HSC with respect to the expression of cell adhesion molecules and their regulation by mediators involved in hepatic tissue repair reactions. Among cell adhesion molecules (CAMs) the report concentrates on intercellular cell adhesion molecule-1 (I-CAM-1) and vascular cell adhesion molecule-1 (V-CAM-1), because the I-CAM/ lymphocyte function associated antigen (LFA)-1 and V-CAM/very late activation antigen (VLA)-4 adhesion pathways have been described as fundamental for leukocyte recruitment at sites of inflammation. 1-3,9,10 In addition, the regulation of neural cell adhesion molecule (N-CAM, also termed CD56) was analyzed because N-CAM, known to be expressed by HSC following activation, might be involved in the migration of CD56-positive lymphocytes or HSC and in the termination of HSC proliferation induced by tissue injury. 11,12
Basic features of the response of HSC to hepatic tissue injury are phenotypical and functional changes, a process called activation. 6-8 Activation includes HSC proliferation, transforming star-shaped cells rich in vitamin A to vitamin A-deficient cells of myofibroblast-like appearance (activated HSC) displaying contractile properties. Furthermore, activation is characterized by differential gene expression of connective tissue components, matrix-degrading enzymes, and their inhibitors, resulting in matrix accumulation colocalized with activated HSC. Interestingly, this in vivo activation process strongly resembles the morphological and functional changes observed in HSC during primary culture. Therefore HSC in vitro are commonly used as a model to study the role of these cells during hepatic tissue repair, which additionally offers the unique opportunity to study the functional role of these cells at different activation steps reflecting different phases of tissue injury. Because the potential involvement of HSC in leukocyte recruitment might be affected by their differentiation stage, the expression and regulation of CAMs was studied in HSC in vitro at different steps of activation.
To clarify whether the data obtained from former in vitro studies are relevant to in vivo conditions, expression of I-CAM-1 and V-CAM-1 was analyzed in the carbon tetrachloride (CCl4) in vivo model for acute liver damage accompanied by hepatic inflammation. Using this model, the time kinetics and tissue distribution of CAM expression, the infiltration of mononuclear cells, and the expression of cytokines, identified by the in vitro studies as strong inducers or repressors of CAM in HSC, were analyzed.
Materials and Methods
Animals
Wistar rats were provided by Charles River (Sulzfeld, Germany) and received humane care in compliance with the institution’s guidelines and National Institutes of Health guidelines.
cDNA Probes
To detect transcripts specific for CAM, polymerase chain reaction (PCR) generated cDNAs directed against rat N-CAM, 12 rat I-CAM-1, which mapped to positions 529–782 of the published sequence, 13 and against rat V-CAM-1, corresponding to positions 352–741 of the published sequence, 14 were used.
Transforming growth factor (TGF)-β1-specific messengers were detected using a PCR-generated cDNA directed against rat TGF-β, which mapped to positions 763-1063 of the published sequence. 15 Furthermore, a PCR-generated cDNA directed against rat tumor necrosis factor (TNF)-α, which mapped to positions 140–509 of the published sequence, 16 was used.
In addition, clone pFH154 coding for human fibronectin 17 and a cDNA probe specific for human albumin 18 were used. To validate quantitative Northern blot results a clone carrying the rat glycerylaldehyde-3-phosphod dehydropenase (GAPDH) cDNA 19 or human β-actin 20 were used. Specificity of PCR products mentioned above was confirmed by digestion using appropriate restriction enzymes and by sequencing of cloned PCR products. PCR products were cloned using the TA cloning kit (Invitrogen, San Diego, CA) and sequenced using the Sequenase version 2.0 kit (United States Biochemical, Cleveland, OH). Sequence comparison was performed by Fasta or BestFit alignment programs of the genetics computer group package (Genetics Computer Group, Madison, WI) using standard parameters. 21
Antibodies
Monoclonal antibodies directed against rat I-CAM-1 were obtained from Genzyme (Cambridge, MA) and monoclonal antibodies directed against human V-CAM-1 (clone 51–10C9) from Pharmingen (San Diego, CA). A monoclonal anti N-CAM antibody (clone NCAM-OB11) was obtained from Sigma (Munich, Germany). The mAb against desmin, the antiserum directed against mouse IgGs, and the APAAP complex were from Dako (Copenhagen, Denmark). The mAbs directed against the ED1 and ED2 epitopes were from Biermann (Wiesbaden, Germany). The mAbs against smooth muscle alpha action (SMA) and antibodies directed against glial fibrillary acidic protein were from Sigma. The mAb against vimentin was from Boehringer (Mannheim, Germany)
Mediators
Cytokines were from the following sources and were tested at the concentrations provided below unless otherwise stated in the legends: TGF-β1, human, natural, 1 ng/ml (Sigma); insulin-like growth factor-1 (IGF-1), human, natural, 100 nMol (kindly provided by Dr. Märki, Ciba Geigy, Basel, Switzerland); platelet-derived growth factor (PDGF) (Sigma), human, natural, 10 ng/ml; epidermal growth factor (EGF), human, recombinant, 2.5 ng/ml (Sigma); hepatocyte growth factor (HGF), human, recombinant, 10 ng/ml (Sigma); TNF-α, human, recombinant, 100 U/ml (Genzyme); interferon-γ (IFN), rat, recombinant, 100 U/ml (Genzyme).
Isolation and Cultivation of HSC and Other Liver Cells
HSC were isolated from rat liver and kept in primary culture as described previously. 12,22-26 As assessed by morphology and by the expression of SMA, GFAP, and N-CAM, HSC were considered fully activated at 7 days of primary culture and later, whereas cells cultured for 2 days were classified as resting HSC or HSC at an early stage of activation and cells cultured for 4 days were judged as transitional cells. 12,23,27 Purity of freshly isolated cells and cultured cells was assessed as stated earlier. 12,22-26
To verify that the CAM expression levels detected in HSC were not derived from other liver cells, hepatocytes, Kupffer cells, and sinusoidal endothelial cells were isolated from rat liver and cultivated as described previously. 12,22,24,25,27-29
Cytokine Treatment of HSC
HSC cultured for 2, 4, or 7 days were incubated for 20 hours in 1 ml serum reduced (0.3% fetal calf serum) culture medium with or without (controls) the mediators, which were used at the concentrations stated under “mediators.” Furthermore, the effects of increasing concentrations of TNF-α (1 U/ml, 10 U/ml, 100 U/ml and 1000 U/ml), TGF-β1 (0.1 ng/ml up to 10.0 ng/ml), or IGF-1 (1 nMol up to 100 nMol) were tested. At the end of the cytokine exposure, cells were processed for RNA extraction and Northern blot analysis as stated below. Experiments analyzing the regulation of CAM expression by mediators at the standard concentrations and 20-hour incubation periods testing HSC cultured for 2, 4, or 7 days were performed at least twice using at least two different HSC isolations.
Induction of Acute Liver Damage
Rats were given carbon tetrachloride (CCl4)/maize oil solution (50%, v/v) orally as described earlier. 12,27,28 Control animals were given maize oil only.
Immunohistochemistry and Immunocytochemistry
Cryostat sections (5 μm) of normal or acutely damaged liver specimens and cells were fixed in methanol/acetone (5 minutes/10 seconds at −20°C) as described earlier. 12,27-29 Cells or tissue sections were examined by the alkaline phosphatase anti-alkaline phosphatase (APAAP) staining procedure. Cells or tissue sections were incubated with specific primary antibodies for 1 hour at 37°C and were then covered for 1 hour at 37°C with an antiserum directed against mouse IgG followed by incubation with the APAAP complex. Nonspecific staining was controlled for by incubation with mouse Ig instead of the specific primary antibody. To compare the tissue distribution patterns of I-CAM-1, V-CAM-1, N-CAM, vimentin, desmin, GFAP, SMA, and ED1, serially cut tissue sections were prepared and analyzed.
RNA Extraction and Northern Blot Analysis
Cells were lysed with guanidinum isothiocyanate and total RNA was extracted as reported. 12,23,26 For Northern blot analysis of the basal CAM expression levels, RNA prepared from four different cell preparations was pooled to overcome individual differences. The RNA (5 μg total) was resolved by agarose gel electrophoresis, transferred to nylon membranes, and hybridized with specific 32P-labeled cDNA probes. Hybridization was performed for 2 hours at 68°C using the QuickHyb Kit (Stratagene, La Jolla, CA). Posthybridization washes were performed 2 times for 15 minutes at room temperature and 1 time for 5–15 minutes at 60°C in 2× SSC containing 0.1% sodium dodecyl sulfate. Nylon filters were washed, dried, and exposed to x-ray films at −80°C.
Results
Expression of Cell Adhesion Molecules by HSC in Vitro
Using cDNAs generated by RT-PCR, I-CAM-1, V-CAM-1, and (as shown previously 12 ) N-CAM, coding transcripts were detected in HSC in vitro (Figure 1A) ▶ . As reported for rat I-CAM-1 30 and human or mouse V-CAM-1, 31,32 single I-CAM-1- and V-CAM-1-specific messengers of 3.0 kb and 3.2 kb in size were present in HSC from rat liver, respectively. Hybridization of filters containing RNA samples derived from hepatocytes, Kupffer cells, and sinusoidal endothelial cells of rat liver both directly after isolation and at different stages of primary culture indicated that the CAM expression of HSC was not derived from contaminating cells (data not shown).
Figure 1.

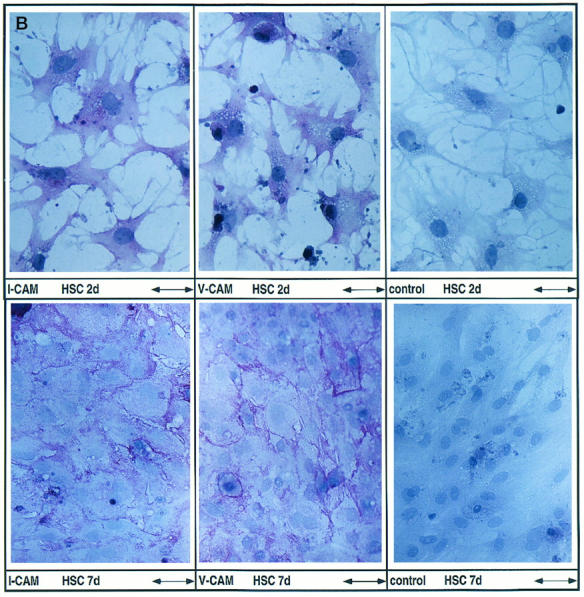
Expression of cell adhesion molecules by HSC in vitro. A: Expression of I-CAM-1, V-CAM-1, and N-CAM as assessed by Northern blot analysis. Total RNA was purified from HSC at these time points: freshly isolated (0), day 2 or 3 (2/3), day 4 or 5 (4/5), day 7 (7), and day 9 or 10 (9/10) after plating. RNA (1.25 μg total) recovered from four different HSC isolations was pooled and size selected by 1% agarose gel electrophoresis followed by hybridization using specific cDNA probes. B: Detection of I-CAM-1 and V-CAM-1 by the APAAP staining method. HSC at days 2 (HSC 2d) and 7 (HSC 7d) after plating were incubated with antibodies directed against CAMs or mouse immunoglobulins as negative controls. Immunoreactive material was detected using the APAAP staining method. Scale bars, 66 mm (HSC 2d) and 100 μm (HSC 7d).
I-CAM-1 and V-CAM-1 expression was noted both in freshly isolated HSC and throughout HSC primary culture representing HSC at different activation stages, namely resting HSC/HSC at an early stage of activation (2–3 days after plating), transitional cells (4–5 days after plating), and fully activated cells (>7 days after plating) (Figure 1A) ▶ . In contrast, in the same set of experiments N-CAM was expressed following in vitro activation of HSC as demonstrated earlier 12 (Figure 1A) ▶ .
Using antibodies directed against rat I-CAM-1 and human V-CAM-1, a specific immunoreactivity was noted in HSC (Figure 1B) ▶ . Already at day 2 of primary culture a weak I-CAM-1- and V-CAM-1-specific staining reaction, distributed in the cytoplasm with some pronouncement toward the cell surface membrane, was detected in HSC. At day 7 the CAM-specific staining reaction was localized predominantly at the cell surface, particularly in areas of cell-cell contact, and resembled the staining pattern detected in the case of N-CAM. 12 Due to the species specificity of the antibodies used, V-CAM-1-specific staining reactions were generally weaker compared to I-CAM-1 and might underestimate the amount of V-CAM-1 actually present in HSC but also within liver tissue (Figure 2) ▶ . The latter suggestion is supported by the observation that the immunodetection of I-CAM-1 testing cells or liver tissue was considerably stronger using an antibody directed against rat I-CAM-1 compared to an antibody directed against human I-CAM-1 used in the initial experiments.
Figure 2.

Distribution of I-CAM-1- and V-CAM-1-positive cells in normal rat livers. Serial cut sections of normal rat livers were incubated with antibodies directed against desmin, GFAP, I-CAM-1, V-CAM-1, ED1, and ED2 or with mouse immunoglobulins used as negative controls (data not shown). Immunoreactive material was detected using the APAAP staining method. Scale bar, 62 μm. Note the portal vein (P), hepatic artery (A), and bile duct (B) present within each section. Arrows indicate V-CAM-1-positive material.
Expression of Cell Adhesion Molecules in Normal Liver
To study whether HSC in situ also express I-CAM-1 ad V-CAM-1, serially cut tissue sections were examined by the APAAP staining method (Figure 2) ▶ . In normal liver I-CAM-1- and V-CAM-1-specific staining reactions were detected in the sinusoidal/perisinusoidal area of the hepatic parenchyma. In an attempt to assign the CAM immunoreactivity more precisely, livers were examined for the presence of desmin, GFAP, SMA, N-CAM, ED1, and ED2. Desmin and GFAP are known to be present in resting HSC corresponding to HSC localized in normal liver, 27 whereas SMA and N-CAM become detectable only in activated HSC present in diseased livers. 12 In addition, desmin and SMA are known to be expressed in myofibroblasts of the blood vessels in the portal field, 12,27 whereas N-CAM is localized to neural structures. 12 The sinusoidal/perisinusoidal I-CAM-1 and V-CAM-1 staining reactions showed some colocalization with desmin/GFAP-positive HSC. However, from these colocalization studies an I-CAM-1/V-CAM-1 positivity of other sinusoidal liver cells, like sinusoidal endothelial cells or ED2-positive Kupffer cells, cannot be excluded.
Regulation of CAM Expression in HSC by Growth Factors
To study the modulation of CAM expression, HSC at different steps of activation were exposed to growth factors (TGF-β1, IGF-1, PDGF, EGF, and HGF), because the latter cytokines have been shown to be essential during tissue repair reactions of the liver and other organs and are known to modulate CAM expression in a variety of cell culture models. 33-38 In general, growth factors (prototype TGF-β1) down-regulated I-CAM-1, and V-CAM-1 mRNA steady-state levels and stimulated N-CAM expression (Figure 3) ▶ .
Figure 3.

Regulation of I-CAM-1, V-CAM-1, and N-CAM expression by growth factors at different stages of HSC primary culture. HSC cultured for 2 days (2d), 4 days (4d), and 7 days (7d) were incubated without (Con) or with TGF-β1, IGF-1, PDGF, or EGF for 20 hours. RNA (5 μg total) was size selected by 1% agarose gel electrophoresis and filters were then hybridized using a cDNA probe specific for I-CAM-1, V-CAM-1, N-CAM, or GAPDH. In the middle panel (HSC 4d) the line between EGF and IGF indicates that IGF and the control of the last lane belong to each other. The control of all other samples is loaded in the first lane.
As reported, 12 N-CAM expression was low at the early phase of primary culture (2 days after plating, representing resting HSC or HSC at an early stage of activation) and was induced during in vitro activation. N-CAM steady-state mRNA levels were induced severalfold by growth factors like TGF-β1, IGF-1, PDGF, and EGF in HSC at days 2 and 4. In HSC 7 days after plating, characterized by high N-CAM expression levels, the latter growth factors were without significant effects, except for a slight N-CAM up-regulation by IGF-1 (Figure 3) ▶ . HGF also stimulated N-CAM expression but this effect was present mainly in activated HSC and was lower compared to the other growth factors (data not shown).
I-CAM-1 specific mRNAs were diminished following exposure of HSC at days 2 and 4 after plating to TGF-β1, IGF-1, EGF, and PDGF. In fully activated HSC (7 days after plating) only IGF-1 caused an I-CAM-1 down-regulation, whereas most of the other growth factors displayed no significant effects on I-CAM-1 expression. Interestingly, the regulation of I-CAM-1 expression by PDGF and HGF was dependent on the HSC activation status. PDGF diminished I-CAM-1 expression in HSC at 2 days after plating, was without major effect in HSC at 4 days of primary culture, and stimulated I-CAM-1 steady state levels in fully activated HSC. On the other hand, HGF resulted in significant down-regulation of I-CAM-1 expression only in fully activated cells, whereas in HSC at days 2 and 4 after plating I-CAM-1 mRNA steady-state levels were not affected by HGF exposure (data not shown).
The regulation of V-CAM-1 expression by growth factors resembled the pattern described for I-CAM-1; however, a major difference was noted in the case of IGF-1. Although most of the growth factors (TGF, PDGF, EGF, and HGF) reduced V-CAM-1 expression levels, IGF-1 induced V-CAM-1-coding mRNAs in HSC at all differentiation stages. With the majority of mediators, down-regulation of V-CAM-1 was most prominent in transitional cells (HSC 4 days after cultivation). In HSC 2 days after plating this effect was detectable only in the case of EGF, and in fully activated cells following incubation with PDGF and EGF.
Regulation of CAM Expression in HSC by TNF-α and IFN-γ
Among the inflammatory cytokines TNF-α appeared to be the most potent modulator of CAM expression and displayed a CAM regulation pattern almost completely opposite that of the growth factors analyzed (Figure 4) ▶ . TNF-α reduced N-CAM steady-state levels while I-CAM-1- and V-CAM-1-specific transcripts were induced severalfold. TNF-α-mediated effects were present throughout HSC primary culture. However, due to a low N-CAM expression level in HSC 2 days after plating, the reduction of N-CAM coding transcripts by TNF-α was not apparent at this stage of primary culture (Figure 4) ▶ . In general, IFN-γ treatment resulted in CAM induction/deinduction kinetics similar to TNF-α. In contrast to TNF-α, IFN-γ stimulated mostly V-CAM-1 expression but stimulated I-CAM-1-specific messengers only in minor amounts and preferentially in more advanced stages of HSC activation (Figure 4) ▶ .
Figure 4.

Regulation of I-CAM-1, V-CAM-1, and N-CAM expression by TNF-α and interferon-γ at different stages of HSC primary culture. HSC cultured for 2 days (2d), 4 days (4d), and 7 days (7d) were incubated without (Con) or with TNF-α (TNF) or interferon-γ (IFN) for 20 hours. RNA (5 μg total) was size selected by 1% agarose gel electrophoresis and filters were then hybridized using a cDNA probe specific for I-CAM-1, V-CAM-1, N-CAM, or GAPDH. In the middle panel (HSC 4d) the line between the samples assigns the controls to the corresponding cytokine-treated cells.
Dose- and Time-dependent Regulation of CAM Expression by TGF-β1, TNF-α, and IGF-1
Based on the foregoing experiments, TGF-β1, TNF-α, and IGF-1 were identified as potent modulators of CAM expression in HSC at different stages of activation. Because the primary aim of the present study was to clarify whether HSC are involved in the recruitment of inflammatory cells in the initial phase of liver damage, resting HSC and HSC at an early stage of activation were analyzed with respect to the dose dependency of the latter mediators (Figure 5) ▶ . TNF-α stimulated I-CAM-1 and V-CAM-1 expression at concentrations of 1 U/ml and maximal induction was noted at doses of 100 U/ml (Figure 5) ▶ . Low concentrations (0.01 ng/ml) of TGF-β1 were also able to diminish I-CAM-1 and V-CAM-1 mRNA steady-state levels, which were reduced most efficiently by TGF-β1 at doses between 1 ng/ml and 10 ng/ml (Figure 5) ▶ . Furthermore, IGF-1 exhibited its effects in a dose-dependent manner. A reduction of I-CAM-1 steady state mRNA levels was noted at a concentration of 1 nMol, being maximal at 100 nMol, whereas V-CAM-1 induction became evident at 10 nMol and showed extensive induction at 10–100 nMol concentrations (Figure 5) ▶ . Control hybridizations using fibronectin-specific cDNAs confirmed previous data in that TGF-β1 and TNF-α induced fibronectin-specific messengers (Figure 5) ▶ . 23,26 However, compared to the CAM modulation, expression of fibronectin-coding mRNAs was stimulated by the latter cytokines, generally at higher concentrations starting at 10 U/ml TNF-α and 0.1 ng/ml TGF-β1. IGF-1 was ineffective in stimulating fibronectin expression, whereas in the same set of experiments an induction of HGF-specific mRNAs was present as reported previously 39 (data not shown).
Figure 5.

Dose-dependent regulation of CAM expression by TNF-α, TGF-β1, and IGF-1. HSC cultured for 2 days were incubated without cytokines (Con) and with increasing concentrations of TNF-α (1U/ml, 10 U/ml, 100 U/ml, 1000 U/ml), TGF-β1 (0.01 ng/ml, 0.1 ng/ml, 1 ng/ml, 10 ng/ml), or IGF-1 (1 nMol up to 100 nMol). RNA (5 μg total) was size selected by 1% agarose gel electrophoresis and filters were then hybridized using specific cDNA probes.
The time dependency of the mediators’ effect on CAM expression was also studied. As shown in Figures 3–5 ▶ ▶ ▶ , mediators were active within a 20-hour incubation period. As evidenced in single experiments (data not shown), growth factors like TGF-β1 and inflammatory cytokines like TNF-α and IFN-γ were efficient within 8-hour incubation periods to modulate CAM expression in the cytokine-specific manner mentioned above. After 8 hours’ incubation TNF-α and IFN-γ stimulated I-CAM-1 and V-CAM-1 expression, which was diminished by growth factors. The same was true in the case of N-CAM, which was induced by TGF-β1 and diminished by TNF-α 8 hours after exposure to the mediators.
Expression of Cell Adhesion Molecules in Acutely Injured Livers
From the data presented so far it became evident that HSC in vitro and presumably in vivo express I-CAM-1 and V-CAM-1 and that inflammatory cytokines (prototype TNF-α) induced I-CAM-1 and V-CAM-1 expression, whereas growth factors (prototype TGF-β1) diminished their steady-state mRNA levels. To gain insights into the potential in vivo relevance of these findings, the time kinetics and tissue distribution of CAM expression were analyzed by Northern blotting (Figure 6A) ▶ and immunohistochemistry (Figure 6, B and C) ▶ during liver inflammation induced by a single application of CCl4. In parallel, the steady-state mRNA levels of the important mediators, namely TGF-β1 and TNF-α, were characterized in this experimental liver injury model.
Figure 6.

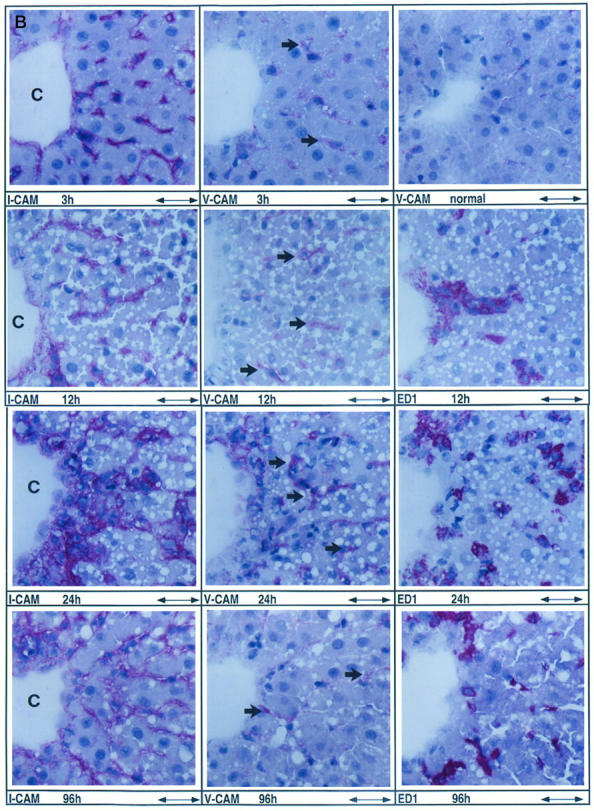

Induction of I-CAM-1 and V-CAM-1 during acute liver injury. A: Up-regulation of I-CAM-1- and V-CAM-1-specific transcripts in the early phase of liver injury preceding recruitment of inflammatory cells. Northern blot analysis of 5 μg pooled total RNA purified from two control livers (C) and two acutely damaged livers analyzed 3, 6, 9, 12, 24, 48, 72, and 96 hours after a single CCl4 application. RNA was size selected by 1% agarose gel electrophoresis and filters were hybridized using specific cDNA probes. B: Cellular localization of I-CAM-1-, V-CAM-1-, and ED1-positive cells during the course of acute liver injury. Rats were given a single dose of CCl4 and livers were analyzed at 3, 12, 24, and 96 hours after CCl4 application representing the immediate hepatic repair reaction (3 hours), the onset of cellular infiltration (12 hours), further cellular infiltration (24 hours), and the recovery phase (96 hours). Serial sections were incubated with antibodies directed against I-CAM-1, V-CAM-1, or ED1. Mouse immunoglobulins used as negative controls gave a negative staining reaction (data not shown). Immunoreactive material was detected using the APAAP staining method. In all cases the tissue area located around central veins (C) is demonstrated. To show more precisely the increase of V-CAM-1 immunoreactivity observed 3 hours after CCl4-induced liver injury, V-CAM-1 immunostainings of normal liver performed in the same set of experiments are also shown. Scale bar, 62 μm. Arrows indicate V-CAM-1-positive material. C: Cellular localization of desmin-, GFAP-, I-CAM-1-, V-CAM-1-, ED1-, and ED2-positive cells at the peak of cellular infiltration 48 hours after acute liver injury. Rats were given a single dose of CCl4 and livers were analyzed 48 hours after CCl4 application. Serial sections were incubated with antibodies directed against desmin, GFAP, I-CAM-1, V-CAM-1, ED1, and ED2. Mouse immunoglobulins used as negative controls gave a negative staining reaction (data not shown). The center of tissue necrosis located around central veins (C) and the interface between the inflammatory infiltrate and the surrounding tissue is shown. Scale bar, 62 μm. Arrows indicate V-CAM-1-positive material.
The CCl4 model of acute liver damage results in massive hepatocellular necrosis primarily within the pericentral area of the liver acinus. Hepatocellular necrosis is associated with an expansion of the mononuclear cell population present in the liver, which results from proliferation of local macrophages (Kupffer cells) and infiltration with mononuclear phagocytes. 40 Liver tissue injury, necrosis of pericentral hepatocytes, and mononuclear cell infiltration are maximal at 24–48 hours after CCl4 treatment, followed by a recovery phase due to hepatic regeneration that results in almost complete restitution of the liver function. 27,29
By Northern blot analysis (Figure 6A) ▶ V-CAM-1 and I-CAM-1, which were present in amounts close to the detection limit in normal livers, were severalfold induced in the early phase of the response. Both CAMs were up-regulated 3 hours after CCl4-induced liver injury, reached maximal mRNA steady state levels at 9–12 hours, and progressively diminished afterwards, returning to baseline levels about 72 hours after CCl4 application. Interestingly, the induction/repression of CAM-specific messengers paralleled the time kinetics of TNF-α/TGF-β1 expression in injured liver. TNF-α-specific messengers 1.6 kb in size 41 were also induced at 3 hours post-CCl4 application, showed highest levels at 9–12 hours, and were down-regulated later on, exactly matching the CAM induction kinetics. In contrast, hepatic expression of TGF-β1-specific transcripts 2.5 kb in size, which have been shown to repress CAM expression in HSC in vitro, became elevated at 9 hours and increased to highest quantities at 24–72 hours, matching the CAM repression profile. In control hybridizations albumin-specific mRNAs decreased in a time-dependent manner to lowest levels at 24–48 hours after CCl4 administration, following the course of necrosis. Due to hepatic regeneration, albumin expression increased with the onset of the recovery phase at 72 hours and reached baseline levels of normal livers at 96 hours (data not shown).
By immunohistochemistry V-CAM-1 and I-CAM-1 staining of the sinusoidal/perisinusoidal area was increased 3 hours after CCl4 administration compared to normal livers (Figure 6B) ▶ . I-CAM-1 and V-CAM-1 immunoreactive material increased in a linear fashion thereafter, reaching maximal levels at 24 hours (V-CAM-1) and 48 hours (I-CAM-1) (Figure 6B, 6C) ▶ . V-CAM-1- and I-CAM-1-positive cells were localized mainly in the necrotic area (Figure 6B, 6C) ▶ . In livers at 96 hours I-CAM-1 and V-CAM-1 staining was present in amounts near the baseline level of normal livers, a dramatic reduction in comparison to livers at 48 hours (Figure 6B) ▶ .
CAM expression in injured livers was studied in parallel with marker proteins, namely vimentin, desmin, GFAP, smooth muscle α-actin, ED1, and ED2, reacting with all mesenchymal, fibroblastic, and mononuclear cell populations. Compared to normal livers the number of vimentin-positive cells reflecting all mesenchymal cell populations involved in tissue repair were increased at 12 hours, followed by a dramatic incline to 48 hours and a decline to 96 hours (data not shown). ED1- and ED2-positive cells corresponding to inflammatory cells and local macrophages (Kupffer cells), respectively, showed the same kinetics; a significant increase in their numbers was noted at 12 hours after CCl4 application followed by a further expansion, reaching maximal levels at 48 hours (Figure 6C) ▶ . However, eg, at 24 and 48 hours, ED1-positive cells representing inflammatory cells were localized mainly within the necrotic area, whereas ED2-positive cells reflecting Kupffer cells were distributed primarily around tissue necrosis (Figure 6C) ▶ . Desmin- and GFAP-positive cells also displayed the time kinetics reported for vimentin-positive cells and were present at 48 hours in higher amounts in the necrotic area than in the surrounding tissue (Figure 6C) ▶ . As reported previously, N-CAM-positive cells also became detectable in injured livers. However, the absolute numbers were severalfold lower compared to I-CAM-1- and V-CAM-1-positive cells and N-CAM-positive cells were seen only in minor amounts, mostly within the necrotic area and occasionally in the surrounding tissue at 24 hours after CCl4 application (data not shown). SMA-positive cells were detected solely in the vessel walls from 3–12 hours and again at 96 hours. At 24 hours and especially at 48 hours, SMA-positive cells were also found in the necrotic area in numbers severalfold lower than desmin- and GFAP-positive cells (data not shown). At 96 hours, the numbers of mononuclear cells (Figure 6B) ▶ and desmin- and GFAP-positive cells (data not shown) were severalfold diminished, but still slightly above the baseline level of normal livers.
Discussion
Presently HSC are regarded as the principal cell type involved in the extracellular matrix metabolism of the liver, because this cell population synthesizes a wide range of matrix proteins like collagens, structural glycoproteins, and proteoglycans as well as proteases and their inhibitors, specifying matrix degradation. 6-8,42 However, due to their production of chemokines like macrophage inflammatory protein-2, 43 platelet-activating factor, 44 macrophage colony-stimulating factor, 45 and monocyte chemotactic protein-1, 46 a proinflammatory role for HSC has been suggested. 6 The latter hypothesis is in line with an emerging concept in that fibroblasts in general play an important role in initiating inflammation by synthesizing chemokines. 47 Chemokines, a family of small polypeptides, are potent mediators initiating the recruitment of leukocytes to sites of injury, in particular the initial sticking of inflammatory blood cells to the endothelial wall and transendothelial migration.
In addition to chemokines, several adhesion molecules act in concert to facilitate migration of leukocytes from the blood to extravascular sites of inflammation. Presently adhesion molecules are grouped into four major families: integrins, the immunoglobulin superfamily members including I-CAM and V-CAM, selectins, and selectin ligands like muzin. 48,49 In contrast to chemokines, CAMs are somehow active at later stages of the inflammatory reaction and mediate direct interaction of infiltrating mononuclear cells with resident cells.
As in other organs it has been demonstrated in the liver that CAM expression by sinusoidal endothelial cells is essential for the transmigration of inflammatory cells and that CAMs present on hepatocytes might be important for the interaction of inflammatory cells with their target cells. 29,50-59 Although the mechanisms involved in the transmigration of blood cells through the sinusoidal endothelial lining have been elucidated, the migration of leukocytes within the hepatic tissue that results in accumulation of inflammatory cells in areas of liver damage is poorly characterized. Because HSC reflect the cell population immediately contacting transmigrated leukocytes on one side and hepatocytes on the other side, HSC could play a role in the recruitment of inflammatory cells into the liver parenchyma and subsequently in their targeting to damaged hepatocytes. Therefore the present study analyzed the expression and regulation of CAMs by HSC, in particular the expression of I-CAM-1 and V-CAM-1, known to be essential for the inflammatory reaction.
The data presented in this report illustrate that HSC in vitro expressed I-CAM-1, V-CAM-1, and N-CAM, as evidenced by immunocytochemistry and Northern blot analysis. In the case of N-CAM and I-CAM-1 the results confirmed and extended previous studies; 12,60 however, as demonstrated in the case of V-CAM, novel CAMs present on HSC were also identified. It seems of special interest that HSC produce V-CAM-1, which has been detected in the liver only in endothelial cells, Kupffer cells, and bile duct epithelia, especially following lipopolysaccharide-induced liver injury or graft rejection. 51,52,61
CAM expression by HSC was studied at various time points of primary culture reflecting different activation stages of HSC. Using the latter approach the data demonstrate that HSC in both the resting and activated states express I-CAM-1 and V-CAM-1, whereas, in accordance with previous studies, 12 N-CAM expression became detectable after in vitro activation.
The observation that freshly isolated and early cultured HSC classified as resting cells express significant amounts of I-CAM-1-specific transcripts contradicts a recent study by Hellerbrand and coworkers 60 demonstrating that I-CAM-1 mRNAs were expressed in activated (day 15 of culture) but not in resting (freshly isolated) HSC as assessed by Northern blot analysis. However, additional time points of primary culture were not analyzed and I-CAM-1 coding transcripts were present in low amounts in freshly isolated HSC using RT-PCR techniques in the Hellerbrand et al report, thereby providing possible explanations for the different observations.
On the other hand one might argue that the I-CAM-1 and V-CAM-1 expression by resting HSC (freshly isolated and 2–3 days after plating) described in this report might be caused by contaminating cells. The latter possibility was examined by Northern blot analysis of other resident liver cell populations, namely hepatocytes, Kupffer cells, and sinusoidal endothelial cells, both directly after isolation and at various stages of primary culture. Results indicated that the I-CAM-1 and V-CAM-1 expression ascribed to HSC was not due to contaminating cells. In addition, further evidence for I-CAM-1 and V-CAM-1 production by HSC was provided by the detection of I-CAM-1 and V-CAM-1 protein in HSC using immunocytochemistry.
To examine whether HSC in situ express CAMs, I-CAM-1 and V-CAM-1 were localized in normal rat liver by immunohistochemistry, illustrating that V-CAM-1 was present in the sinusoidal/perisinusoidal area. Because these CAMs colocalized only in part with desmin- and GFAP-positive HSC and because the more extended in vitro analysis also indicated that Kupffer cells and sinusoidal endothelial cells expressed I-CAM-1 and V-CAM-1, it seems reasonable to conclude that several nonparenchymal liver cell populations including HSC express I-CAM-1 and V-CAM-1 in normal liver, confirming previous data on I-CAM-1 expression in situ. 29,51,61,62
Cell adhesion molecules are basic to tissue inflammation responses and their expression is known to be regulated by a wide range of cytokines involved in tissue repair. To gain further insights into the potential role of HSC in hepatic inflammation via CAMs the effect of mediators known to play an essential role in liver tissue repair, namely classical inflammatory cytokines and various growth factors, on CAM expression by HSC was studied. Interestingly, inflammatory cytokines (prototype TNF-α) induced I-CAM-1 and V-CAM-1 expression, whereas N-CAM steady-state levels were reduced. In contrast, growth factors (prototype TGF-β1) generally caused a completely opposite pattern, diminishing I-CAM-1 and V-CAM-1 mRNA levels but inducing N-CAM expression.
Although reports of the induction of I-CAM-1 expression by TNF-α 60 and of N-CAM by TGF-β in HSC 12 have been published recently, the present study provides a more detailed analysis of the cytokine-regulated CAM expression in liver cells and demonstrates that HSC must be regarded as an essential element in hepatic inflammation. In addition, the in vitro studies suggest different roles for the various mediators during tissue repair (Figure 7) ▶ . Inflammatory cytokines might be responsible for the initial phase of inflammation via I-CAM-1 and V-CAM-1 up-regulation, whereas growth factors like TGF-β1 might terminate cell recruitment through down-regulation of l-CAM-1 and V-CAM-1 (Figure 7) ▶ . This hypothesis was further supported by the time kinetics of expression of CAM, TNF-α, and TGF-β during hepatic inflammation in situ, illustrating that the induction and repression of CAM-specific messengers paralleled the time kinetics of TNF-α and TGF-β1 expression in injured liver.
Figure 7.

Potential role of HSC in the recruitment of mononuclear cells during liver inflammation, as described in Discussion section.
Initially N-CAM (also known as CD56) was included in the studies presented in this paper because it might be involved in the migration of CD56-positive lymphocytes. Because CD56-positive cells were detected only in low amounts and N-CAM expression was reduced by inflammatory cytokines but enhanced by growth factors, N-CAM might be of minor importance in the recruitment of inflammatory cells. However, N-CAM might play a role during the recovery phase as a factor terminating HSC proliferation, thereby promoting the reconstitution of normal hepatic architecture characterized by a decline in the expanded HSC population. As N-CAM expression was stimulated by growth factors known to represent the major mitogens for HSC, like IGF, PDGF, and EGF, 63-65 the latter pathway might provide a loop by which HSC proliferation is automatically terminated.
As demonstrated in a number of experimental settings 29,50,53,59,66,67 and during human liver diseases including, eg, viral infections, acute liver allograft rejection, alcoholic hepatitis, and others, 54-56,58,61,68-70 I-CAM-1 and V-CAM-1 are up-regulated in the course of hepatic injury, as evidenced by immunohistochemistry and Northern blot analysis of injured tissue or determination of soluble CAMs in the blood. Although numerous studies have been published, especially on I-CAM-1, detailed analyses of the localization of CAMs in injured livers and their time kinetics from onset through recovery are rare.
The data presented in this paper indicate that both I-CAM-1 and V-CAM-1 were strongly up-regulated in areas of tissue necrosis, that this up-regulation preceded the infiltration of mononuclear cells, and that I-CAM-1 and V-CAM-1 were diminished during the recovery phase in parallel with a reduction of cellular infiltration. These results provide further support for the assumption that both I-CAM-1 and V-CAM-1 are essential components of leukocyte recruitment into the inflamed liver. Moreover, the present study provides experimental evidence that TNF-α and TGF-β seem to be involved in hepatic inflammation via regulation of CAMs, because in situ the induction/deinduction kinetics of CAM expression paralleled those of the mediators and in vitro both cytokines regulated CAM expression in a cytokine-specific manner.
The role of TNF-α as a key cytokine involved in hepatic tissue repair, particularly liver inflammation, has been documented extensively. Acute and chronic liver diseases in humans and in animal models are accompanied by increased TNF-α expression both in the liver and in peripheral mononuclear cells. 58,67,71-73 In the diseased liver TNF-α is expressed by Kupffer cells, mononuclear cells, or T lymphocytes present within inflammatory cell infiltrate and intrahepatic bile duct epithelium 74,75 and also by hepatocytes during hepatitis B and C virus infection. 76 The stimulatory effect of TNF-α on CAM expression by liver cells analyzed in vitro is well documented 52,57,60 but only a few reports actually demonstrate that TNF-α is related to enhanced CAM expression during liver injury in situ. 58,59,67,77 In contrast to the latter publications, the present report demonstrates the distinct time kinetics characterizing the TNF-α and CAM induction/deinduction, thereby presenting an important insight into the specific mechanisms of liver inflammation.
In contrast to TNF-α, the biological significance of TGF-β1 in the regulation of CAM expression during liver inflammation has not been a major research topic. Although it has been demonstrated that TGF-β1 is transiently enhanced at later stages of acute liver injury (ie, at approximately 48 hours after CCl4 administration in the rat), thereby matching the data presented in this study, 73,78 a direct relationship to CAM expression and subsequently the regulation of cell infiltration has not yet been suggested. From the data presented in this paper, namely the TGF-β1-mediated down-regulation of CAM expression by HSC and the expression kinetics of TGF-β1 and CAMs in situ, it is tempting to speculate that TGF-β1, probably in combination with other growth factors, is responsible for termination of the inflamma-tory reaction through a reduction of CAM expression (Figure 7) ▶ .
In summary, based on the data presented in this paper it seems reasonable to suggest that the initial phase of liver inflammation might be triggered through mediators liberated from injured hepatocytes, which, as shown in the case of IGF-1, stimulate V-CAM-1 expression by HSC (Figure 7) ▶ . In the next step activated resident liver macrophages (Kupffer cells) and inflammatory cells might augment I-CAM-1 and V-CAM-1 expression by HSC through secretion of TNF-α and IFN-γ, thereby leading to further recruitment of inflammatory cells. Liver inflammation might be terminated via the action of growth factors like PDGF, TGF-β1, and EGF derived from different cellular sources, which are capable of diminishing I-CAM-1 and V-CAM-1 expression by HSC (Figure 7) ▶ . Although these regulatory loops must be studied in more detail, the present report provides at least novel insights into the mechanisms underlying hepatic inflammation and particularly into the role of HSC as proinflammatory elements.
Acknowledgments
We thank Mrs. Anka Grundmann for excellent technical assistance.
Footnotes
Address reprint requests to Giuliano Ramadori, M.D., Department of Internal Medicine, Section of Gastroenterology and Endocrinology, University of Göttingen, Robert Koch Strasse 40, 37075 Göttingen, Germany. E-mail: gramado@med.uni-goettingen.de.
Supported by the Department of Internal Medicine, Section of Gastroenterology and Endocrinology, University of Göttingen and by the Deutsche Forschungsgemeinschaft Sonderforschungsbereich 402, “Molekulare und Zelluläre Hepatogastroenterologie.”
References
- 1.Imhof BA, Dunon D: Leukocyte migration and adhesion. Adv Immunol 1995, 58:345-416 [DOI] [PubMed] [Google Scholar]
- 2.Ley K: Molecular mechanisms of leukocyte recruitment in the inflammatory process. Cardiovasc Res 1996, 32:733-742 [PubMed] [Google Scholar]
- 3.Butcher E, Picker L: Lymphocyte homing and homeostasis. Science 1996, 272:60-66 [DOI] [PubMed] [Google Scholar]
- 4.Jaeschke H: Cellular adhesion molecules: regulation and functional significance in the pathogenesis of liver diseases. Am J Physiol 1997, 273:G602-G611 [DOI] [PubMed] [Google Scholar]
- 5.Stamatoglou SC, Hughes RC: Cell adhesion molecules in liver function and pattern formation. FASEB J 1994, 8:420-427 [DOI] [PubMed] [Google Scholar]
- 6.Pinzani M: Novel insights into the biology and physiology of the Ito cell. Pharmacol Ther 1995, 66:387-412 [DOI] [PubMed] [Google Scholar]
- 7.Hautekeete ML, Geerts A: The hepatic stellate (Ito) cell: its role in human liver disease. Virchows Arch 1997, 430:195-207 [DOI] [PubMed] [Google Scholar]
- 8.Friedman SL: Hepatic stellate cells. Prog Liver Dis 1996, 14:101-130 [PubMed] [Google Scholar]
- 9.Postigo A, Teixido J, Sanchez-Madrid F: The α4β1/VCAM-1 adhesion pathway in physiology and disease. Res Immunol 1993, 144:723-735 [DOI] [PubMed] [Google Scholar]
- 10.Patarroyo M, Makgoba M: Leucocyte adhesion to cell in immune and inflammatory responses. Lancet 1989, II:1139-1142 [DOI] [PubMed] [Google Scholar]
- 11.Palucka AK, Porwit A, Reizenstein P: A supportive role of neural cell adhesion molecule (NCAM) in adhesion between leukaemic blasts and cytotoxic lymphocytes. Scand J Immunol 1992, 35:399-406 [DOI] [PubMed] [Google Scholar]
- 12.Knittel T, Aurisch S, Neubauer K, Eichhorst S, Ramadori G: Cell type specific expression of neural cell adhesion molecule (N-CAM) in Ito cells of rat liver: up-regulation during in vitro activation and in hepatic tissue repair. Am J Pathol 1996, 149:449-462 [PMC free article] [PubMed] [Google Scholar]
- 13.Kita Y, Takashi T, Iigo Y, Tamatani T, Miyasaka M, Horiuchi T: Sequence and expression of rat ICAM-1. Biochim Biophys Acta 1992, 1131:108-110 [DOI] [PubMed] [Google Scholar]
- 14.Williams AJ, Atkins RC, Fries JW, Gimbrone MA, Cybulsky MI, Collins T: Nucleotide sequence of rat vascular cell adhesion molecule-1 cDNA. Biochim Biophys Acta 1992, 1131:214-216 [DOI] [PubMed] [Google Scholar]
- 15.Qian SW, Kondaiah P, Roberts AB, Sporn MB: cDNA cloning by PCR of rat transforming growth factor-β1. Nucleic Acids Res 1990, 18:3059-3059 [DOI] [PMC free article] [PubMed] [Google Scholar]
- 16.Estler HC, Grewe M, Gaussling R, Pavlovic M, Decker K: Rat tumor necrosis factor-α: transcription in rat Kupffer cells and in vitro posttranslational processing based on a PCR-derived cDNA. Biol Chem 1992, 373:271-281 [DOI] [PubMed] [Google Scholar]
- 17.Kornblihtt A, Vibe Pedersen K, Baralle F: Human fibronectin: molecular cloning evidence for two mRNA species differing by an internal segment coding for a structural domain. EMBO J 1984, 3:221-226 [DOI] [PMC free article] [PubMed] [Google Scholar]
- 18.Kurnit DM, Philipp BW, Bruns GAP: Confirmation of the mapping assignment of human serum albumin to chromosome 4 using a cloned human albumin gene. Cytogenet Cell Genet 1982, 34:282-288 [DOI] [PubMed] [Google Scholar]
- 19.Fort P, Marty L, Piechaczyk M, Sabrouty SE, Dani C, Jeanteur P, Blanchard JM: Various adult tissues express only one major mRNA species from the glyceraldehyde-3-phosphate-dehydrogenase multigenic family. Nucleic Acids Res 1985, 13:1431-1442 [DOI] [PMC free article] [PubMed] [Google Scholar]
- 20.Ponte P, Gunning P, Blau H, Kedes L: Human actin genes are single copy for α-skeletal and α-cardiac actin but multicopy for β- and γ-cytoskeletal genes: 3′ untranslated regions are isotype specific but are conserved in evolution. Mol Cell Biol 1983, 3:1783-1791 [DOI] [PMC free article] [PubMed] [Google Scholar]
- 21.Devereux J, Haeberli P, Smithies O: A comprehensive set of sequence analysis programs for the VAX. Nucleic Acids Res 1984, 12:387-395 [DOI] [PMC free article] [PubMed] [Google Scholar]
- 22.Knittel T, Fellmer P, Ramadori G: Gene expression and regulation of plasminogen activator inhibitor type I in hepatic stellate cells of rat liver. Gastroenterology 1996, 111:745-754 [DOI] [PubMed] [Google Scholar]
- 23.Knittel T, Janneck T, Müller L, Fellmer P, Ramadori G: Transforming growth factor-β1 regulated gene expression of Ito cells. Hepatology 1996, 24:352-360 [DOI] [PubMed] [Google Scholar]
- 24.Knittel T, Fellmer P, Müller L, Ramadori G: Bone morphogenetic protein-6 is expressed in non parenchymal liver cells and upregulated by transforming growth factor-β1. Exp Cell Res 1997, 232:263-269 [DOI] [PubMed] [Google Scholar]
- 25.Knittel T, Fellmer P, Neubauer K, Kawakami M, Grundmann A, Ramadori G: The complement activating protease P100 is expressed by hepatocytes and is induced by IL-6 in vitro und during the acute phase reaction in vivo. Lab Invest 1997, 77:221-230 [PubMed] [Google Scholar]
- 26.Knittel T, Müller L, Saile B, Ramadori G: Effect of tumor necrosis factor-α on proliferation, activation and protein synthesis of rat hepatic stellate cells. J Hepatol 1997, 27:1067-1080 [DOI] [PubMed] [Google Scholar]
- 27.Neubauer K, Knittel T, Aurisch S, Fellmer P, Ramadori G: Glial fibrillary acidic protein: a cell type specific marker protein for Ito cells in vivo and in vitro. J Hepatol 1996, 24:719-730 [DOI] [PubMed] [Google Scholar]
- 28.Knittel T, Armbrust T, Neubauer K, Ramadori G: Expression of von Willebrand factor in normal and diseased rat livers and in cultivated liver cells. Hepatology 1995, 21:470-476 [PubMed] [Google Scholar]
- 29.Neubauer K, Eichorst S, Wilfling T, Buchenau M, Xia L, Ramadori G: Sinusoidal intercellular adhesion molecule-1 up-regulation precedes the accumulation of leukocyte function antigen-1-positive cells and tissue necrosis in a model of carbontetrachloride-induced acute rat liver injury. Lab Invest 1998, 78:185-194 [PubMed] [Google Scholar]
- 30.Ban K, Ikeda U, Takahashi M, Kanbe T, Kasahara T, Shimada K: Expression of intercellular adhesion molecule-1 on rat cardiac myocytes by monocyte chemoattractant protein-1. Cardiovasc Res 1994, 28:1258-1262 [DOI] [PubMed] [Google Scholar]
- 31.Rosenman S, Shrikant P, Dubb L, Benveniste E, Ransohoff R: Cytokine-induced expression of vascular cell adhesion molecule-1 (VCAM-1) by astrocytes and astrocytoma cell lines. J Immunol 1995, 154:1888-1899 [PubMed] [Google Scholar]
- 32.Fries JW, Williams AJ, Atkins RC, Newman W, Lipscomb MF, Collins T: Expression ov V-CAM-1 and E-selectin in an in vivo model of endothelial activation. Am J Pathol 1993, 143:725-737 [PMC free article] [PubMed] [Google Scholar]
- 33.Gressner AM: Mediators of hepatic fibrogenesis. Hepato-Gastroenterol 1996, 43:92-103 [PubMed] [Google Scholar]
- 34.Fausto N, Laird AD, Webber EM: Liver regeneration. 2. Role of growth factors and cytokines in hepatic regeneration. FASEB J 1995, 9:1527-1536 [DOI] [PubMed] [Google Scholar]
- 35.Knittel T, Ramadori G: Molecular biology. Curr Opin Gastroenterol 1995, 11:258-266 [Google Scholar]
- 36.Matsuda Y, Matsumoto K, Yamada A, Ichida T, Asakura H, Komoriya Y, Nishiyama E, Nakamura T: Preventive and therapeutic effects in rats of hepatocyte growth factor infusion on liver fibrosis/cirrhosis. Hepatology 1997, 26:81-89 [DOI] [PubMed] [Google Scholar]
- 37.Napoli J, Prentice D, Niinami C, Bishop G, Desmond P, McCaughan G: Sequential increases in the intrahepatic expression of epidermal growth factor, basic fibroblast growth factor, and transforming growth factor β in a bile duct ligated rat model of cirrhosis. Hepatology 1997, 26:624-633 [DOI] [PubMed] [Google Scholar]
- 38.Ross R, Chew S, D’Souza LL, Yateman M, Rodriguez-Arnao J, Gimson A, Holly J, Camacho-Hubner C: Expression of IGF-I and IGF-binding protein genes in cirrhotic liver. J Endocrinol 1996, 149:209-216 [DOI] [PubMed] [Google Scholar]
- 39.Skrtic S, Wallenius V, Ekberg S, Brenzel A, Gressner A, Jansson J: Insulin-like growth factors stimulate expression of hepatocyte growthfactor but not transforming growth factor β1 in cultured hepatic stellate cells. Endocrinology 1997, 138:4683-4689 [DOI] [PubMed] [Google Scholar]
- 40.Geerts A, Schellinck P, Bouwens L, Wisse E: Cell population kinetics of Kupffer cells during the onset of fibrosis in rat liver by chronic carbon tetrachloride administration. J Hepatol 1988, 6:50-56 [DOI] [PubMed] [Google Scholar]
- 41.Xing Z, Jordana M, Kirpalani H, Driscoll K, Schall T, Gauldie J: Cytokine expression by neutrophils and macrophages in vivo: endotoxin induces tumor necrosis factor-α, macrophage inflammatory protein-2, interleukin-1 β, and interleukin-6 but not RANTES or transforming growth factor-β 1 mRNA expression in acute lung inflammation. Am J Respir Cell Mol Biol 1994, 10:148-153 [DOI] [PubMed] [Google Scholar]
- 42.Iredale JP: Matrix turnover in fibrogenesis. Hepatogastroenterology 1996, 43:56-71 [PubMed] [Google Scholar]
- 43.Sprenger H, Kaufmann A, Garn H, Lahme B, Gemsa D, Gressner AM: Induction of neutrophil-attracting chemokines in transforming rat hepatic stellate cells. Gastroenterology 1997, 113:277-85 [DOI] [PubMed] [Google Scholar]
- 44.Pinzani M, Carloni V, Marra F, Riccardi D, Laffi G, Gentilini P: Biosynthesis of platelet-activating factor and its 1O-acyl analogue by liver fat-storing cells. Gastroenterology 1994, 106:1301-1311 [DOI] [PubMed] [Google Scholar]
- 45.Pinzani M, Abboud HE, Gesualdo L, Abboud SL: Regulation of macrophage colony-stimulating factor in liver fat-storing cells by peptide growth factors. Am J Physiol 1992, 262:C876-C881 [DOI] [PubMed] [Google Scholar]
- 46.Marra F, Valente AJ, Pinzani M, Abboud HE: Cultured human liver fat-storing cells produce monocyte chemotactic protein-1: regulation by proinflammatory cytokines. J Clin Invest 1993, 92:1674-1680 [DOI] [PMC free article] [PubMed] [Google Scholar]
- 47.Smith RS, Smith TJ, Blieden TM, Phipps RP: Fibroblasts as sentinel cells: synthesis of chemokines and regulation of inflammation. Am J Pathol 1997, 151:317-322 [PMC free article] [PubMed] [Google Scholar]
- 48.Cunningham B: Cell adhesion molecules as morphoregulators. Curr Opin Cell Biol 1995, 7:628-633 [DOI] [PubMed] [Google Scholar]
- 49.Gahmberg CG: Leucocyte adhesion: CD11/CD18 integrins and intercellular adhesion molecules. Curr Opin Cell Biol 1997, 9:643-650 [DOI] [PubMed] [Google Scholar]
- 50.Mochida S, Ohno A, Arai M, Tamatani T, Miyasaka M, Fujiwara K: Role of adhesion molecules in the development of massive hepatic necrosis in rats. Hepatology 1996, 23:320-328 [DOI] [PubMed] [Google Scholar]
- 51.Yasoshima M, Nakanuma Y, Tsuneyama K, van de Water J, Gershwin ME: Immunohistochemical analysis of adhesion molecules in the micro-environment of portal tracts in relation to aberrant expression of PDC-E2 and HLA-DR on the bile ducts in primary biliary cirrhosis. J Pathol 1995, 175:319-325 [DOI] [PubMed] [Google Scholar]
- 52.van Oosten M, van de Bilt E, de Vries HE, van Berkel TJ, Kuiper J: Vascular adhesion molecule-1 and intercellular adhesion molecule-1 expression on rat liver cells after lipopolysaccharide administration in vivo. Hepatology 1995, 22:1538-1546 [DOI] [PubMed] [Google Scholar]
- 53.Bautista AP: Chronic alcohol intoxication induces hepatic injury through enhanced macrophage inflammatory protein-2 production and intercellular adhesion molecule-1 expression in the liver. Hepatology 1997, 25:335-342 [DOI] [PubMed] [Google Scholar]
- 54.Lang T, Krams SM, Villanueva JC, Cox K, So S, Martinez OM: Differential patterns of circulating intercellular adhesion molecule-1 (cICAM-1) and vascular cell adhesion molecule-1 (cVCAM-1) during liver allograft rejection. Transplantation 1995, 59:584-589 [PubMed] [Google Scholar]
- 55.Doi T, Yamada G, Mizuno M, Tsuji T: Immunohistochemical study of the distribution of intercellular adhesion molecule-1 and lymphocyte function-associated antigen-1 in chronic type B hepatitis. J Gastroenterol 1994, 29:164-171 [DOI] [PubMed] [Google Scholar]
- 56.Mosnier JF, Scoazec JY, Marcellin P, Degott C, Benhamou JP, Feldmann G: Expression of cytokine-dependent immune adhesion molecules by hepatocytes and bile duct cells in chronic hepatitis C. Gastroenterology 1994, 107:1457-168 [DOI] [PubMed] [Google Scholar]
- 57.Satoh S, Nussler AK, Liu ZZ, Thomson AW: Proinflammatory cytokines and endotoxin stimulate ICAM-1 gene expression and secretion by normal human hepatocytes. Immunology 1994, 82:571-576 [PMC free article] [PubMed] [Google Scholar]
- 58.Ohlinger W, Dinges HP, Zatloukal K, Mair S, Gollowitsch F, Denk H: Immunohistochemical detection of tumor necrosis factor-α, other cytokines and adhesion molecules in human livers with alcoholic hepatitis. Virchows Arch A 1993, 423:169-176 [DOI] [PubMed] [Google Scholar]
- 59.Essani NA, Bajt ML, Farhood A, Vonderfecht SL, Jaeschke H: Transcriptional activation of vascular cell adhesion molecule-1 gene in vivo and its role in the pathophysiology of neutrophil-induced liver injury in murine endotoxin shock. J Immunol 1997, 158:5941-5948 [PubMed] [Google Scholar]
- 60.Hellerbrand Z, Wang SC, Tsukamoto H, Brenner DA, Rippe RA: Expression of intracellular adhesion molecule 1 by activated hepatic stellate cells. Hepatology 1996, 24:670-676 [DOI] [PubMed] [Google Scholar]
- 61.Steinhoff G, Behrend M, Schrader B, Duijverstijn AM, Wonigeit K: Expression patterns of leucocyte adhesion ligand molecules on human liver endothelia. Am J Pathol 1993, 142:481-488 [PMC free article] [PubMed] [Google Scholar]
- 62.Iigo Y, Suematsu M, Higashida T, Oheda J, Matsumoto K, Wakabayashi Y, Ishimura Y, Miyasaka M, Takashi T: Constitutive expression of ICAM-1 in rat microvascular systems analyzed by laser confocal microscopy. Am J Physiol 1997, 42:H138-H147 [DOI] [PubMed] [Google Scholar]
- 63.Pinzani M, Gesualdo L, Sabbah GM, Abboud HE: Effects of platelet-derived growth factor and other polypeptide mitogens on DNA synthesis and growth of cultured rat liver fat-storing cells. J Clin Invest 1989, 84:1786-1793 [DOI] [PMC free article] [PubMed] [Google Scholar]
- 64.Scharf JG, Knittel T, Müller L, Hartmann H, Ramadori G: Characterisation of the IGF axis components in isolated rat hepatic stellate cells (HSC). Hepatology 1998, 27:1275-1284 [DOI] [PubMed] [Google Scholar]
- 65.Bachem MG, Meyer D, Schäfer W, Riess U, Melchior R, Sell KM, Gressner AM: The response of rat liver perisinusoidal lipocytes to polypeptide growth regulator changes with their transdifferentiation into myofibroblast-like cells in culture. J Hepatol 1993, 18:40-52 [DOI] [PubMed] [Google Scholar]
- 66.Rathore A, Sacristan C, Ricklan DE, Flores VP, Stadecker MJ: In situ analysis of B7–2 costimulatory, major histocompatibility complex class II, and adhesion molecule expression in schistosomal egg granulomas. Am J Pathol 1996, 149:187-194 [PMC free article] [PubMed] [Google Scholar]
- 67.Nanji AA, Griniuviene B, Yacoub LK, Fogt F, Tahan SR: Intercellular adhesion molecule-1 expression in experimental alcoholic liver disease: relationship to endotoxemia and TNF α messenger RNA. Exp Mol Pathol 1995, 62:42-51 [DOI] [PubMed] [Google Scholar]
- 68.Bloom S, Fleming K, Chapman R: Adhesion molecule expression in primary sclerosing cholangitis and primary biliary cirrhosis. Gut 1995, 36:604-609 [DOI] [PMC free article] [PubMed] [Google Scholar]
- 69.Garcia-Monzon C, Sanchez-Madrid F, Garcia-Buey L, Garcia-Arroyo A, Garcia-Sanchez A, Moreno-Otero R: Vascular adhesion molecule expression in viral chronic hepatitis: evidence for neoangiogenesis in portal tracts. Gastroenterology 1995, 108:231-241 [DOI] [PubMed] [Google Scholar]
- 70.Bacchi CE, Marsh CL, Perkins JD, Carithers RJ, McVicar JP, Hudkins KL, Benjamin CD, Harlan JM, Lobb R, Alpers CE: Expression of vascular cell adhesion molecule (VCAM-1) in liver and pancreas allograft rejection. Am J Pathol 1993, 142:579-591 [PMC free article] [PubMed] [Google Scholar]
- 71.Larrea E, Garcia N, Qian C, Civeira MP, Prieto J: Tumor necrosis factor α gene expression and the response to interferon in chronic hepatitis C. Hepatology 1996, 23:210-217 [DOI] [PMC free article] [PubMed] [Google Scholar]
- 72.Chamulitrat W, Blazka ME, Jordan SJ, Luster MI, Mason RP: Tumor necrosis factor-α and nitric oxide production in endotoxin-primed rats administered carbon tetrachloride. Life Sci 1995, 57:2273-2280 [DOI] [PubMed] [Google Scholar]
- 73.Czaja MJ, Flanders KC, Biempica L, Klein C, Zern MA, Weiner FR: Expression of tumor necrosis factor-α and transforming growth factor-β 1 in acute liver injury. Growth Factors 1989, 1:219-226 [DOI] [PubMed] [Google Scholar]
- 74.Hoffmann R, Grewe M, Estler HC, Schulze SA, Decker K: Regulation of tumor necrosis factor-α-mRNA synthesis and distribution of tumor necrosis factor-α-mRNA synthesizing cells in rat liver during experimental endotoxemia. J Hepatol 1994, 20:122-128 [DOI] [PubMed] [Google Scholar]
- 75.Hussain MJ, Mustafa A, Gallati H, Mowat AP, Mieli VG, Vergani D: Cellular expression of tumour necrosis factor-α and interferon-γ in the liver biopsies of children with chronic liver disease. J Hepatol 1994, 21:816-821 [DOI] [PubMed] [Google Scholar]
- 76.Gonzalez AR, Garcia MC, Garcia BL, Moreno OR, Alonso JL, Yague E, Pivel JP, Lopez CM, Fernandez RE, Sanchez MF: Induction of tumor necrosis factor α production by human hepatocytes in chronic viral hepatitis. J Exp Med 1994, 179:841-848 [DOI] [PMC free article] [PubMed] [Google Scholar]
- 77.Ohira H, Ueno T, Torimura T, Tanikawa K, Kasukawa R: Leukocyte adhesion molecules in the liver and plasma cytokine levels in endotoxin-induced rat liver injury. Scand J Gastroenterol 1995, 30:1027-1035 [DOI] [PubMed] [Google Scholar]
- 78.Armendariz BJ, Katai H, Jones CM, Seyer JM, Kang AH, Raghow R: Transforming growth factor β gene expression is transiently enhanced at a critical stage during liver regeneration after CCl4 treatment. Lab Invest 1993, 69:283-294 [PubMed] [Google Scholar]