Abstract
A central difficulty of brain modelling is to span the range of spatio-temporal scales from synapses to the whole brain. This paper overviews results from a recent model of the generation of brain electrical activity that incorporates both basic microscopic neurophysiology and large-scale brain anatomy to predict brain electrical activity at scales from a few tenths of a millimetre to the whole brain. This model incorporates synaptic and dendritic dynamics, nonlinearity of the firing response, axonal propagation and corticocortical and corticothalamic pathways. Its relatively few parameters measure quantities such as synaptic strengths, corticothalamic delays, synaptic and dendritic time constants, and axonal ranges, and are all constrained by independent physiological measurements. It reproduces quantitative forms of electroencephalograms seen in various states of arousal, evoked response potentials, coherence functions, seizure dynamics and other phenomena. Fitting model predictions to experimental data enables underlying physiological parameters to be inferred, giving a new non-invasive window into brain function that complements slower, but finer-resolution, techniques such as fMRI. Because the parameters measure physiological quantities relating to multiple scales, and probe deep structures such as the thalamus, this will permit the testing of a range of hypotheses about vigilance, cognition, drug action and brain function. In addition, referencing to a standardized database of subjects adds strength and specificity to characterizations obtained.
Keywords: electrophysiology, biophysics, biological physics, neurophysiology, anatomy
1. Introduction
Electroencephalograms (EEGs) result from cortical electrical activity aggregated over scales much larger than individual neurons. Hence, in one class of models, averages are taken over microscopic neural structure to obtain continuum descriptions on scales of millimetres to the whole brain, incorporating representations of the anatomy and physiology of separate excitatory and inhibitory neural populations, nonlinear neural responses, multiscale interconnections, synaptic, dendritic, cell-body and axonal dynamics, and corticothalamic feedback (Wilson & Cowan 1973; Lopes da Silva et al. 1974; Nunez 1974, 1995; Freeman 1975; Steriade et al. 1990; Jirsa & Haken 1996; Wright & Liley 1996; Robinson et al. 1997, 1998, 2001a,b, 2002, 2003a,b, 2004; Rennie et al. 1999, 2002; Robinson 2003a, b; Rowe et al. 2004).
We have developed a physiologically based continuum model of corticothalamic dynamics that reproduces and unifies many features of EEGs, including the spectral peaks seen in waking and sleeping states (Robinson et al. 2001b, 2002, 2003a), evoked response potentials (Rennie et al. 2002), measures of coherence and spatio-temporal structure (Robinson 2003a,b; O'Connor et al. 2002; O'Connor & Robinson 2003), and generalized epilepsies and low-dimensional seizure dynamics (Robinson et al. 2002, 2003a). Our approach averages over microstructure to yield mean-field equations in a way that complement cellular-level and neural-network analyses. In the following sections we outline our model and briefly review some of its main results to date.
2. Corticothalamic model
The first feature incorporated is the neural response to the cell-body potential. Mean firing rates Qmax of neurons are nonlinearly related to mean potentials Va by , where a=e for excitatory cortical neurons, a=i for inhibitory neurons, and S is a sigmoidal function that increases from 0 to Qmax as Va increases from −∞ to ∞. We use
| (2.1) |
where θ is the mean neural firing threshold, relative to resting, and is its standard deviation.
The potential Va results when synaptic inputs from various types of afferent neurons are summed after being filtered and smeared out in time as a result of receptor dynamics and passage through the dendritic tree. It approximately obeys a differential equation (Robinson et al. 1997, 2001b, 2002, 2003a, 2004).
| (2.2) |
| (2.3) |
where 1/β and 1/α are the rise and decay times of the cell-body potential produced by an impulse at a dendritic synapse, corresponding to an impulse response proportional to , which is a widely used form in the literature. The right of equation (2.2) involves contributions ϕe,i from other cortical neurons, and inputs ϕs from thalamic relay nuclei, delayed by a time τab=t0/2 owing to anatomical separations between cortex and thalamus, where t0 is the time to traverse the loop from cortex to thalamus and back (τab=0 for intrathalamic and intracortical connections). The quantity Nab is the mean number of synapses from neurons of type b=e, i, s to type a=e, i and sab is the time-integrated strength of the response in neurons of type a to a unit signal from neurons of type b, implicitly weighted by the neurotransmitter release probability.
Each part of the corticothalamic system produces a field ϕa of pulses, which travel at a velocity va through axons with a characteristic range ra. These pulses spread out and dissipate if not regenerated. To a good approximation, this type of propagation obeys a damped-wave equation (Robinson et al. 1997, 2001b)
| (2.4) |
where γa=va/ra and ra is the mean range of axons a. If intracortical connectivities are proportional to the numbers of synapses involved, Vi=Ve and Qi=Qe (Wright & Liley 1996; Robinson et al. 1997), which lets us concentrate on excitatory quantities. The smallness of ri/vi also lets us set γi≈∞ (Robinson et al. 1997). Equation (2.4) is easily generalized to anisotropic propagation by modifying the Laplacian to weight the second derivatives differently in different directions.
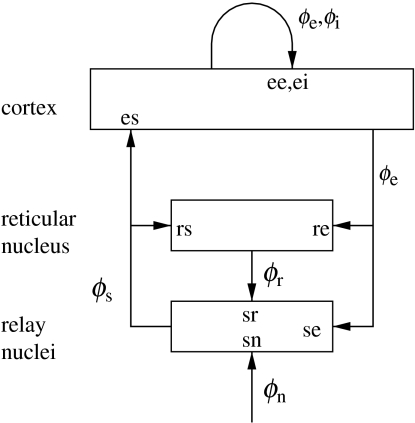
The model incorporates corticothalamic connectivities and thalamic nonlinearities. Figure 1 shows the connectivities considered, including the thalamic reticular nucleus, which inhibits relay nuclei and is lumped here with the perigeniculate nucleus, which has an analogous role (Steriade et al. 1997; Sherman & Guillery 2001). Relay nuclei convey external stimuli ϕn to the cortex, as well as passing on corticothalamic feedback. Thalamic cell-body potentials then satisfy equations (2.1) and (2.2) with a=r, s and b=e, r, s, n, while the small size of the thalamic nuclei enables us to assume ra≈0 and, hence, γa≈∞ for a=r, s.
Figure 1.
Schematic of corticothalamic interactions, showing the locations ab at which νab and Gab act.
Including only the connections shown in figure 1 and making the approximations mentioned above, we find that our model has 16 parameters. Writing νab=Nabsab, these are Qmax, θ, σ′, α, β, γe, re, t0, νee, νei, νes, νse, νsr, νsn, νre and νrs. These are sufficient in number to allow adequate representation of the most important anatomy and physiology, but few enough to yield useful interpretations and to enable reliable determination of values by fitting theoretical predictions to data. The parameters are approximately known from experimentation (Robinson et al. 2001b, 2002, 2004; Rowe et al. 2004), leading to the indicative values in table 1. We use only values compatible with physiology. Sensitivities of the model to parameter variations have been explored by Robinson et al. (2001), and in connection with the variations between sleep, wake, and other states (Robinson et al. 2002). The effects of volume conduction on the subsequent propagation of the potential to the scalp have also been incorporated into our model, via normalization and spatial filtering parameters (Robinson et al. 2001b,2002, 2004; Rowe et al. 2004). These are included in the bulk of the results reviewed here; space limitations preclude a detailed discussion, but their effects on spectral shape, for example, are slight at frequencies below about 20 Hz, since these correspond to the longest wavelengths. It should also be noted that scalp potentials are primarily generated by excitatory (mainly pyramidal) neurons owing to their greater size and degree of alignment compared with other types (Nunez 1995; Rennie et al. 2002; O'Connor & Robinson 2003). For any given geometry, in the linear regime at least, the scalp potential is proportional to the cortical potential, which is itself proportional to the mean cellular membrane currents, which are in turn proportional to ϕe. Hence, apart from a (dimensional) constant of proportionality and the effects of volume conduction, scalp EEG signals correspond to ϕe to a good approximation in the linear domain. For now, we will assume this proportionality to extend into the relevant parts of the nonlinear domain, but the validity of this assumption should be examined critically in future work.
Table 1.
Nominal parameters from Robinson et al. (2004) for the alert, eyes-open state in normal adults. (Parameters used in works from which some of the figures were obtained were, in general, similar, but not identical.)
| quantity | nominal | unit |
|---|---|---|
| Qmax | 340 | s−1 |
| ve | 10 | m s−1 |
| re | 86 | mm |
| θ | 13 | mV |
| σ′ | 3.8 | mV |
| γe | 116 | s−1 |
| 1/α | 12 | ms |
| 1/β | 1.3 | ms |
| t0 | 85 | ms |
| νee | 1.6 | mV s |
| −νei | 1.9 | mV s |
| νes | 0.39 | mV s |
| νse | 0.6 | mV s |
| −νsr | 0.45 | mV s |
| νsn | 0.15 | mV s |
| νre | 0.15 | mV s |
| νrs | 0.03 | mV s |
| 16 | s−1 |
In the present work we concentrate mainly on results for which the model parameters are assumed to be spatially uniform, but where the activity is free to be non-uniform down to scales of slightly less than a millimetre, where the model ceases to be valid as a consequence of averaging over submillimetre structures. The generalization to include spatial non-uniformities is straightforward, and Robinson et al. (2003b) present initial results of such an analysis.
3. Results
(a) Steady states and stability
Setting all derivatives to zero in equations (2.3) and (2.4) yields steady states when the system is driven by a constant, uniform mean stimulus level . The equations are easily solved numerically, yielding a single stable low-ϕe solution, which corresponds to a normal state. Other steady states are either unstable or have extremely high ϕe, and presumably correspond to seizures (Robinson et al. 1997, 1998, 2002), which will be discussed below.
(b) Transfer functions and linear waves
Small perturbations relative to steady states can be treated using linear analysis. A stimulus ϕn(k,ω) of angular frequency ω (=2πf, where f is the usual frequency in Hz) and wave vector k (=2π/λ in magnitude, where λ is the wavelength) has the transfer function to ϕe(k,ω)
| (3.1) |
| (3.2) |
| (3.3) |
where embodies the low-pass filter characteristics of synaptodendritic dynamics and is the steady-state value of ϕa. The ratio (3.1) is the cortical excitatory response per unit external stimulus, and encapsulates the relative phase via its complex value (Robinson et al. 2001b,2004 Rennie et al. 2002); it is key to linear properties of the system. The gain Gab is the differential output produced by neurons a per unit change in input neurons b, and the static gains for loops in figure 1 are Gese=GesGse for feedback via relay nuclei only, Gesre=GesGsrGre for the loop through reticular and relay nuclei, and Gsrs=GsrGrs for the intrathalamic loop.
Waves obey the dispersion relation (Robinson et al. 1997)
| (3.4) |
which corresponds to singularity of the transfer function (3.1). Solutions of this equation satisfy at high frequencies (Robinson et al. 1997). At lower frequencies, their dispersion has been investigated in detail previously (Robinson et al. 1997; Rennie et al. 1999).
(c) Spectra and coherence
The EEG frequency spectrum is obtained by squaring the modulus of ϕe and integrating over k:
| (3.5) |
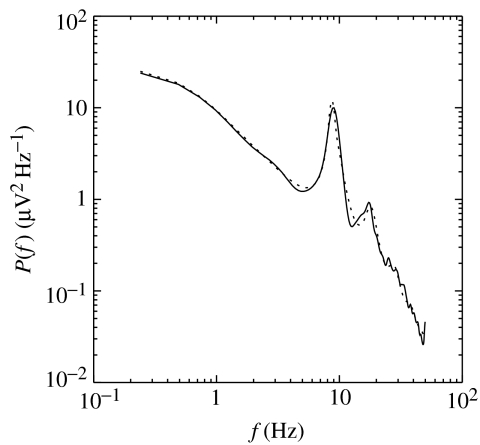
Figure 2 shows excellent agreement with an observed spectrum over several decades if ϕn is assumed to be white noise in space and time. The features reproduced include the alpha and beta peaks at frequencies f≈1/t0, 2/t0, and the asymptotic low- and high-frequency behaviours; key differences between waking and sleep spectra can also be reproduced (see below and Robinson et al. 2001b). The low-frequency 1/f behaviour is a signature of marginally stable dynamics, which allow complex behaviour (Robinson et al. 1997,2001b). Corticothalamic loop resonances account for the correlations between alpha and beta peaks, the correlated changes in spectral peaks between sleep and waking, and alpha splitting, for example (Robinson et al. 2001a,b 2003b). Alternative proposed mechanisms, including pacemakers and purely cortical resonances, can account for some features of the data, but have a number of shortcomings, which were discussed in detail by Robinson et al. (2001a) and (for pacemakers in particular) by Nunez (1995). Notably, the trend in mode frequency predicted for purely cortical eigenmodes tends to be in the opposite direction to that observed, although this is not unequivocal, while the pacemaker hypothesis is completely ad hoc, with a new pacemaker proposed for every spectral peak.
Figure 2.
Example spectrum (solid) and model fit (dashed) from a typical adult subject in the eyes-closed state.
A one-dimensional wave number spectrum results if one integrates |ϕe(k,ω)|2 over frequency, then over one component of k:
| (3.6) |
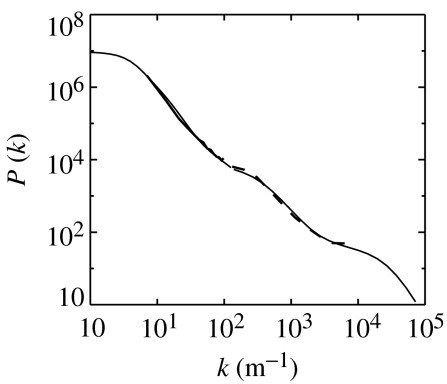
Figure 3 shows that this spectrum is flat at small kx, then decreases steeply in ranges separating knees that correspond to the inverse of each characteristic axonal range in the problem. In this case, knees are predicted at k≈1/re, 1/rm, 1/ri, where rm≈2 mm is the characteristic range of intermediate-length excitatory neurons, known to exist in the cortex (incorporated in a slight generalization of the version of the model presented here; O'Connor & Robinson 2003). The EEG and electrocorticographic observations shown are consistent with these predictions over nearly three decades in k.
Figure 3.
Wave number spectrum. Model results are shown as a light solid curved, while a combined set of electrocorticographic and electroencephalographic data are shown by heavy dashed and heavy solid curves, respectively.
The cross spectrum P(r, r′, ω) is the phase average of ϕe(r, ω)ϕe(r′, ω). The coherence function is then
| (3.7) |
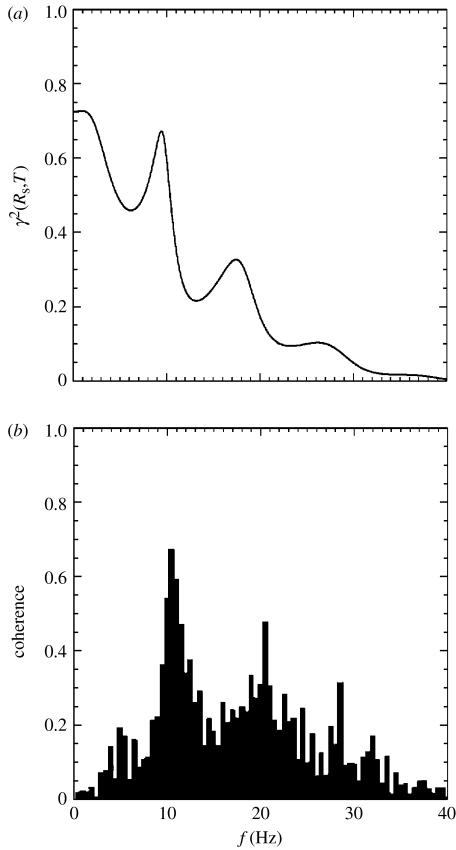
Figure 4 shows that this gives good agreement with observations of γ2 as a function of frequency at fixed separation for model parameters close to those used in obtaining the other plots in this work (Srinivasan et al. 1998; Robinson et al. 2003a). Particular features of figure 4 are that coherence peaks correspond to spectral peaks, reflecting the fact that weakly damped waves can reach high amplitudes (hence a spectral peak) and propagate far before dissipating (hence high coherence). The discrepancy at very low frequencies is owing to high-pass filtering of the experimental signals, which degrades low-frequency coherence; it does not represent an actual inconsistency.
Figure 4.
Coherence versus frequency (solid) for alert, eyes-open conditions and a fixed electrode separation. (a) Model. (b) Data from Srinivasan et al. (1998).
(d) Time-series and evoked response potentials
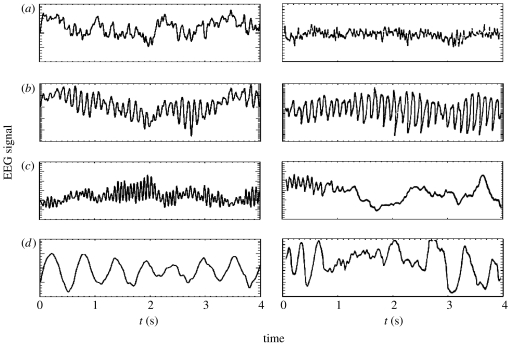
Figure 5 shows model time-series for parameters illustrating eyes-open (EO), eyes-closed (EC; but awake), sleep-stage 2 and sleep-stage 4 states, holding Qmax, γe, t0, β/α, νei and νsn constant and varying α and the other νab only moderately. As seen here, the features seen strongly resemble those of the corresponding experimental data (Steriade et al. 1990; Nunez 1995; Niedermeyer & Lopes da Silva 1999; Steriade 2000, 2001).
Figure 5.
Left column: model time-series representative of (a) alert, eyes-open, (b) relaxed, eyes-closed, (c) sleep-stage 2 and (d) sleep-stage 4. Right column: corresponding time-series from human subjects (Nunez 1995). Note that the vertical normalizations differ between the two columns.
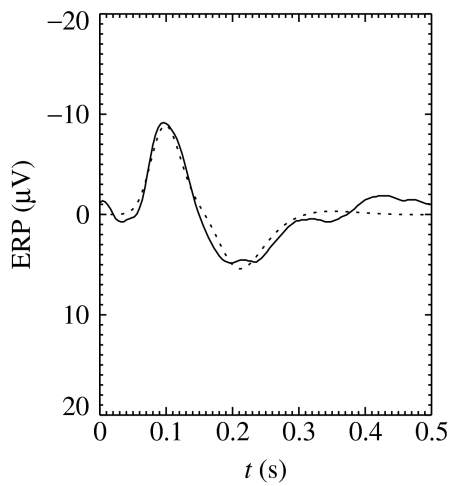
The inverse Fourier transform of ϕe(k,ω), obtained from equation (3.1) for an appropriate form of ϕn (e.g. a delta function or narrow Gaussian), gives the evoked response potential (ERP) that results from an impulse stimulus. Initial work shows that the result agrees well with experiment, as was discussed in detail by Rennie et al. (2002), as illustrated by the example of a background (as opposed to target, in an oddball paradigm) ERP in figure 6. Significantly, the model parameters used are almost identical to those that reproduce the same subject's pre-stimulus EEG spectrum.
Figure 6.
Experimental (solid) and model (dashed) ERPs in response to a background stimulus in an auditory oddball paradigm.
This model of ERPs relies on modulation of the resonance characteristics of the corticothalimic circuit, whereas other models generally rely on reciprocal connections between excitatory and inhibitory neurons within the cortex as the foundation for ERP-like effects. Additional points of difference between available ERPs models are (i) whether spatial effects are included, (ii) the assumed connectivity between neural populations and (iii) the independent justification for parameter values. The advantage of our approach is that variations in the spatial and temporal character of ERPs can be achieved through thalamic modulations, drawing on theories from psychology about the role of the thalamus in attention. Parameters inferred must also be consistent with those of EEGs in the same subject, apart from attentional changes, thereby overcoming the historical tendency to treat the two types of phenomena separately.
The steady-state potential evoked by a sinusoidal stimulus can be obtained analogously to ERPs by inverse transforming ϕe(k,ω), given by equation (3.1) for monochromatic ϕn with appropriate spatial structure for the stimulus in question.
(e) Stability zone, instabilities and seizures
Waves obey the dispersion relation (3.4), with instability boundaries where this equation is satisfied for real ω (Robinson et al. 1997, 2001b). In most circumstances, waves with k=0 (i.e. spatially uniform) are the most unstable (Robinson et al. 1997), and it is found that only the first few (i.e. lowest frequency) spectral resonances can become unstable. Analysis for realistic parameter ranges finds just four k=0 instabilities, leading to global nonlinear dynamics (Robinson et al. 2002, 2003a): (i) Slow-wave instability (f≈0) that leads to a low frequency spike-wave limit cycle. (ii) Theta instability, which saturates in a nonlinear limit cycle near 3 Hz, with a spike-wave form unless its parameters are close to the instability boundary. (iii) Spindle instability at ω≈(αβ)1/2, leading to a limit cycle at 10–15 Hz. (iv) Alpha instability, giving a limit cycle near 10 Hz. The boundaries defined by these four instabilities have been interpreted as corresponding to onsets of generalized seizures (Robinson et al. 2002, 2003a), although in some cases, the limit cycles that set in there may not lead to seizure symptoms, at least until their amplitudes become large.
The occurrence of only a few instabilities, at low frequencies, enables the state and physical stability of the brain to be represented in a three-dimensional space with axes
| (3.8) |
| (3.9) |
| (3.10) |
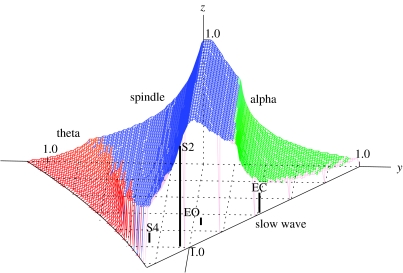
which parametrize cortical, corticothalamic and thalamic stability, respectively (Robinson et al. 2002). In terms of these quantities, the brain occupies a stability zone illustrated in figure 7. The back is at x=0 and the base at z=0. A pure spindle instability occurs at z=1, which couples to the alpha instability on the upper boundaries, with spindle dominating at top and left, and alpha at right. At small z, the left surface is defined by a theta instability (Robinson et al. 2002, 2003a). The front right surface corresponds to slow-wave instability and follows the plane x+y=1.
Figure 7.
Brain stability zone. The surface is shaded according to instability, as labelled (dark grey=spindle, light grey at right=alpha, light grey at left=theta), with the front right-hand face left transparent as it corresponds to a slow-wave instability. Approximate locations are shown of alert eyes-open (EO), relaxed, eyes-closed (EC), sleep-stage 2 (S2) and sleep‐stage4 (S4) states, with each state located at the top of its bar, whose x–y coordinates can be read from the grid.
Non-seizure states lie within the stability zone in figure 7. Detailed arguments regarding the sign of feedback via the thalamus, proximity between neighbouring behavioural states, and the results of explicit fitting to data place the arousal sequence from alert EO to deep sleep, including relaxed EC and sleep-stages 1–4 (S1–S4), as shown in figure 7 (Robinson et al. 2002). In future, it is expected that known differences between EEG spectra for subjects with differing disorders will also enable classification of these conditions into different parts of the stability zone.
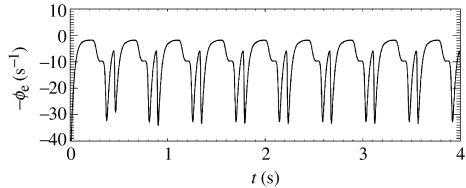
One common generalized epilepsy is petit mal, or absence epilepsy. Seizures last 5–20 s, cause loss of consciousness, and show a spike-wave cycle which starts and stops abruptly across the whole scalp (Steriade et al. 1990; Niedermeyer & Lopes da Silva 1999). Figure 8 shows results from our model under conditions for a theta instability. An approximately 3 Hz spike-wave cycle is seen, which closely resembles observed petit mal time-series (Feucht et al. 1998; Robinson et al. 2002, 2003b).
Figure 8.
Sample time-series from the model in a regime corresponding to a petit mal seizure.
4. Inversion and parameter determination
To test our model and estimate some of its parameters, we fitted the parameters of its linear spectrum to 101 normal adults' EC and EO spectra from previous studies using a nonlinear least-squares algorithm (Robinson et al. 2002, 2004; Rowe et al. 2004). This yielded mean parameters consistent with those in table 1. Fits to a further 3000 subjects in the Brain Resource International Database are currently underway.
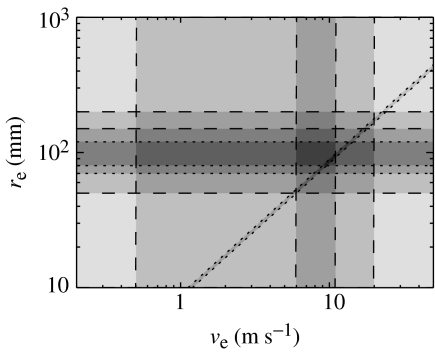
The parameter values obtained using spectral fits and other model-based constraints prove to be both consistent with independent measures, and complementary to them, often yielding improved constraints on the parameters involved. This is illustrated in figure 9, where we show constraints on the corticocortical axonal range re and signal velocity ve. Independent constraints obtained by standard physiological means (direct measurement of axonal lengths and velocities), shown dashed, define a rectangle consistent with all such constraints (Robinson et al. 2004). Model-based constraints, obtained from consistency with spectra, coherence functions and spatial structure in EEGs are shown dotted. These severely restrict the consistent parameter combinations to a small trapezoid (Robinson et al. 2004). Among these constraints is one on γe deriving from fits to observed EEG spectra, which yields the narrow diagonal band shown. Further details of the constraints are discussed by Robinson et al. (2004).
Figure 9.
Illustrative parameter constraints on mean corticocortical axonal range re and velocity ve from the model and independent studies. Independent physiological bounds are shown dashed, while model-based ones are dotted, and dark shading indicates consistency with multiple constraints.
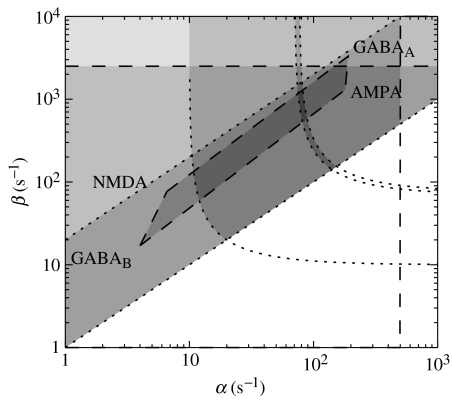
Figure 10 shows constraints on the synaptodendritic rate parameters α and β. Here, independent physiological studies of the dynamics of the main neurotransmitters, and of dendrite cable properties, define a large, irregular pentagon of mutual parameter consistency, while model-based constraints arising from consistency with EEG spectra define a boomerang-shaped zone that intersects this pentagon to yield a narrow sliver of mutually consistent parameter space. Again, the results are consistent (the zone of intersection is non-null) and complementary (the constraints are roughly orthogonal to pre-existing ones); the details are discussed by Robinson et al. (2004).
Figure 10.
Illustrative parameter constraints on mean soma potential rise and decay rates β and α from the model and independent studies. Independent physiological bounds are shown dashed, while model-based ones are dotted, and dark shading indicates consistency with multiple constraints. Parameters corresponding to the four main neurotransmitter receptors, AMPA, NMDA, GABAA and GABAB are as shown.
5. Discussion
We have presented a brief review of our model and some of its major predictions to date. This model incorporates the main features of corticothalamic physiology and anatomy using only 16 parameters. Its predictions provide a unified quantitative description of a wide range of phenomena, giving excellent agreement with observed EEG spectra, EEG time-series, evoked response potentials, coherence and correlation functions, and seizure dynamics. A key feature of our approach is thus that we extract a broad range of behaviour from modest changes in the parameters of a single mode, without postulating extra mechanisms.
Of key importance is the xyz parameter space in which the stability zone of the brain is easily visualized, and in which disorders, states of arousal, and so on, can be classified. Zone boundaries are identified with onsets of generalized seizures, consistent with known features of their time-series and patterns of occurrence.
Fitting the model's predictions to data provides a non-invasive probe of large-scale physiology that yields parameter values consistent with, and complementary to, independent measures. This has the potential to facilitate testing of a range of hypotheses about vigilance, cognition, drug action and brain function, on a range of spatial and temporal scales, particularly when coupled with the statistics of large numbers of subjects in our standardized database.
Acknowledgments
We thank P. L. Nunez for permission to reproduce the material in figure 4b and the right column of figure 5. This work was supported by the Australian Research Council and the University of Sydney's Sesqui Grant Scheme.
Footnotes
One contribution of 21 to a Theme Issue ‘Multimodal neuroimaging of brain connectivity’.
References
- Feucht M, Möller U, Witte H, Schmidt K, Arnold M, Benninger F, Steinberger K, Friedrich M.H. Nonlinear dynamics of 3 Hz spike-and-wave discharges recorded during typical absence seizures in children. Cereb. Cortex. 1998;8:524–533. doi: 10.1093/cercor/8.6.524. [DOI] [PubMed] [Google Scholar]
- Freeman W.J. Academic Press; New York: 1975. Mass action in the nervous system. [Google Scholar]
- Jirsa V.K, Haken H. Field theory of electromagnetic brain activity. Phys. Rev. Lett. 1996;77:960–963. doi: 10.1103/PhysRevLett.77.960. [DOI] [PubMed] [Google Scholar]
- Lopes da Silva F.H, Hoeks A, Smits H, Zetterberg L.H. Model of brain rhythmic activity. The alpha rhythm of the thalamus. Kybernetik. 1974;15:27–37. doi: 10.1007/BF00270757. [DOI] [PubMed] [Google Scholar]
- Niedermeyer E, Lopes da Silva F.H. 4th edn. Williams & Wilkins; Baltimore, MD: 1999. Electroencephalography: basic principles, clinical applications, and related fields. [Google Scholar]
- Nunez P.L. Wave-like properties of the alpha rhythm. IEEE Trans. Biomed. Eng. 1974;21:473–482. [Google Scholar]
- Nunez P.L. Oxford University Press; Oxford: 1995. Neocortical dynamics and human EEG rhythms. [Google Scholar]
- O'Connor S.C, Robinson P.A. Wavenumber spectrum of electrocorticographic signals. Phys. Rev. E. 2003;67:051912.1–051912.13. doi: 10.1103/PhysRevE.67.051912. [DOI] [PubMed] [Google Scholar]
- O'Connor S.C, Robinson P.A, Chiang A.K.I. Wavenumber spectrum of electroencephalographic signals. Phys. Rev. E. 2002;66:061905.1–061905.12. doi: 10.1103/PhysRevE.66.061905. [DOI] [PubMed] [Google Scholar]
- Rennie C.J, Robinson P.A, Wright J.J. Effects of localized feedback on dispersion of electrical waves in the cerebral cortex. Phys. Rev. E. 1999;59:3320–3329. [Google Scholar]
- Rennie C.J, Robinson P.A, Wright J.J. Unified neurophysical model of EEG spectra and evoked potentials. Biol. Cybern. 2002;86:457–471. doi: 10.1007/s00422-002-0310-9. [DOI] [PubMed] [Google Scholar]
- Robinson P.A. Neurophysical theory of coherence and correlations of electroencephalographic signals. J. Theor. Biol. 2003a;222:163–175. doi: 10.1016/s0022-5193(03)00023-7. [DOI] [PubMed] [Google Scholar]
- Robinson P.A. Interpretation of scaling properties of electroencephalographic fluctuations via spectral analysis and underlying physiology. Phys. Rev. E. 2003b;67:032902.1–032902.4. doi: 10.1103/PhysRevE.67.032902. [DOI] [PubMed] [Google Scholar]
- Robinson P.A, Rennie C.J, Wright J.J. Propagation and stability of waves of electrical activity in the cortex. Phys. Rev. E. 1997;56:826–840. [Google Scholar]
- Robinson P.A, Rennie C.J, Wright J.J, Bourke P. Steady states and global dynamics of electrical activity in the cerebral cortex. Phys. Rev. E. 1998;58:3557–3571. [Google Scholar]
- Robinson P.A, Loxley P.N, O'Connor S.C, Rennie C.J. Modal analysis of corticothalamic dynamics, electroencephalographic spectra, and evoked potentials. Phys. Rev. E. 2001;63:041909.1–041909.13. doi: 10.1103/PhysRevE.63.041909. [DOI] [PubMed] [Google Scholar]
- Robinson P.A, Rennie C.J, Wright J.J, Bahramali H, Gordon E, Rowe D.L. Prediction of electroencephalographic spectra from neurophysiology. Phys. Rev. E. 2001;63:021903.1–021903.18. doi: 10.1103/PhysRevE.63.021903. [DOI] [PubMed] [Google Scholar]
- Robinson P.A, Rennie C.J, Rowe D.L. Dynamics of large-scale brain activity in normal arousal states and epileptic seizures. Phys. Rev. E. 2002;65:041924.1–041924.9. doi: 10.1103/PhysRevE.65.041924. [DOI] [PubMed] [Google Scholar]
- Robinson P.A, Rennie C.J, Rowe D.L, O'Connor S.C, Wright J.J, Gordon E, Whitehouse R.W. Neurophysical modeling of brain dynamics. Neuropsychopharmacology. 2003;28(Suppl. 1):74–79. doi: 10.1038/sj.npp.1300143. [DOI] [PubMed] [Google Scholar]
- Robinson P.A, Whitehouse R.W, Rennie C.J. Nonuniform corticothalamic continuum model of EEG spectra with application to split-alpha peaks. Phys. Rev. E. 2003;68:021922.1–021922.10. doi: 10.1103/PhysRevE.68.021922. [DOI] [PubMed] [Google Scholar]
- Robinson P.A, Rennie C.J, Rowe D.L, O'Connor S.C, Gordon E. Estimation of neurophysiologic parameters on multiple spatial and temporal scales by EEG means: consistency and complementarity vs. independent measures. Hum. Brain Mapp. 2004;23:53–72. doi: 10.1002/hbm.20032. [DOI] [PMC free article] [PubMed] [Google Scholar]
- Rowe D.L, Robinson P.A, Rennie C.J. Estimation of neurophysiological parameters from the waking EEG using a biophysical model of brain dynamics. J. Theor. Biol. 2004;231:413–433. doi: 10.1016/j.jtbi.2004.07.004. [DOI] [PubMed] [Google Scholar]
- Sherman S.M, Guillery R.W. Academic Press; San Diego: 2001. Exploring the thalamus. [Google Scholar]
- Srinivasan R, Nunez P.L, Silberstein R.B. Spatial filtering and neocortical dynamics: estimates of EEG coherence. IEEE Trans. Biomed. Eng. 1998;45:814–826. doi: 10.1109/10.686789. [DOI] [PubMed] [Google Scholar]
- Steriade M. Corticothalamic resonance, states of vigilance and mentation. Neuroscience. 2000;101:243–276. doi: 10.1016/s0306-4522(00)00353-5. [DOI] [PubMed] [Google Scholar]
- Steriade M. MIT Press; Cambridge, MA: 2001. The intact and sliced brain. [Google Scholar]
- Steriade M, Gloor P, Llinás R.R, Lopes da Silva F.H, Mesulam M.-M. Basic mechanisms of cerebral rhythmic activities. Electroencephalogr. Clin. Neurophysiol. 1990;76:481–508. doi: 10.1016/0013-4694(90)90001-z. [DOI] [PubMed] [Google Scholar]
- Steriade M, Jones E.G, McCormick D.A. Elsevier; Oxford: 1997. Thalamus (2 vols) [Google Scholar]
- Wilson H.R, Cowan J.D. A mathematical theory of the functional dynamics of cortical and thalamic nervous tissue. Kybernetik. 1973;13:55–80. doi: 10.1007/BF00288786. [DOI] [PubMed] [Google Scholar]
- Wright J.J, Liley D.T.J. Dynamics of the brain at global and microscopic scales: neural networks and the EEG. Behav. Brain Sci. 1996;19:285–309. [Google Scholar]


