Abstract
Diffusion-weighted magnetic resonance imaging holds substantial promise as a technique for non-invasive imaging of white matter (WM) axonal projections. For diffusion imaging to be capable of providing new insight into the connectional neuroanatomy of the human brain, it will be necessary to histologically validate the technique against established tracer methods such as horseradish peroxidase and biocytin histochemistry. The macaque monkey provides an ideal model for histological validation of the diffusion imaging method due to the phylogenetic proximity between humans and macaques, the gyrencephalic structure of the macaque cortex, the large body of knowledge on the neuroanatomic connectivity of the macaque brain and the ability to use comparable magnetic resonance acquisition protocols in both species. Recently, it has been shown that high angular resolution diffusion imaging (HARDI) can resolve multiple axon orientations within an individual imaging voxel in human WM. This capability promises to boost the accuracy of tract reconstructions from diffusion imaging. If the macaque is to serve as a model for histological validation of the diffusion tractography method, it will be necessary to show that HARDI can also resolve intravoxel architecture in macaque WM. The present study therefore sought to test whether the technique can resolve intravoxel structure in macaque WM. Using a HARDI method called q-ball imaging (QBI) it was possible to resolve composite intravoxel architecture in a number of anatomic regions. QBI resolved intravoxel structure in, for example, the dorsolateral convexity, the pontine decussation, the pulvinar and temporal subcortical WM. The paper concludes by reviewing remaining challenges for the diffusion tractography project.
Keywords: diffusion magnetic resonance imaging, high angular resolution diffusion imaging, macaque, white matter, connectivity, tractography
1. Introduction
Despite continuing improvements in structural magnetic resonance imaging (MRI) technology, individual axons remain beyond the resolving capability of conventional structural MRI methods. Recently, it has been proposed that white matter (WM) axon pathways can be reconstructed non-invasively using an MRI technique called diffusion-weighted MRI (Conturo et al. 1999; Mori et al. 1999; Basser et al. 2000; Koch et al. 2002; Lori et al. 2002; Mori & Van Zijl 2002; Parker et al. 2002; Behrens et al. 2003). Diffusion-weighted MRI, or simply diffusion MRI, measures the molecular mobility of the endogenous water in brain tissue (Basser et al. 1994; Pierpaoli et al. 1996). The reconstruction of WM pathways from diffusion MRI is based on the observation that in cerebral WM, water diffusion is greater in the direction parallel to the fibre bundle than in the transverse direction (Chenevert et al. 1990; Chien et al. 1990; Moseley et al. 1991; Beaulieu 2002). This phenomenon is referred to as diffusion anisotropy. The biophysical basis for diffusion anisotropy in WM is not fully known but may be due to the diffusion barrier presented by the myelin sheath and the cell membrane (Beaulieu 2002).
Investigators have sought to reconstruct WM pathways from diffusion images by computationally tracing the direction of maximal diffusion. Borrowing from a hydrodynamic analogy, the diffusion images provide the flow vector field, and the WM pathways represent flow streamlines. The reconstruction of WM pathways from diffusion imaging is a technique referred to as diffusion tractography.
Diffusion tractography has been applied widely in both research and clinical applications, but the technique has yet to be validated histologically in any systematic fashion. The tractography technique will need to be validated against established tracer methods before the tractography reconstructions can be interpreted with any reasonable confidence. Table 1 lists the advantages and disadvantages of the diffusion MR method compared with conventional histological techniques. In general, there is a trade-off between the invasiveness and model-dependence of a method. For example, diffusion MR tractography is non-invasive but requires a model of the relationship between the diffusion signal and the underlying myeloarchitecture. Invasive tracers such as horseradish peroxidase and biocytin can follow the continuity of an axon without need for a mathematical model of the transport process.
Table 1.
Comparison of diffusion MRI and histological tract-tracing methods.
| method | diffusion MRI | MR tracing | in vivo tracing | post-mortem tracing |
|---|---|---|---|---|
| tracer | H2O | Mn2+, MION | e.g. HRP, lectins, dextrans | carbocyanine dyes, e.g. DiI |
| invasiveness of tracer application | none | inhalation or injection; toxic? | pressure injection or iontophoresis | early post-mortem |
| invasiveness of tracer detection | none | none | yes | post-mortem |
| duration of experiment | minutes to hours | days | weeks | months |
| intrasubject repeatability | yes | depending on tracer elimination and toxicity | no | no |
| intersubject comparability | moderate to high; depends on registration | unknown | high; intersubject variability demonstratable | high |
| size of group studies | large populations | experimental, not yet done | small groups | small groups |
| extent | entire brain | entire brain | entire brain | mm to a few cm |
| spatial information | coordinates | coordinates | rare, requires reconstruction | not done |
| max. resolution | ∼100 μm to ∼1 mm | ∼100 μm | single axon | single axon |
| single axon detectability | no | no | yes | yes |
| detection of axonal continuity | no | yes/trans-synaptic | yes | yes |
| multiple tract tracing | simultaneous, but poor separation | consecutive | simultaneous with differentiable tracers | feasible, e.g. DiI and DiO |
| trans-synaptic pathways | no direction information | yes | with viral tracers | no |
| quantification of connectivity | indirect global measures | not done | rank order scale; rarely cell count or axon density | rank order scale |
| detection of axonal integrity | indirect, e.g. acute ischemic stroke | not done | with degeneration staining | not done |
| references | Conturo et al. (1999), Mori et al. (1999), Basser et al. (2000), Koch et al. (2002), Lori et al. (2002), Mori & Van Zijl (2002), Parker et al. (2002) and Behrens et al. (2003) | Pautler et al. (1998), Rye (1999), Lin et al. (2001) and Saleem et al. (2002) | Kobbert et al. (2000), Reiner et al. (2000) and Vercelli et al. (2000) | Honig & Hume (1989) and Galuske et al. (2000) |
The accuracy of diffusion MR tractography is currently limited by a number of factors including the low spatial resolution of the MR image relative to the tract curvature (Lori et al. 2002), the ambiguity between crossing and bending fibres (Basser et al. 2000; Tuch 2004) and distortions in the diffusion images (Jezzard & Clare 1999). The latter problem hampers accurate registration between diffusion images and conventional T1-weighted structural images from which anatomical labels are conventionally obtained. More fundamentally, the tractography method is based on a presumed correspondence between the measured diffusion function and the underlying myeloarchitecture, although this relationship has never been tested.
The macaque monkey provides an ideal model for histological validation of the tractography method due to the phylogenetic proximity between humans and macaques, and the gyrencephalic structure of macaque cortex. Additionally, there is a large body of existing knowledge on the anatomic connectivity of the macaque brain. In particular, validation of diffusion tractography against the CoCoMac database (Stephan et al. 2001; Kotter 2004; http://www.cocomac.org) is a promising avenue of research. The CoCoMac database contains a catalogue of reported tracing results in the macaque in a format which can be directly compared with the MR.
The macaque also provides an excellent validation model due to the ability to use comparable MR acquisition protocols in both humans and macaques. Parker and colleagues (2002) have previously demonstrated the technical feasibility of acquiring high resolution diffusion tensor imaging (DTI) in the macaque. It has recently been shown that a high angular resolution diffusion imaging (HARDI) method called q-ball imaging (QBI) can resolve multiple intravoxel axon orientations in human WM (Tuch et al. 2003; Tuch 2004). This capability promises to substantially boost the accuracy of the diffusion MR tract reconstructions. Other HARDI methods include persistent angular structure MRI (PASMRI; Jansons & Alexander 2003), mixture model decomposition (Tuch et al. 2002; Parker & Alexander 2003), generalized DTI (Ozarslan & Mareci 2003; Liu et al. 2004), spherical harmonic transformation (Frank 2001) and spherical harmonic deconvolution (Tournier et al. 2004).
The conventional diffusion imaging method for mapping fibre orientation is DTI (Basser et al. 1994; Pierpaoli et al. 1996). DTI can only resolve a single diffusion orientation within each imaging voxel however (Wiegell et al. 2000; Pierpaoli et al. 2001). This limitation is because of the assumption of Gaussian diffusion implicit to the tensor model.
In contrast, QBI poses no assumptions on the underlying diffusion process and can resolve multiple intravoxel diffusion orientations. Rather than measuring the diffusion tensor, QBI measures the diffusion orientation distribution function (ODF). The diffusion ODF ψ(u) describes the probability distribution for a water molecule to displace in a direction u, where u is a unit vector with no polarity, also called a director. In anatomic regions containing multiple axon orientations, the diffusion ODF exhibits multiple diffusion peaks, or multimodal diffusion (MMD; Tuch et al. 2003; Tuch 2004). The QBI method is thus capable of detecting the presence of multiple diffusion directions within an individual voxel.
The resolution of a QBI experiment is defined in diffusion displacement space and is determined by the experimental diffusion wavevector q (Tuch 2004). The diffusion wavevector q is proportional to the duration δ and magnitude g of the diffusion-sensitizing magnetic field gradient; specifically, q=(2π)−1γgδ where γ is the gyromagnetic ratio (Callaghan 1993). In QBI, the diffusion wavevector defines a projection function ρ(r), which describes the radial fall-off of the projection beam in diffusion space. For a standard single wavevector QBI acquisition, the projection function is a Bessel beam, ρ(r)=J0(2πqr) (Tuch 2004). The projection function has a width in the order of microns for a conventional QBI acquisition. The microscopic resolving power of QBI enables the technique to resolve multiple diffusion orientations within an individual imaging voxel. Previously, such intravoxel complexity has confounded diffusion imaging methods, such as DTI, which are only capable of resolving a single diffusion orientation within each imaging voxel (Wiegell et al. 2000; Pierpaoli et al. 2001).
It is important to note that the resolution of a QBI acquisition has dimensions length and not angle. Thus, the diffusion wavevector does not provide a direct indication of the angular resolution. The angular resolution also depends on the q-space sampling density on the sphere. The final resolution will be a function of the sampling wavevector, the sampling density and any smoothing operations applied in post-processing. Developing an imaging framework for QBI which will allow for the description of the angular resolution for a given sampling and reconstruction scheme is an area of active research.
QBI has demonstrated the capability of resolving complex intravoxel WM architecture in the human brain (Tuch et al. 2003; Tuch 2004) but it is not clear if QBI can also resolve intravoxel WM structure in the macaque brain. If the macaque is to serve as a model for histological validation of diffusion MR tractography, it will be necessary to show that QBI can also resolve complex WM architecture in the macaque. The objectives of the present study were therefore twofold: to demonstrate that QBI can resolve subvoxel architecture in macaque WM, and to develop a platform for future validation of diffusion tractography against histological tracer methods and the CoCoMac database.
In macaque WM, QBI resolved intravoxel architecture in a number of anatomic regions. QBI resolved intravoxel WM structure in, for example, the dorsolateral convexity, the pontine decussation, the pulvinar and temporal subcortical WM. The intravoxel fibre crossings were consistent with the known association, projection and callosal fibre architecture of the macaque brain. The paper concludes by discussing remaining challenges for the diffusion tractography project.
2. Methods
(a) Data acquisition
MRI data were acquired from one juvenile male rhesus monkey (Macaca mulatta, 3.5 kg, ID #M304). The data were acquired on a Siemens Trio 3T MRI scanner located at the Athinoula A. Martinos Center for Biomedical Imaging, Massachusetts General Hospital (Charlestown, Massachusetts). All procedures conformed to Massachusetts General Hospital and National Institutes of Health guidelines for the care and use of laboratory animals (Subcommittee on Research Animal Care protocol #2003N000338).
The animal was anaesthetized with a ketamine and xylazine dosage (10 and 0.5 mg kg−1, i.m.). After induction of the anaesthesia, an intravenous line (saphenous vein) was used to give additional ketamine injections to maintain anaesthesia during the scan. The monkey was placed into a magnet compatible stereotactic apparatus (Kopf Instruments, Tujunga, California). Local anaesthetic (lidocaine cream) was applied to the ends of the ear bars and ophthalmic ointment was applied to the eyelids to minimize discomfort induced by the stereotactic apparatus. A heating pad was placed beneath the subject to keep the animal warm during the scan session. A custom-built 13 cm diameter flat surface (receive-only) coil was positioned over the skull and was fixed at a dorsal–ventral level of the outer ear canals. Care was taken that the brain was positioned in the middle of the coil.
Whole-head, high resolution structural MRI data were acquired using an MPRAGE sequence (Mugler & Brookeman 1990) with TR/TI/TE=2500/1100/4 ms, α=8°, 350×350×350 μm resolution, total acquisition time: 16 min 2 s. Diffusion MRI QBI data were acquired using a twice-refocused balanced echo sequence 90–g1–180–g2–g3–180–g4–acq, where the 180 pulse-pair was positioned to minimized eddy current-induced image distortions (Reese et al. 2003). Two QBI datasets were acquired: a ‘low wavevector’ acquisition with b=4000 s mm−2, q=537 cm−1 and a ‘high wavevector’ acquisition with b=8000 s mm−2, q=682 cm−1. These wavevector settings correspond to diffusion spatial resolutions of, respectively, Δr=7.13 and 5.61 μm (Rayleigh criterion). Both acquisitions used the same slice prescription: 52 contiguous coronal slices (1.6 mm thick, 0 mm gap), 102.4×102.4 mm FOV, 64×64 acquisition matrix, 1.6×1.6 mm in-plane resolution. The sequence parameters for the low wavevector acquisition were TR/TE=7000/128 ms, b=4000 s mm−2, g(max)=26 mT m−1, δ(eff)=48 ms, q=537 cm−1, and for the high wavevector acquisition were TR/TE=10 000/152 ms, b=8000 s mm−2, g(max)=26 mT m−1, δ(eff)=61 ms, q=682 cm−1.
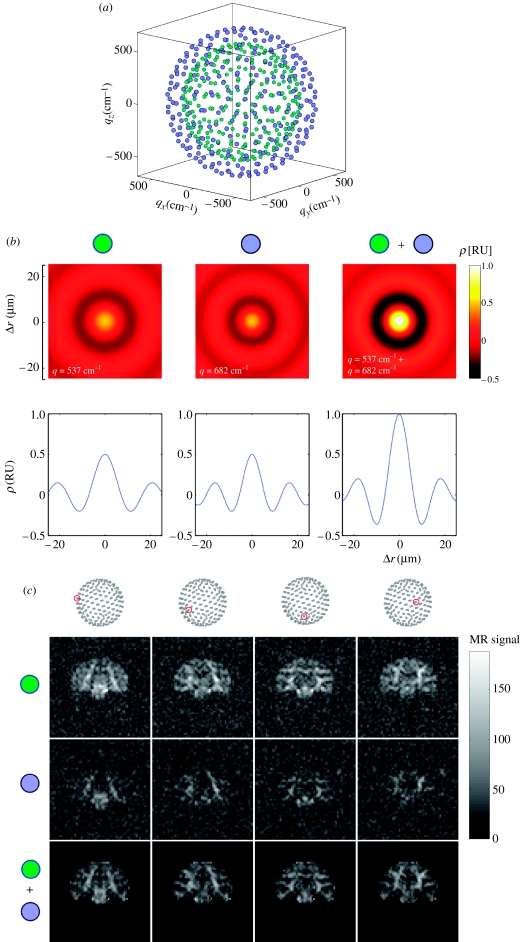
For each acquisition, 10 T2 and 252 diffusion-weighted images were acquired. The 252 diffusion gradient directions were obtained from the vertices of a fivefold regularly tessellated icosahedron projected onto the sphere. Figure 1a,b shows the q-space sampling scheme. The total acquisition time was 30 min 34 s for the low wavevector acquisition and 43 min 40 s for the high wavevector acquisition.
Figure 1.
(Opposite.) (a) q-Space sampling scheme for QBI experiment. The sampling scheme consisted of 252 directions at q=537 cm−1 (green dots) and 252 directions at q=682 cm−1 (blue dots). (b) Theoretical projection functions for the low wavevector (green), high wavevector (blue), and combined (green and blue) QBI acquisitions. The top row shows a two-dimensional plot of the projection function and the bottom row shows a one-dimensional cross-section. The projections functions are plotted in relative units (RU) with respect to the projection function for the combined acquisition. (c) Raw diffusion data for a single slice and a subset of the diffusion gradient directions. The columns show the different diffusion gradient orientations. The diffusion gradient orientation is indicated by the red dot on the dot patterns at the top. The top row shows the low wavevector (green) data, the middle row the high wavevector (blue) data, and the bottom row (green and blue) the T2-normalized combined data. Note that a brain mask was applied to the combined data. The magnetic resonance signal greyscale legend only applies to the top two rows.
(b) Reconstruction
To correct for drift between the two diffusion acquisitions in the phase-encode direction, the high wavevector volume was registered to the low wavevector volume using the FLIRT (Jenkinson & Smith 2001; Jenkinson et al. 2002) tool from FSL (http://www.fmrib.ox.ac.uk/fsl). The registration process entailed solving the transformation from the high wavevector average T2 volume to the low wavevector average T2 volume, allowing only for displacements in the phase-encode direction. The normalized mutual information cost function was used. The transform was then applied to the high wavevector volumes, and the volumes were resampled using nearest neighbour interpolation. Nearest neighbour interpolation was used, instead of sinc interpolation, to prevent MMD from arising artificially from interpolation between unimodal diffusion in neighbouring voxels. A brain mask was defined by thresholding the average of the low wavevector diffusion volumes. The diffusion signal from the high wavevector and low wavevector datasets were then masked, normalized by their respective T2 volumes, and averaged.
The diffusion ODF maps were reconstructed using the algorithm described in Tuch (2004). The diffusion ODF ψ(u) for each voxel was reconstructed by applying the matrix Funk–Radon transform (FRT) to the averaged diffusion data. The FRT was implemented using spherical radial basis function interpolation with a spherical Gaussian kernel (σ=8°). The ODF was reconstruction onto n=752 reconstruction points. The reconstruction points were obtained from the vertices of a fivefold regularly tessellated dodecahedron projected onto the sphere. The same set of points was used as the basis function centres. Each ODF was then smoothed using a spherical Gaussian kernel with σ=3°. The generalized fractional anisotropy (GFA) metric (Tuch 2004) and the peak diffusion direction u* were computed for each voxel. The GFA metric is defined as GFA=s.d.(ψ)/r.m.s.(ψ) where s.d. is the standard deviation and r.m.s. is the root mean square. The peak diffusion direction is defined as u*=arg max ψ(u).
Figure 1b shows the theoretical projection functions ρ(r) for the low, high and combined wavevector acquisitions. The projection function provides a measure of the spatial resolution of the QBI acquisition. The projection function gives the radial fall-off of the projection beam in diffusion displacement space (Tuch 2004). The combined low/high wavevector acquisition gives a diffusion displacement resolution of Δr=6.33 μm (Rayleigh criterion). Figure 1c shows the raw data and the combined data for a subset of the diffusion gradient sampling directions.
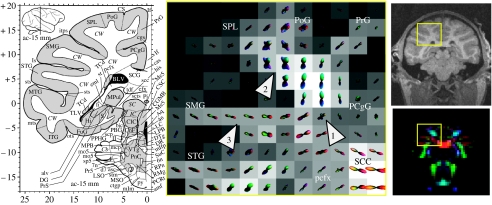
The diffusion ODF maps were rendered as fields of colour-coded spherical polar plots. For visualization purposes, the ODFs were minimum–maximum normalized and then scaled by GFA. This rescaling emphasizes the angular contrast within individual ODFs, while reducing the visual contribution from ODFs in regions of low anisotropy (Tuch 2004). The equation for the rendering mapping is given in the caption for figure 3.
Figure 3.
Diffusion ODF map of precentral gyri and the dorsolateral convexity. The ODF map was taken from the slice shown in the RGB image on the bottom right. The corresponding MPRAGE slice (resampled–700 μm isotropic) is shown on the top right. The ROI is indicated by the yellow box in the RGB image and the MPRAGE image. Note that the MPRAGE and diffusion images do not coincide exactly due to the different distortion mechanisms for the two techniques. The corresponding slice (ac=−15 mm) from the Martin & Bowden (2000) atlas is shown on the left. In the central panel, the individual ODFs are plotted as three-dimensional spherical polar plots. The radius for the spherical polar plot is given by the mapping where is the minimum–maximum normalized ODF. The colour-coding is given by the mapping and is consistent with the colour-scheme shown in figure 2a. The background greyscale image on the ODF maps is the GFA image. Arrows 1, 2 and 3 refer to locations mentioned in the text.
Anatomical labels were assigned based on the Martin & Bowden (2000) atlas and using the NeuroNames (Bowden & Martin 1995; Martin & Bowden 2000) vocabulary where applicable. The identified structures are summarized in table 2.
Table 2.
Anatomical abbreviations.
| (Abbreviations on the left; definitions on the right.) | |
| acp | posterior part of anterior commissure |
| bcc | body of corpus callosum |
| Cb | cerebellum |
| cc | corpus callosum |
| CGMB | central grey substance of midbrain |
| cic | commissure of inferior colliculus |
| cr | corona radiata (abbreviation not provided by NeuroNames vocabulary) |
| csc | commissure of superior colliculus |
| ec | external capsule |
| exc | extreme capsule |
| fx | fornix |
| ic | internal capsule |
| IC | inferior colliculus |
| itps | intraparietal sulcus |
| ls | lateral sulcus |
| mcp | middle cerebellar peduncle |
| MB | midbrain |
| opt | optic tract |
| or | optic radiation (abbreviation not provided by NeuroNames vocabulary) |
| pcfx | posterior column of fornix |
| PCgG | posterior cingulate gyrus |
| PoG | postcentral gyrus |
| Pons | pons |
| PrG | precentral gyrus |
| Pul | pulvinar |
| SC | superior colliculus |
| scc | splenium of corpus callosum |
| SFG | superior frontal gyrus |
| slf | superior longitudinal fasciculus |
| SMG | supramarginal gyrus |
| sovc | semioval centre |
| SPL | superior parietal lobule |
| STG | superior temporal gyrus |
| tz | trapezoid body |
| xscp | decussation of superior cerebellar peduncle |
3. Results
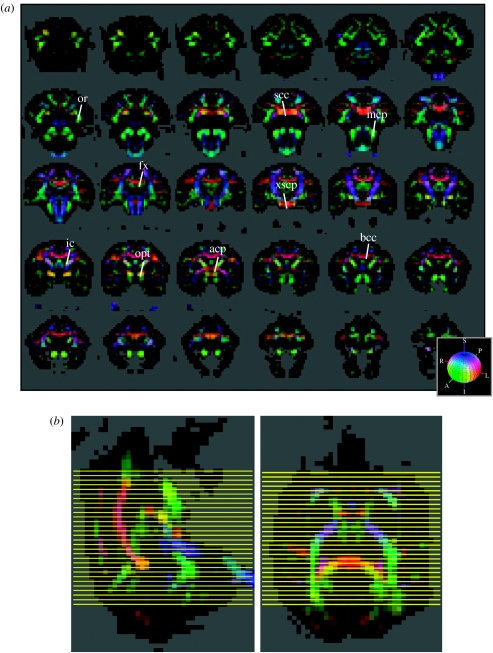
Colour-coded peak diffusion orientation maps of the macaque are shown in figure 2. The peak diffusion orientation maps show the direction of maximal diffusion at each voxel location. The maps delineate major WM structures including the internal capsule (ic), the splenium of the corpus callosum (scc), the body of the corpus callosum (bcc), the fornix (fx), the posterior part of the anterior commissure (acp), the middle cerebellar peduncle (mcp), the decussation of the superior cerebellar peduncle (xscp), the optic radiation (or) and the optic tract (opt). Detailed diffusion ODF maps from select regions are shown in figures 3–7.
Figure 2.
(a) Colour-coded diffusion orientation maps. Thirty contiguous coronal slices (out of a total of 52) are shown. The slices are ordered caudal to rostral. The colour indicates the peak diffusion direction u*, with red indicating medial–lateral, green anterior–posterior, and blue superior–inferior. The colour scheme is also shown in the RGB sphere at bottom right. The brightness is scaled by the degree of GFA. The colour mapping is given by the formula (red, green, blue)=GFA×|u*| where u* is the direction of peak diffusion. The anatomical labels are described in the text and in table 2. (b) Sagittal (top) and axial (bottom) views of the RGB maps showing the caudo-rostral level (yellow lines) from which the 30 slices in (b) were taken.
Figure 4.
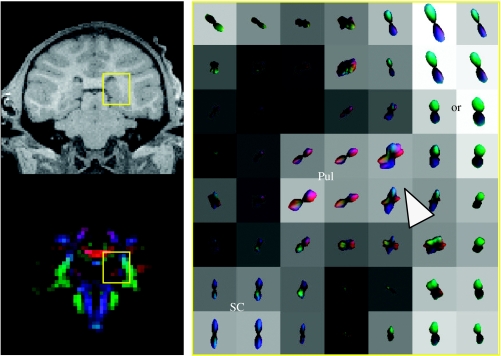
Diffusion ODF map of thalamocortical projections from the pulvinar.
Figure 5.
Intravoxel structure in WM underlying the superior temporal gyrus.
Figure 6.
Diffusion ODF map of midbrain and pontine decussation. See §3 for explanations of the arrows.
Figure 7.
Fibre crossing in the centrum semiovale. See §3 for explanations of the arrows.
Figure 3 (central panel) shows a diffusion ODF map of precentral gyrus (PrG) and the dorsolateral convexity which includes, respectively, projections to the motor, parietal and temporal cortices. MMD can be seen at the intersection (figure 3, arrow 1) between the projections of the scc (red) and the superior–inferior directed fibres (blue–green) connecting to the motor cortex, and where the projections segregate into the superior parietal lobule (SPL) and postcentral gyrus (PoG; figure 3, arrow 2). MMD is also seen in the WM beneath the supramarginal gyrus (SMG; figure 3, arrow 3), including a lateral (red) component along the gyral axis and a transverse anterior–posterior component (bright green). The parietal lobule has dense reciprocal connections with visual association, cingulate, premotor and prefrontal cortical areas (Petrides & Pandya 1984). The intersection of intrinsic and extrinsic parietal lobule fibres is demonstrated in the ODF map (figure 3, arrow 2). Extrinsic fibres from this area of the parietal lobule, specifically the SPL and dorsal bank of the intraparietal sulcus (itps), contribute to the superior longitudinal fasciculus (slf), fronto-occipital fasciculus and bcc.
Figure 4 shows the thalamocortical projections from the pulvinar (Pul). MMD is seen where the projections from the Pul (red) turn from a medial–lateral orientation (red) to a superior–inferior orientation (arrow) to project to the parietal cortex. The Pul sends projection fibres to the somatosensory and visual association areas in the parietal lobe (Schmahmann & Pandya 1990). The fibres can be seen passing the or.
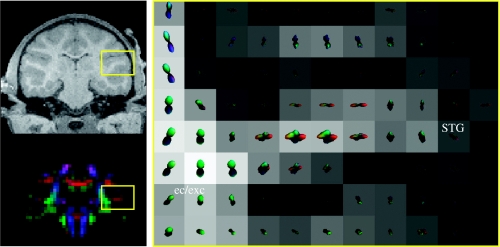
MMD can also be seen in subcortical WM. Figure 5 shows MMD in the subcortical WM underlying superior temporal gyrus (STG). Similar to SMG (figure 3, arrow 3), a medial–lateral component (red) directed along the gyral axis is apparent, as well as a transverse component in the anterior–posterior (green) direction. This anterior–posterior component is most likely due to temporal–prefrontal projections passing through STG (Seltzer & Pandya 1989).
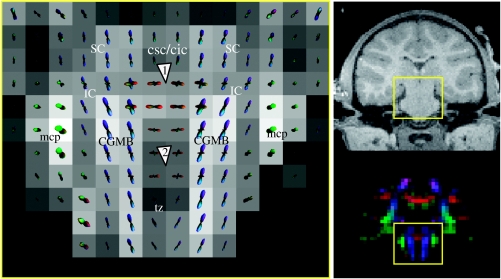
Figure 6 shows a diffusion ODF map of the midbrain (MB) and the pontine decussation. While the T1-weighted image shows no contrast between the different MB structures, the diffusion ODF map clearly reveals the superior colliculus (SC), the inferior colliculus (IC) and the central grey substance of MB (CGMB; blue). The mcp (green) projecting to the cerebellum (Cb) is also apparent. The oblique-oriented fibres of the trapezoid body (tz; blue–purple) are seen at the level of the pons (Pons), inferior to the CGMB. Intravoxel fibre crossing is seen where the fibres from the commissure for the superior colliculus (csc; red) and the commissure for the inferior colliculus (cic; red) intersect the fibres emanating from the CGMB (figure 6, arrow 1). Additionally, more ventro-caudal horizontally crossing fibres are seen at the level of the Pons (figure 6, arrow 2). The lateral component here may reflect connections between the CGMBs. At the level of the csc and cic, the lateral architecture is dominant, and at the level of CGMB, the superior–inferior and lateral fibres contribute equally.
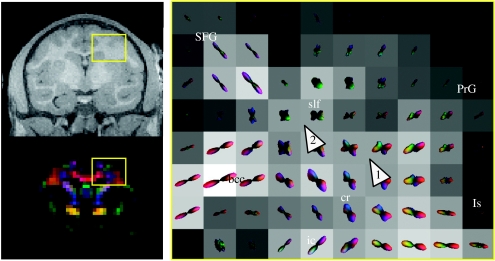
Figure 7 shows fibres crossing in the centrum semiovale (semioval centre, sovc). The diffusion ODF map shows crossing between the corona radiata (cr; blue), slf (green) and the transcallosal projections from bcc (red). In Figure 7, arrow 1 shows the crossing between the cr and the transcallosal fibres projecting to PrG. Arrow 2 shows the crossing between transcallosal projections and the slf.
4. Discussion
QBI resolved composite subvoxel architecture in macaque WM. Intravoxel structure was resolved in a number of anatomic regions including the centrum semiovale, the pontine decussation, the pulvinar, and temporal subcortical WM. The intravoxel fibre crossings were consistent with the known association, projection and callosal fibre architecture of the macaque brain.
Notwithstanding QBI's ability to resolve intravoxel architecture, there still remain a number of obstacles to accurate reconstruction of WM pathways with QBI. One considerable obstacle is that a number of different fibre arrangements are consistent with an observed diffusion function. For example, for a diffusion ODF with two peaks, the two peaks may be due to two fibres crossing, a single fibre bundle segregating into two clusters, two fibres ‘kissing’ (Basser et al. 2000) or a single fibre bending. This ambiguity is due to the reflective symmetry of the ODF, that is, the diffusion probability in any given direction is the same in the opposite direction.
This topological ambiguity is apparent in the diffusion ODF maps. For example, in figure 4 it is unclear if the observed MMD in the Pul is due to crossing lateral and ascending fibres or because a single fibre population has rapidly turned from a medial–lateral orientation to a superior–inferior orientation. It is worth noting that bending fibre bundles can only produce MMD if the fibre curvature is variable, since a fibre bundle with constant curvature would simply exhibit a single broad peak. Alternatively, MMD could also arise from multiple bending fibres with different orientations.
Figure 3 (arrow 2) also shows the degeneracy between bending and crossing fibres. It is not clear if the MMD arises from the projections segregating into SPL and PoG, or from intrinsic connections within and between the gyri (Pandya & Seltzer 1982; Seltzer & Pandya 1986). Similarly, for the MMD seen in figure 3 (arrow 3) and figure 5, it is not clear if the transverse diffusion component seen in SMG and STG, respectively, is due to WM fibres bending rapidly to insert into the gyral wall or due to WM association fibres passing through the gyrus (Seltzer & Pandya 1989). The complexity of the WM architecture at the gyral wall poses a substantial challenge for diffusion tractography. Two open questions include whether this topological ambiguity can be resolved with diffusion imaging, and what the implications of this ambiguity are for tractography reconstructions.
The interpretation of diffusion tract solutions as anatomical tracts is based on the assumption that the diffusion ODF is closely related to the underlying fibre ODF. However, the relationship between the diffusion and fibre ODFs is not entirely clear. The relationship is obscured by the lack of knowledge about the physiological mechanism for diffusion anisotropy in WM (Beaulieu 2002). Clarifying the relationship between the diffusion and fibre ODFs, and incorporating this relationship into tractography algorithms, would help support the interpretation of the diffusion tract reconstructions as fibre pathways instead of diffusion pathways.
Given the above concerns, validation of the diffusion connectivity method against established tracer techniques will be essential. Histological validation will be particularly necessary for the three-dimensional tract reconstructions derived from diffusion imaging. The present study has demonstrated the feasibility of acquiring QBI in the macaque, and that the technique can resolve subvoxel WM architecture. Future work will focus on validating the diffusion connectivity maps against histological tracer methods.
Acknowledgments
The authors are grateful to Thomas Benner and Timothy Reese for developing the diffusion MRI protocol, and to Larry Wald for constructing the MRI coil. The authors acknowledge support from NINDS NS46532, NCRR RR14075, GlaxoSmithKline, the Athinoula A. Martinos Foundation, the Mental Illness and Neuroscience Discovery (MIND) Institute, the National Alliance for Medical Imaging Computing (NIBIB EB005149), which is funded through the NIH Roadmap for Medical Research, the Human Frontiers Science Program (RGY 14/2002) and Deutsche Forschungsgemeinschaft (GRK320 and KO 1560/6-2). The authors would also like to thank the organizers of the 2004 Brain Connectivity Workshop for providing a stimulating collaborative environment.
Footnotes
One contribution of 21 to a Theme Issue ‘Multimodal neuroimaging of brain connectivity’.
References
- Basser P.J, Mattiello J, LeBihan D. MR diffusion tensor spectroscopy and imaging. Biophys. J. 1994;66:259–267. doi: 10.1016/S0006-3495(94)80775-1. [DOI] [PMC free article] [PubMed] [Google Scholar]
- Basser P.J, Pajevic S, Pierpaoli C, Duda J, Aldroubi A. In vivo fibre tractography using DT-MRI data. Magn. Reson. Med. 2000;44:625–632. doi: 10.1002/1522-2594(200010)44:4<625::aid-mrm17>3.0.co;2-o. [DOI] [PubMed] [Google Scholar]
- Beaulieu C. The basis of anisotropic water diffusion in the nervous system—a technical review. NMR Biomed. 2002;15:438–455. doi: 10.1002/nbm.782. [DOI] [PubMed] [Google Scholar]
- Behrens T.E, et al. Non-invasive mapping of connections between human thalamus and cortex using diffusion imaging. Nat. Neurosci. 2003;6:750–757. doi: 10.1038/nn1075. [DOI] [PubMed] [Google Scholar]
- Bowden D.M, Martin R.F. Neuronames brain hierarchy. NeuroImage. 1995;2:63–83. doi: 10.1006/nimg.1995.1009. [DOI] [PubMed] [Google Scholar]
- Callaghan P.T. Oxford University Press; Oxford: 1993. Principles of nuclear magnetic resonance microscopy. [Google Scholar]
- Chenevert T.L, Brunberg J.A, Pipe J.G. Anisotropic diffusion in human white matter: demonstration with MR techniques in vivo. Radiology. 1990;177:401–405. doi: 10.1148/radiology.177.2.2217776. [DOI] [PubMed] [Google Scholar]
- Chien D, Buxton R.B, Kwong K.K, Brady T.J, Rosen B.R. MR diffusion imaging of the human brain. J. Comput. Assist. Tomogr. 1990;14:514–520. doi: 10.1097/00004728-199007000-00003. [DOI] [PubMed] [Google Scholar]
- Conturo T.E, Lori N.F, Cull T.S, Akbudak E, Snyder A.Z, Shimony J.S, McKinstry R.C, Burton H, Raichle M.E. Tracking neuronal fibre pathways in the living human brain. Proc. Natl Acad. Sci. USA. 1999;96:10 422–10 427. doi: 10.1073/pnas.96.18.10422. [DOI] [PMC free article] [PubMed] [Google Scholar]
- Frank L. Anisotropy in high angular resolution diffusion-weighted MRI. Magn. Reson. Med. 2001;45:935–939. doi: 10.1002/mrm.1125. [DOI] [PubMed] [Google Scholar]
- Galuske R.A, Schlote W, Bratzke H, Singer W. Interhemispheric asymmetries of the modular structure in human temporal cortex. Science. 2000;289:1946–1949. doi: 10.1126/science.289.5486.1946. [DOI] [PubMed] [Google Scholar]
- Honig M.G, Hume R.I. Dil and diO: versatile fluorescent dyes for neuronal labelling and pathway tracing. Trends Neurosci. 1989;12:333–335. see also pp. 340–341. [PubMed] [Google Scholar]
- Jansons K.M, Alexander D.C. Persistent angular structure: new insights from diffusion magnetic resonance imaging data. Inverse Probl. 2003;19:1031–1046. doi: 10.1007/978-3-540-45087-0_56. [DOI] [PubMed] [Google Scholar]
- Jenkinson M, Smith S. A global optimisation method for robust affine registration of brain images. Med. Image Anal. 2001;5:143–156. doi: 10.1016/s1361-8415(01)00036-6. [DOI] [PubMed] [Google Scholar]
- Jenkinson M, Bannister P, Brady M, Smith S. Improved optimization for the robust and accurate linear registration and motion correction of brain images. NeuroImage. 2002;17:825–841. doi: 10.1016/s1053-8119(02)91132-8. [DOI] [PubMed] [Google Scholar]
- Jezzard P, Clare S. Sources of distortion in functional MRI data. Hum. Brain Mapp. 1999;8:80–85. doi: 10.1002/(SICI)1097-0193(1999)8:2/3<80::AID-HBM2>3.0.CO;2-C. [DOI] [PMC free article] [PubMed] [Google Scholar]
- Kobbert C, Apps R, Bechmann I, Lanciego J.L, Mey J, Thanos S. Current concepts in neuroanatomical tracing. Prog. Neurobiol. 2000;62:327–351. doi: 10.1016/s0301-0082(00)00019-8. [DOI] [PubMed] [Google Scholar]
- Koch M.A, Norris D.G, Hund-Georgiadis M. An investigation of functional and anatomical connectivity using magnetic resonance imaging. NeuroImage. 2002;16:241–250. doi: 10.1006/nimg.2001.1052. [DOI] [PubMed] [Google Scholar]
- Kotter R. Online retrieval, processing, and visualization of primate connectivity data from the CoCoMac database. Neuroinformatics. 2004;2:127–144. doi: 10.1385/NI:2:2:127. [DOI] [PubMed] [Google Scholar]
- Lin C.P, Tseng W.Y, Cheng H.C, Chen J.H. Validation of diffusion tensor magnetic resonance axonal fibre imaging with registered manganese-enhanced optic tracts. NeuroImage. 2001;14:1035–1047. doi: 10.1006/nimg.2001.0882. [DOI] [PubMed] [Google Scholar]
- Liu C, Bammer R, Acar B, Moseley M.E. Characterizing non-Gaussian diffusion by using generalized diffusion tensors. Magn. Reson. Med. 2004;51:924–937. doi: 10.1002/mrm.20071. [DOI] [PubMed] [Google Scholar]
- Lori N.F, Akbudak E, Shimony J.S, Cull T.S, Snyder A.Z, Guillory R.K, Conturo T.E. Diffusion tensor fibre tracking of human brain connectivity: acquisition methods, reliability analysis and biological results. NMR Biomed. 2002;15:494–515. doi: 10.1002/nbm.779. [DOI] [PubMed] [Google Scholar]
- Martin R.F, Bowden D.M. Elsevier Science; Amsterdam: 2000. Primate brain maps: structure of the macaque brain. [Google Scholar]
- Mori S, Van Zijl P.C. Fibre tracking: principles and strategies—a technical review. NMR Biomed. 2002;15:468–480. doi: 10.1002/nbm.781. [DOI] [PubMed] [Google Scholar]
- Mori S, Crain B.J, Chacko V.P, Van Zijl P.C. Three-dimensional tracking of axonal projections in the brain by magnetic resonance imaging. Ann. Neurol. 1999;45:265–269. doi: 10.1002/1531-8249(199902)45:2<265::aid-ana21>3.0.co;2-3. [DOI] [PubMed] [Google Scholar]
- Moseley M.E, Kucharczyk J, Asgari H.S, Norman D. Anisotropy in diffusion-weighted MRI. Magn. Reson. Med. 1991;19:321–326. doi: 10.1002/mrm.1910190222. [DOI] [PubMed] [Google Scholar]
- Mugler J.Pr, Brookeman J.R. Three-dimensional magnetization-prepared rapid gradient-echo imaging (3D MPRAGE) Magn. Reson. Med. 1990;15:152–157. doi: 10.1002/mrm.1910150117. [DOI] [PubMed] [Google Scholar]
- Ozarslan E, Mareci T.H. Generalized diffusion tensor imaging and analytical relationships between diffusion tensor imaging and high angular resolution diffusion imaging. Magn. Reson. Med. 2003;50:955–965. doi: 10.1002/mrm.10596. [DOI] [PubMed] [Google Scholar]
- Pandya D.N, Seltzer B. Intrinsic connections and architectonics of posterior parietal cortex in the rhesus monkey. J. Comp. Neurol. 1982;204:196–210. doi: 10.1002/cne.902040208. [DOI] [PubMed] [Google Scholar]
- Parker G.J, Alexander D.C. Probabilistic Monte Carlo based mapping of cerebral connections utilising whole-brain crossing fiber information. Inf. Process. Med. Imaging. 2003;18:684–695. doi: 10.1007/978-3-540-45087-0_57. [DOI] [PubMed] [Google Scholar]
- Parker G.J, et al. Initial demonstration of in vivo tracing of axonal projections in the macaque brain and comparison with the human brain using diffusion tensor imaging and fast marching tractography. NeuroImage. 2002;15:797–809. doi: 10.1006/nimg.2001.0994. [DOI] [PubMed] [Google Scholar]
- Pautler R.G, Silva A.C, Koretsky A.P. In vivo neuronal tract tracing using manganese-enhanced magnetic resonance imaging. Magn. Reson. Med. 1998;40:740–748. doi: 10.1002/mrm.1910400515. [DOI] [PubMed] [Google Scholar]
- Petrides M, Pandya D.N. Projections to the frontal cortex from the posterior parietal region in the rhesus monkey. J. Comp. Neurol. 1984;228:105–116. doi: 10.1002/cne.902280110. [DOI] [PubMed] [Google Scholar]
- Pierpaoli C, Jezzard P, Basser P.J, Barnett A, Di Chiro G. Diffusion tensor MR imaging of the human brain. Radiology. 1996;201:637–648. doi: 10.1148/radiology.201.3.8939209. [DOI] [PubMed] [Google Scholar]
- Pierpaoli C, Barnett A, Pajevic S, Chen R, Penix L.R, Virta A, Basser P. Water diffusion changes in Wallerian degeneration and their dependence on white matter architecture. NeuroImage. 2001;13:1174–1185. doi: 10.1006/nimg.2001.0765. [DOI] [PubMed] [Google Scholar]
- Reese T.G, Heid O, Weisskoff R.M, Wedeen V.J. Reduction of eddy-current-induced distortion in diffusion MRI using a twice-refocused spin echo. Magn. Reson. Med. 2003;49:177–182. doi: 10.1002/mrm.10308. [DOI] [PubMed] [Google Scholar]
- Reiner A, Veenman C.L, Medina L, Jiao Y, Del Mar N, Honig M.G. Pathway tracing using biotinylated dextran amines. J. Neurosci. Methods. 2000;103:23–37. doi: 10.1016/s0165-0270(00)00293-4. [DOI] [PubMed] [Google Scholar]
- Rye D.B. Tracking neural pathways with MRI. Trends Neurosci. 1999;22:373–374. doi: 10.1016/s0166-2236(99)01468-x. [DOI] [PubMed] [Google Scholar]
- Saleem K.S, Pauls J.M, Augath M, Trinath T, Prause B.A, Hashikawa T, Logothetis N.K. Magnetic resonance imaging of neuronal connections in the macaque monkey. Neuron. 2002;34:685–700. doi: 10.1016/s0896-6273(02)00718-3. [DOI] [PubMed] [Google Scholar]
- Schmahmann J.D, Pandya D.N. Anatomical investigation of projections from thalamus to posterior parietal cortex in the rhesus monkey: a WGA–HRP and fluorescent tracer study. J. Comp. Neurol. 1990;295:299–326. doi: 10.1002/cne.902950212. [DOI] [PubMed] [Google Scholar]
- Seltzer B, Pandya D.N. Posterior parietal projections to the intraparietal sulcus of the rhesus monkey. Exp. Brain Res. 1986;62:459–469. doi: 10.1007/BF00236024. [DOI] [PubMed] [Google Scholar]
- Seltzer B, Pandya D.N. Intrinsic connections and architectonics of the superior temporal sulcus in the rhesus monkey. J. Comp. Neurol. 1989;290:451–471. doi: 10.1002/cne.902900402. [DOI] [PubMed] [Google Scholar]
- Stephan K.E, Kamper L, Bozkurt A, Burns G.A, Young M.P, Kotter R. Advanced database methodology for the collation of connectivity data on the Macaque brain (CoCoMac) Phil. Trans. R. Soc. B. 2001;356:1159–1186. doi: 10.1098/rstb.2001.0908. [DOI] [PMC free article] [PubMed] [Google Scholar]
- Tournier J.D, Calamante F, Gadian D.G, Connelly A. Direct estimation of the fibre orientation density function from diffusion-weighted MRI data using spherical deconvolution. NeuroImage. 2004;23:1176–1185. doi: 10.1016/j.neuroimage.2004.07.037. [DOI] [PubMed] [Google Scholar]
- Tuch D.S. Q-ball imaging. Magn. Reson. Med. 2004;52:1358–1372. doi: 10.1002/mrm.20279. [DOI] [PubMed] [Google Scholar]
- Tuch D.S, Reese T.G, Wiegell M.R, Makris N, Belliveau J.W, Wedeen V.J. High angular resolution diffusion imaging reveals intravoxel white matter fibre heterogeneity. Magn. Reson. Med. 2002;48:577–582. doi: 10.1002/mrm.10268. [DOI] [PubMed] [Google Scholar]
- Tuch D.S, Reese T.G, Wiegell M.R, Wedeen V.J. Diffusion MRI of complex neural architecture. Neuron. 2003;40:885–895. doi: 10.1016/s0896-6273(03)00758-x. [DOI] [PubMed] [Google Scholar]
- Vercelli A, Repici M, Garbossa D, Grimaldi A. Recent techniques for tracing pathways in the central nervous system of developing and adult mammals. Brain Res. Bull. 2000;51:11–28. doi: 10.1016/s0361-9230(99)00229-4. [DOI] [PubMed] [Google Scholar]
- Wiegell M.R, Larsson H.B, Wedeen V.J. Fibre crossing in human brain depicted with diffusion tensor MR imaging. Radiology. 2000;217:897–903. doi: 10.1148/radiology.217.3.r00nv43897. [DOI] [PubMed] [Google Scholar]


