Abstract
In this study, we examined the possible involvement of progenitor cells in the carcinogenesis of human hepatocellular carcinoma (HCC) using tissue specimens and cell lines. We used ATP-binding cassette transporter ABCG2 as a progenitor cell marker. Immunohistochemically, ABCG2+ hepatocytes were observed in the periportal areas of the dysplastic nodule, and ABCG2+ cancer cells were also scattered or focally clustered in HCC. We sorted the cultured HCC cells (HuH7 and PLC5) into ABCG2+ and ABCG2− subpopulations and then subcultured them for 4 weeks. ABCG2+ cells could generate ABCG2+ and ABCG2− progenies during subculture, whereas ABCG2− cells bore only ABCG2− cells, suggesting that a cancer cell hierarchy with reference to ABCG2 exists in HCC cells and that ABCG2+ cells reside at the higher rank in that hierarchy. Interestingly, other progenitor cell markers including cytokeratin 19 and α-fetoprotein were mainly expressed in ABCG2+ subpopulations. Conversely, albumin expression was more intense in ABCG2− cells. In addition, the expression patterns of transcription factors (GATA6, CCAAT/enhancer-binding protein α, and CCAAT/enhancer-binding protein β) in ABCG2+ and ABCG2− cells resembled those during normal liver development. In conclusion, this study suggests that cancer cells with ABCG2 expression might play a central role in hepatocarcinogenesis and the maintenance of the cancer cell hierarchy of human HCC.
Cancers arise from a series of mutations that occur in a few or even single founder cells. There are two theories with regard to tumor-founding cells: the mature cell origin theory and the progenitor cell origin theory.1,2 It has been widely recognized that most human tumors derive from differentiated cells with the accumulation of genetic mutations (the mature cell origin theory). Conversely, the progenitor cell origin theory has been applied to only a few tumors, such as teratoma and leukemia, until recently.3 From the viewpoint of tumor cell proliferation, there are two other hypothetical models: the stochastic model and the hierarchical model.1,2 The stochastic model proposes that all of the cells in a tumor have a similar tumorigenic potential and can function as a new tumor-founding cell. In contrast, the hierarchical model implies that only a small subpopulation of cells within the tumor have significant proliferation capacity and the ability to generate new tumors, with the remainder of the tumor cells representing differentiating or terminally differentiated cells. The latter hypothesis fits with the cancer-stem cell theory.4,5 That is, cancer stem cells behave as tumor-forming cells and are located at a higher rank in the tumor cell hierarchy.4,5
Previously, the progenitor cell origin theory and hierarchical model were suggested for solid tumors by some investigators, although many investigations as to the carcinogenesis of hepatocellular carcinoma (HCC) have been performed to date based on the mature cell origin theory. Most HCCs develop via multistep carcinogenesis in cirrhotic or precirrhotic livers with chronic viral hepatitis or other liver diseases. The accumulation of genetic abnormalities in mature hepatocytes has been estimated to be a key event in the multistep carcinogenesis of HCC via dysplastic nodules in cirrhotic or precirrhotic livers.6,7 However, recent great advances in stem cell biology are providing several lies of evidence suggesting that the progenitor cell origin theory and the hierarchical model could be applied to solid tumors.8,9 The possible existence of cancer stem cells has been shown not only in leukemia but also in solid tumors such as brain tumors and breast cancer.8,9,10,11,12,13
In 1997, Goodell and colleagues14 pioneered a new way to identify putative adult stem cells. When bone marrow-derived cells are incubated with Hoechst dye 33342 and then analyzed by dual-wavelength flow cytometry, a small population of cells does not accumulate an appreciable amount of dye and is identified as a Hoechstlow side population (SP). SP cells are highly enriched in hematopoietic stem cells.14 Since its initial application in hematopoietic stem cells, the SP technique has been adapted to identify putative stem cells in multiple normal tissues and also cancer stem cells in some neoplastic tissues.15,16,17,18,19,20 It is now believed that the ATP-binding cassette transporter G2 (ABCG2) is essential to pump out Hoechst dye and maintain an SP phenotype of stem cells and cancer stem cells.21,22
Recently, Haraguchi and colleagues23 and Chiba and colleagues24 reported that SP cells could be purified from human HCC cell lines. SP cells from HCC showed a higher proliferative activity and anti-apoptotic properties compared with non-SP cells.24 SP cells could generate both SP and non-SP progenies during subculture, whereas non-SP cells bore only non-SP cells. In addition, xenograft transplant experiments revealed that SP cells had a higher tumorigenic potential compared with non-SP cells, which could not develop any new tumors. Based on those culture studies, those authors suggested that cancer stem cells might also exist in human HCC and that they play a central role in hepatocarcinogenesis.23,24 However, most investigations of cancer stem cells or an SP phenotype so far are performed using culture cell lines. Therefore, it has been ill-defined how cancer cells with an SP phenotype or expressing ABCG2 behave in tumorigenesis in situ.
In this study, we conducted histological and culture studies of HCC to evaluate the applicability of the progenitor cell origin theory and the hierarchical model in the carcinogenesis of human HCC. We used ABCG2 as a progenitor cell marker instead of an SP phenotype, because an SP phenotype, a functional marker, could not be directly evaluated in the histological specimens.
Materials and Methods
Histological Studies
Case Selection
A total of 40 cases of normal liver, dysplastic nodules, and HCC were obtained from the hepatobiliary disease files of the Division of Pathology, Kanazawa University Hospital in Japan between 2002 and 2005. This study consisted of five cases of normal liver, 10 cases of low-grade dysplastic nodule, 10 cases of high-grade dysplastic nodule, and 15 cases of HCC. All cases used in this study were surgically resected cases. Normal liver tissues used in this study were background liver tissues of metastatic colon cancers. Ages, genders, nodule sizes, and background liver diseases in each group are shown in Table 1. Dysplastic nodules were defined as nodular lesions showing a high cellular density, containing portal tracts within them, and not surrounded by fibrous capsules.25,26 Low-grade or high-grade was classified histologically. A low-grade dysplastic nodule was defined as showing a high cellular density (less than 1.5 times) compared with the background liver, a slightly increased nuclear/cytoplasmic ratio and minimal nuclear atypia.25,26 High-grade dysplastic nodules showed high cellular density (usually more than 1.5 times), a high nuclear/cytoplasmic ratio, and mild to moderate nuclear atypia (hyperchromasia, nuclear irregularities, or coarse chromatin).25,26 Invasion into intranodular portal tracts, which is an early feature of HCC, was not observed in any dysplastic nodules.26 All cases of HCC used in this study were well to moderately differentiated conventional HCC showing trabecular (10 cases), pseudo-glandular (two cases), solid (two cases), or scirrhous growth (one case). All HCCs, except one case of the scirrhous type, were surrounded by fibrous capsules.
Table 1.
Ages, Genders, Nodular Sizes, Etiologies of Liver Diseases, and Histological Stages of Background Liver in the Cases Used in This Study
| Liver specimen | N | Age* | M/F | Size (cm)* | Etiologies | Background liver |
|---|---|---|---|---|---|---|
| Normal liver | 5 | 62.2 (56 to 72) | 3/2 | |||
| Low-grade dysplastic nodule | 10 | 61.0 (42 to 71) | 8/2 | 1.6 (1.0 to 2.2) | HBV (3), HCV (7) | Cirrhosis (5), precirrhosis (4), CH (1) |
| High-grade dysplastic nodule | 10 | 63.2 (43 to 72) | 7/3 | 1.7 (1.2 to 2.3) | HBV (2), HCV (8) | Cirrhosis (6), precirrhosis (4) |
| Hepatocellular carcinoma | 15 | 59.8 (45 to 74) | 11/4 | 3.5 (2.2 to 5.2) | HBV(5), HCV (8), alcohol (2) | Cirrhosis (10), precirrhosis (3), CH (2) |
Data are shown in average (range).
N, number of cases; M, male; F, female; CH, chronic hepatitis.
Expression of Hepatic Progenitor Cell Markers in HCC Specimens
Total RNA was extracted from the frozen section of 7 of 15 cases of HCC and two of five cases of normal liver using the RNeasy mini kit (Qiagen, Valencia, CA). Total RNA was dissolved in 50 μl of distilled water containing 0.1% diethylpyrocarbonate and quantitated using a spectrophotometer at OD260. Isolated RNA was used for the following reverse transcription-polymerase chain reaction (RT-PCR). We performed RT-PCR for ABCG2, muscarinic cholinergic receptor type 3 (M3R), cytokeratin 19 (CK19), c-kit, CD34, CD56, and cytokeratin 14 (CK14), all of which were previously reported as hepatic progenitor cell markers,27,28,29,30,31,32 and β-actin. The oligonucleotide sequences, numbers of cycles, and annealing temperatures of these primers are shown in Table 2. After PCR, 5-μl aliquots of the products were subjected to 1.5% or 2.0% agarose gel electrophoresis and stained with ethidium bromide.
Table 2.
Sequences, Annealing Temperatures, Cycle Times, and Product Sizes of PCR Primers
| Molecule | F/R | Sequence | Temperature (°C) | Cycle | Product size (bp) |
|---|---|---|---|---|---|
| ABCG2 | F | 5′-CACCTTATTGGCCTCAGGAA-3′ | 52 | 35 | 209 |
| R | 5′-CCTGCTTGGAAGGCTCTATG-3′ | ||||
| M3R | F | 5′-CCTTCAAGGAAGCCACTCTG-3′ | 52 | 35 | 219 |
| R | 5′-AGCCCAGATTCCAAAAGGTT-3′ | ||||
| CK19 | F | 5′-TCCCGCGACTACAGCCACTACTACACGACC-3′ | 52 | 35 | 396 |
| R | 5′-TTGGCTTCGCATGTCACTCAGGAT-3′ | ||||
| c-kit | F | 5′-AAAGTATAGGTTTAGCCTCCTTCGCA-3′ | 54 | 35 | 608 |
| R | 5′-CAAATGGTTACTTCCAGATAACGGC-3′ | ||||
| CD34 | F | 5′-CACCCTGTGTCTCAACATGG-3′ | 51 | 33 | 190 |
| R | 5′-GGCTTCAAGGTTGTCTCTGG-3′ | ||||
| CD56 | F | 5′-TCCATCACCTGGAGGACTTC-3′ | 52 | 37 | 210 |
| R | 5′-CTTTGGGGCATATTGCACTT-3′ | ||||
| CK14 | F | 5′-TTCTGAACGAGATGCGTGAC-3′ | 53 | 35 | 224 |
| R | 5′-GTTCTCCAGGGATGCTTTCA-3′ | ||||
| AFP | F | 5′-GGGAGCGGCTGACATTATTA-3′ | 52 | 37 | 231 |
| R | 5′-TCTTGCTTCATCGTTTGCAG-3′ | ||||
| Albumin | F | 5′-TGCTTGAATGTGCTGATGACAGGG-3′ | 52 | 37 | 161 |
| R | 5′-AAGGCAAGTCAGCAGGCATCTCATC-3′ | ||||
| GATA6 | F | 5′-GCCAACTGTCACACCACAAC-3′ | 53 | 35 | 216 |
| R | 5′-TGGAGTCATGGGAATGGAAT-3′ | ||||
| C/EBPα | F | 5′-TCACCGCTCCAATGCCTAC-3′ | 53 | 35 | 210 |
| R | 5′-CCCTATGTTTCCACCCCTTTC-3′ | ||||
| C/EBPβ | F | 5′-CTTCAGCCCGTACCTGGAG-3′ | 53 | 35 | 136 |
| R | 5′-GGAGAGGAAGTCGTGGTGC-3′ | ||||
| β-Actin | F | 5′-CAAGAGATGGCCACGGCTGCT-3′ | 55 | 25 | 334 |
| R | 5′-TCCTTCTGCATCCTGTCGGCA-3′ |
F, forward; R, reverse.
Single Immunostaining of ABCG2, M3R, and CK19
All 40 cases of normal liver, dysplastic nodule, and HCC were used for single immunostaining. Immunostainings of ABCG2, M3R, and CK19 on formalin-fixed, paraffin-embedded specimens were performed using a mouse monoclonal antibody against human ABCG2 (clone BXP-21; Chemicon International, Temecula, CA), a rabbit polyclonal antibody against human M3R (clone H-210; Santa Cruz Biotechnology, Santa Cruz, CA), and a rabbit polyclonal antibody against human CK19 (clone ab15463; Abcam, Cambridge, UK), respectively. Deparaffinized sections were microwaved in citrate buffer (pH 6.0) for 20 minutes. After blocking the endogenous peroxidase, the sections were incubated in protein block solution (Dako Cytomation, Glostrup, Denmark) for 20 minutes and then incubated overnight at 4°C with each primary antibody. These sections were incubated for 1 hour at room temperature with goat anti-mouse immunoglobulins, which were conjugated to peroxidase-labeled polymer (Envision+; Dako Cytomation). 3,3′-Diaminobenzidine tetrahydrochloride was used as the chromogen, followed by light counterstaining with hematoxylin. We counted 1000 cells to quantify the mitotic cell ratios of ABCG2+, ABCG2−, M3R+, or M3R− cells in each HCC specimen with the expression of these molecules. Negative controls were evaluated by substituting the primary antibody with similarly diluted nonimmunized mouse serum.
Dual-Fluorescent Immunostaining of ABCG2/M3R and ABCG2/CK19
Two cases of normal liver, two cases of low-grade dysplastic nodules, three cases of high-grade dysplastic nodules, and four cases of HCCs, all of which expressed both ABCG2 and M3R or both ABCG2 and CK19 on single immunostaining, were used for dual-fluorescent immunostaining. Dual-fluorescent stainings of ABCG2/M3R and ABCG2/CK19 were performed to assess the location of cancer cells expressing ABCG2, M3R, and CK19 in each dysplastic or neoplastic nodule. The deparaffinized sections were microwaved in citrate buffer (pH 6.0) for 20 minutes and were incubated in protein block solution (Dako Cytomation) for 20 minutes. Specimens were incubated with antibodies to ABCG2 and M3R or antibodies to ABCG2 and CK19 (same antibodies used in single immunostaining) overnight at 4°C. The reaction product was visualized with fluorescent goat anti-mouse and anti-rabbit IgG antibodies (1:500; Molecular Probes Inc., Eugene, OR). Specimens were counterstained with 4,6-diamidino-2-phenylindole (Molecular Probes) and observed under a confocal laser microscope (LSM5 PASCAL; Carl Zeiss, Oberkochen, Germany). No positive staining was obtained when the primary antibodies were omitted or replaced with normal mouse serum in the negative controls of the staining procedures.
Culture Studies
Cell Culture
We used three human HCC cell lines in this study: PLC5, HuH7, and HepG2. These cell lines were obtained from the Health Science Research Resources Bank (Osaka, Japan). PLC5 and HuH7 were cultured in Dulbecco’s modified Eagle’s medium (Invitrogen Corp., Carlsbad, CA), whereas HepG2 was maintained in minimum essential medium (Invitrogen Corp.) with 1% nonessential amino acids (Specialty Media, Phillipsburg, NJ). Each medium was supplemented with 10% fetal bovine serum (Invitrogen Corp.) and 1% antibiotics-anti-mycotic (Invitrogen Corp.).
Dual-Fluorescent Immunostaining of ABCG2/M3R and ABCG2/CK19
We cultured three cell lines on Lab-Tek II chamber slides (Nalge Nunc Int., Naperville, IL) for fluorescent immunostaining. After culturing for 2 days, the specimens were fixed in 4% paraformaldehyde for 10 minutes at 4°C. After incubation in protein block solution (Dako Cytomation) for 10 minutes, the specimens were incubated with antibodies to ABCG2 and M3R or antibodies to ABCG2 and CK19 (same antibodies used in single immunostaining) for 1 hour at room temperature. The reaction product was visualized with fluorescent goat anti-mouse and anti-rabbit IgG antibodies (1:500; Molecular Probes). Specimens were counterstained with 4,6-diamidino-2-phenylindole (Molecular Probes), and fluorescent signals were observed under a confocal laser microscope (LSM5 PASCAL; Carl Zeiss). We counted 1200 to 1500 cells to quantify the percentages of ABCG2+, M3R+, or CK19+ cells in each cell line. In addition, the mitotic cell ratios were compared between ABCG2+ and ABCG2− cells, between M3R+ and M3R− cells, or between CK19+ and CK19− cells. No positive staining was obtained when the primary antibodies were omitted or replaced with normal mouse serum in the negative controls of the staining procedures.
Fluorescence-Activated Cell Sorting with Reference to ABCG2 Expression
Culture cells were harvested after the treatment of 0.25% of trypsin-ethylenediaminetetraacetic acid solution (Sigma Chemical Co., St. Louis, MO) for 20 minutes and washed three times in Hanks’ balanced salt solution (Invitrogen Corp.). Culture cells were stained live in the staining solution containing bovine serum albumin and insulin and phycoerythrin-conjugated monoclonal antibody to ABCG2 (clone 5D3; R&D Systems, Minneapolis, MN) for 30 minutes at 4°C. As negative controls, culture cells were similarly incubated with nonimmunized mouse immunoglobulin. Samples were analyzed and sorted by JSAN (Bay Bioscience, Kobe, Japan). We electronically gated out cell debris and cell aggregates. For the positive population, only the top 5 to 10% most brightly stained cells were selected. For the negative population, only the bottom 5 to 10% most dimly stained cells were selected. We sorted 1.0 × 10⁵ cells from the positive or negative population at the most specific mode. Sorted cells were plated on culture dishes for subculture. We separately cultured ABCG2+ and ABCG2− cells. After 2 or 4 weeks of culture, we sorted them again into ABCG2+ and ABCG2− cells using flow cytometry to evaluate how the ABCG2+ cell ratios alter in each subpopulation. We calculated the percentages of ABCG2+ cells in a total of 1000 cells of each cell group.
Cell Proliferation Assay of ABCG2+ and ABCG2− Cells
We plated 5.0 × 10³ cells of ABCG2+ and ABCG2− cells in a 96-well plate, and cultured them for 2, 5, or 8 days before the cell proliferation assay. Cell proliferation was assayed using a method for determining the number of viable cells with a solution reagent containing a tetrazolium compound [3-(4,5-dimethylthiazol-2-yl)-5-(3-carboxymethodxyphenyl)-2-(4-sulfophenyl)-2H-tetrazolium, inner salt] and an electron-coupling reagent (phenazine ethosulfate) (CellTiter 96 Aqueous One solution cell proliferation; Promega, Madison, WI). Twenty μl of the solution reagent was added to each well. After incubation for 3 hours, the absorbance at 490 nm was measured. Four samples for each group were used for analysis.
RNA Expression Profile in ABCG2+ and ABCG2− Cells
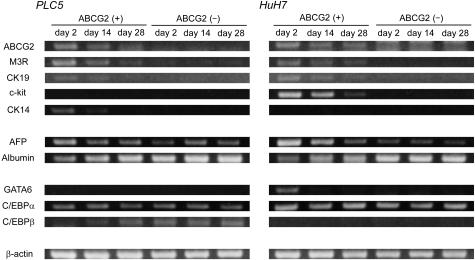
After postsorting subculture for 2, 14, and 28 days, total RNA was extracted from ABCG2+ and ABCG2− cells using the RNeasy mini kit (Qiagen). We performed RT-PCR for hepatic progenitor cell markers (ABCG2, M3R, CK19, c-kit, and CK14), hepatocyte makers (α-fetoprotein and albumin), transcription factors [GATA6, CCAAT/enhancer-binding protein (C/EBP) α, and C/EBPβ], and β-actin. The oligonucleotide sequences, numbers of cycles, and annealing temperatures of these primers are shown in Table 2. After PCR, 5-μl aliquots of the products were subjected to 1.5% or 2.0% agarose gel electrophoresis and stained with ethidium bromide.
Results
Expression of Hepatic Progenitor Cell Markers in Human HCC
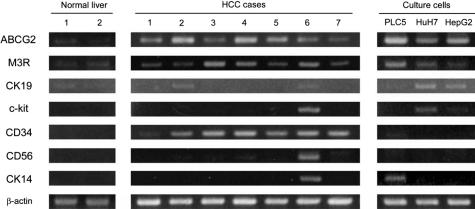
As a preliminary study, we examined the expressions of ABCG2, M3R, CK19, c-kit, CD34, CD56, and CK14, all of which had been reported to be expressed in hepatic progenitor cells,27,28,29,30,31,32 in two cases of normal liver, seven cases of human HCC, and three HCC cell lines, using RT-PCR. ABCG2 and M3R were expressed in all cell lines, normal liver, and HCC specimens (Figure 1). CK19 was expressed in all cell lines and two cases of HCC, although its expression was weak in a cell line (PLC5). c-kit, CD56, and CK14 expressions were only rarely observed in human HCC specimens. CD34 expression was observed in all HCC specimens, but not in any culture cells, suggesting that CD34 might be expressed in nonneoplastic cells, such as endothelial cells in human HCC specimens. Therefore, we selected M3R in addition to ABCG2 as progenitor cell markers in following histological and culture studies. We also selected CK19 because this molecule has been most commonly used as a hepatic progenitor cell marker until now.
Figure 1.
Expressions of hepatic progenitor cell markers in three HCC cell lines, seven cases of human HCC, and two cases of normal liver (RT-PCR). ABCG2 and M3R are expressed in all cell lines, HCC specimens, and normal livers, although their expressions were weak in normal livers. CK19 is expressed in all cell lines and two HCC specimens. CD34 expression is observed in HCC specimens but not in any culture cells. Only a few cell lines and HCC specimens show CD56 and CK14 expressions.
ABCG2, M3R, and CK19 Expressions in Human HCC Specimens
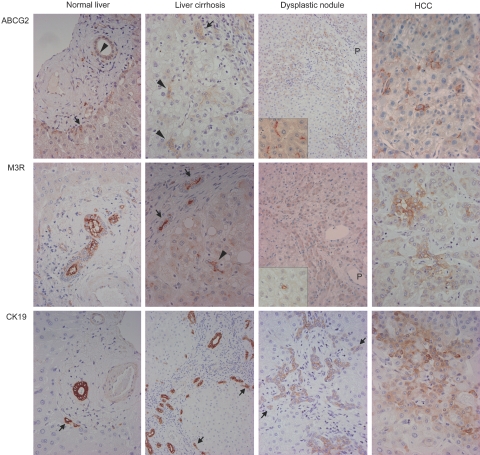
ABCG2, M3R, and CK19 expressions in nonneoplastic livers (normal liver, chronic hepatitis, or liver cirrhosis), dysplastic nodules, and HCCs were shown in Figure 2. In normal liver, ABCG2 was expressed in bile ducts, the canals of Hering, and some periportal hepatocytes. In chronic hepatitis or liver cirrhosis, ABCG2 was also expressed in bile ductules in addition to bile ducts, the canals of Hering, and some periportal hepatocytes. ABCG2 expression was observed on the cell membranes of the canals of Hering and bile ductules, on the luminal side of bile ducts, and on the membrane, especially on the canalicular membrane, of periportal hepatocytes. Some hepatocytes not in periportal areas also expressed ABCG2 in their membranes. ABCG2 expression was observed in all cases of dysplastic nodules and HCC. In dysplastic nodules, irrespective of whether they were low-grade or high-grade, ABCG2 was commonly expressed on the canalicular membrane of dysplastic hepatocytes around the portal tracts entrapped in nodules. In HCCs, ABCG2+ cells were scattered or focally clustered in 12 cases (80%), whereas they were diffusely expressed (more than 60% of tumor cells) in three cases (20%). ABCG2 expression was mainly on the cell membrane of cancer cells as well as in the cytoplasm of cancer cells in two cases. ABCG2 was more commonly expressed in small hepatocytes around the portal tracts in dysplastic nodules, although ABCG2+ and ABCG2− cells in HCCs were not different in their locations and morphologies. Mitotic cell ratios were not significantly different between ABCG2+ (3 to 21 mitoses in 1000 cells) and ABCG2− cells (4 to 15 mitoses) in HCC specimens. ABCG2 expression was also observed in endothelial cells of the intratumoral sinus in all HCCs.
Figure 2.
Single immunostaining of ABCG2, M3R, or CK19 in normal liver, liver cirrhosis, dysplastic nodules, and HCCs. In normal liver, ABCG2, M3R, and CK19 are expressed in bile ducts (arrowhead in ABCG2) and periportal hepatocytes (arrows in ABCG2 and CK19). In liver cirrhosis, ABCG2, M3R, and CK19 expressions are observed in the bile ductules (arrows) and the canals of Hering (arrowheads). Structures indicated by arrowheads have small and inconspicuous lumen, and are not embedded in connective tissue of portal tracts, but surrounded by mature hepatocytes. These histological features suggest that these structures are canals of Hering. In dysplastic nodules, these three molecules are expressed in dysplastic hepatocytes around the portal tracts (P) (arrows in CK19). ABCG2 are mainly expressed on the canalicular membrane of hepatocytes (inset). M3R is also expressed in the small ductular structures resembling the canals of Hering within the dysplastic nodule (inset). CK19 expression is also expressed in bile ductule-like structure in intranodular portal tracts. In HCC, these three molecules are expressed in the cytoplasm or cell membranes of some cancer cells. Original magnifications: ×400 (normal liver, liver cirrhosis, HCC, and insets); ×200 (dysplastic nodule).
M3R was expressed on the luminal side of the bile duct and the canals of Hering in normal livers. M3R was also expressed on the luminal membrane of the canals of Hering, bile ductules, and bile ducts in chronic hepatitis and liver cirrhosis, whereas its expression was mainly observed in the cytoplasm of dysplastic or neoplastic hepatocytes (Figure 2). M3R expression was observed in 13 of 20 cases of dysplastic nodules (seven low-grade cases and six high-grade cases) (65%) and 8 of 15 cases of HCC (53%). M3R was expressed in periportal dysplastic hepatocytes in low-grade and high-grade dysplastic nodules. Small ductular structures resembling the canals of Hering within dysplastic nodules were also positive for M3R (Figure 2, inset). In HCC, M3R+ cells were scattered in seven cases (47% of HCC cases); whereas, they were diffuse (more than 60% of tumor cells) in one case (6%). One case of HCC showed membranous expression of M3R in addition to cytoplasmic expression (Figure 2). Similar to ABCG2, M3R were more commonly expressed in small hepatocytes around portal tracts in dysplastic nodules, and M3R+ and M3R− cells in HCCs were not different in their locations and morphologies. Mitotic cell ratios were not significantly different between M3R+ (4 to 18 mitoses in 1000 cells) and M3R− cells (5 to 20 mitoses) in HCC specimens.
CK19 was expressed in the cytoplasm of the canals of Hering, bile ductules, bile ducts, and some periportal hepatocytes in nonneoplastic livers (normal liver, chronic hepatitis, and liver cirrhosis). CK19 expression was observed in 11 of 20 cases of dysplastic nodules (six low-grade cases and five high-grade cases) (55%) and 4 of 15 cases of HCC (27%). In dysplastic nodules, CK19 was expressed in bile ducts and bile ductules within nodules, as well as in periportal small dysplastic cells. Of the four cases of HCC with CK19 expression, it was only focally expressed in three cases, whereas the remaining case (scirrhous HCC) showed CK19 expression in ∼30% of tumor cells.
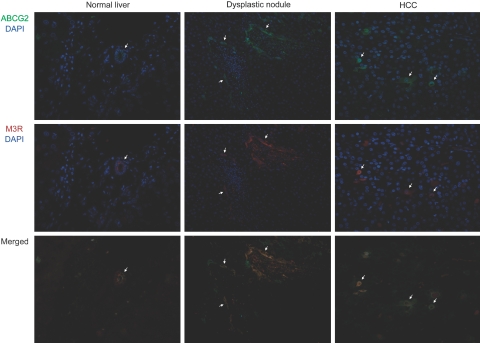
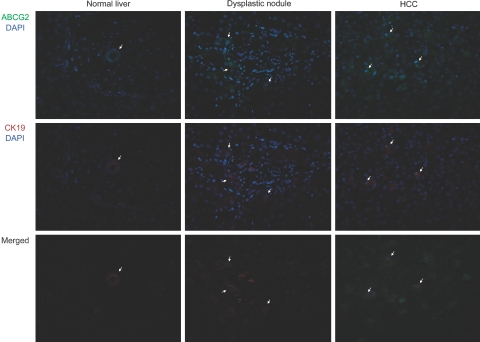
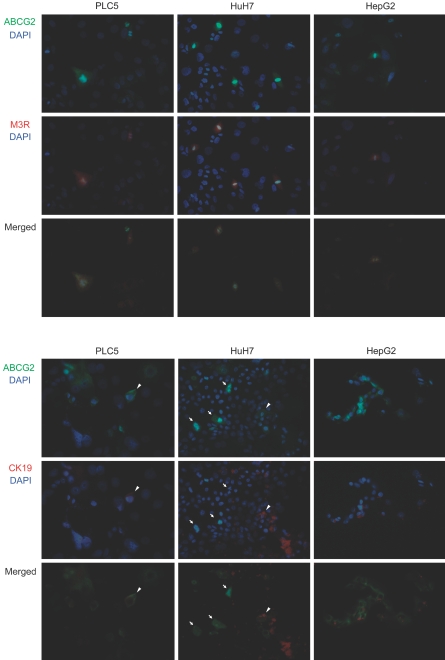
We performed the dual-fluorescent immunostaining of ABCG2/M3R and ABCG2/CK19 to examine the localization of nonneoplastic or neoplastic cells expressing these molecules (Figures 3 and 4). In normal livers, bile ducts commonly coexpressed ABCG2, M3R, and CK19. In both low-grade and high-grade dysplastic nodules, several dysplastic hepatocytes coexpressed ABCG2/M3R or ABCG2/CK19, and many dysplastic cells coexpressing these molecules were especially observed in periportal areas (Figures 3 and 4). Likewise, ABCG2/M3R and ABCG2/CK19 were also frequently coexpressed in some cancer cells in HCC (Figures 3 and 4).
Figure 3.
Dual-fluorescent immunostaining of ABCG2 and M3R in normal liver, dysplastic nodule, and HCC. In normal liver, bile ducts coexpressed ABCG2 (green) and M3R (red). Coexpression of ABCG2 and M3R is commonly observed in periportal hepatocytes in dysplastic nodule and scattered cancer cells in HCC (arrows). Original magnifications: ×400 (normal liver and HCC); ×200 (dysplastic nodule).
Figure 4.
Dual-fluorescent immunostaining of ABCG2 and CK19 in normal liver, dysplastic nodule, and HCC. In normal liver, bile ducts coexpressed ABCG2 (green) and CK19 (red). Coexpression of ABCG2 and CK19 is commonly observed in periportal hepatocytes in dysplastic nodule (center of the field is an intranodular portal tract) and scattered cancer cells in HCC (arrows). Original magnifications: ×400 (normal liver, HCC); ×200 (dysplastic nodule).
ABCG2, M3R, and CK19 Expressions in HCC Cell Lines
Immunostaining of ABCG2, M3R, and CK19 on HCC culture cells revealed ABCG2, M3R, and CK19 expressions in some cancer cells in every HCC cell line. The ratios of ABCG2+ cells were 25.7% in PLC5, 22.3% in HuH7, and 19.8% in HepG2 on immunostaining. Likewise, the ratios of M3R+ cells were 20.1% in PLC5, 20.5% in HuH7, and 14.7% in HepG2, and the ratios of CK19+ cells were 2.3% in PLC5, 35.5% in HuH7, and 18.7% in HepG2. The cytological features, such as cell sizes and shapes, were not different between cancer cells with and without expressions of these molecules in any of the cell lines. Dual-fluorescent immunostaining of ABCG2/M3R and ABCG2/CK19 revealed that these molecules were commonly coexpressed in some cancer cells (Figure 5). The ratios of ABCG2+/M3R+ cells were 16.8% in PLC5, 10.7% in HuH7, and 9.8% in HepG2. Likewise, the ratios of ABCG2+/CK19+ cells were 0.5% in PLC5, 4.5% in HuH7, and 7.8% in HepG2. Interestingly, many of the cancer cells expressing ABCG2 and M3R showed mitotic features (Figure 5). The mitotic cell ratios were higher in ABCG2+ cells (16.3 to 30.4%) than ABCG2− cells (1.5 to 3.1%) in all cell lines. Likewise, M3R+ cells were mitotically more active (16.8 to 28.5%) compared with M3R− cells (0.9 to 2.3%) in every cell line. In contrast, mitotic figures were not significantly different between CK19+ cells (4.5 to 8.8%) and CK19− cells (5.4 to 7.5%).
Figure 5.
Dual-fluorescent immunostaining of ABCG2/M3R and ABCG2/CK19 in three HCC cell lines. Some cancer cells are double-positive for ABCG2 (green) and M3R (red) in every cell line. Some cancer cells are also double-positive for ABCG2 (green) and CK19 (red) in every cell line (arrowheads). Many mitotic figures are observed in cancer cells expressing ABCG2 and M3R. In contrast, mitotic figures are not common in cancer cells expressing CK19. Arrows in HuH7 indicate mitotic cells expressing ABCG2 but not CK19. Original magnifications, ×400.
Cell Sorting of HCC Culture Cells with Regard to ABCG2 Expression
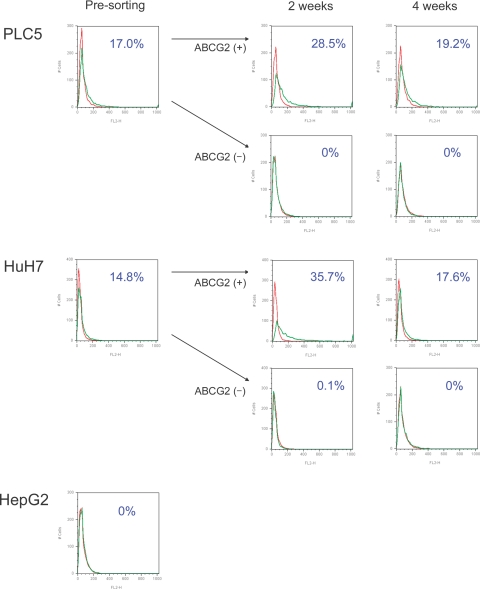
The flow cytometry analysis with regard to ABCG2 expression in HCC culture cells is shown in Figure 6. The percentages of ABCG2+ cells in flow cytometry were 17.0% in PLC5 and 14.8% in HuH7. In contrast, ABCG2+ cells could not be detected in HepG2. After cell sorting, we separately cultured ABCG2+ and AGCG2− cells derived from PLC5 or HuH7 for 2 or 4 weeks. In ABCG2+ subpopulations, the ratios of ABCG2+ cells time-dependently declined, and they returned to almost presorting levels (19.2% in PLC5 and 17.6% in HuH7) after 4 weeks of subculture. In ABCG2− subpopulations, the ABCG2+ population could not be detected during the 4 weeks, both in PLC5 and HuH7. These results suggested that ABCG2+ cells could bear ABCG2+ and ABCG2− progenies, whereas ABCG2− cells could not generate ABCG2+ cells and remain in an ABCG2− subpopulation. We performed our analyses in triplicate, generating similar results each time.
Figure 6.
Results of flow cytometry analysis with regard to ABCG2 in three HCC cell lines. ABCG2+ cells make up 17.0% in PLC5 and 14.8% in HuH7. In ABCG2+ subpopulations of PLC5 and HuH7, the ratios of ABCG2+ cells decline time-dependently after 2 and 4 weeks of subculture after cell sorting. ABCG2+ cells cannot be generated from an ABCG2− subpopulation with 2 and 4 weeks of subculture. The ABCG2+ subpopulation is not detected in HepG2 by flow cytometry.
Intracellular Localization of ABCG2 in HCC Culture Cells
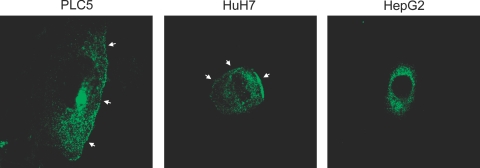
ABCG2 was expressed in HepG2 at the mRNA (RT-PCR) and protein levels (immunostaining) as shown in Figures 1 and 3; however, ABCG2+ cells could not be detected with flow cytometry before cell sorting. Then, we examined the intracellular localization of ABCG2 using three HCC culture cells. ABCG2 was localized on the cell membrane in addition to the cytoplasm in PLC5 and HuH7, whereas it was observed only in the cytoplasm in HepG2 (Figure 7). These results suggested that the negativity of ABCG2+ cells in HepG2 on flow cytometry could be caused by the intracellular dislocation of ABCG2, which is usually expressed on the cell membrane in nonneoplastic cells or other HCC culture cells (PLC and HuH7).
Figure 7.
Intracellular localization of ABCG2 in three HCC cell lines. ABCG2 expression is observed on the cell membrane in addition to the cytoplasm in PLC5 and HuH7 (arrows). ABCG2 expression in HepG2 is only observed in the cytoplasm. Original magnifications, ×650.
Proliferation Assay of ABCG2+ and ABCG2− Cells
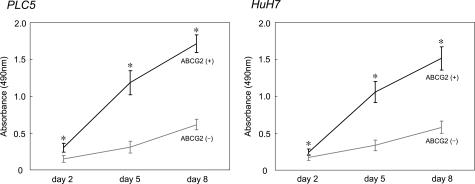
The growth curves of ABCG2+ and ABCG2− cells are shown in Figure 8. During the 8 days after cell sorting, the proliferation activities were higher, especially at the earlier time, in ABCG2+ cells compared with ABCG2− cells in both PLC5 and HuH7 (P < 0.05 at each time).
Figure 8.
The growth curves of ABCG2+ and ABCG2− subpopulations in PLC5 and HuH7 during 8 days after sorting. Proliferation activities of ABCG2+ cells are significantly higher than those of ABCG2− cells in both PLC5 and HuH7. *P < 0.05.
Expression Patterns of mRNA in ABCG2+ and ABCG2− Cells
We examined the expressions of hepatic progenitor cell markers, hepatocyte markers, and transcription factors involved in hepatic embryogenesis in ABCG2+ and ABCG2− cells by RT-PCR (Figure 9). In addition to ABCG2, other progenitor cell markers (M3R, CK19, c-kit, and CK14) were more intensely expressed in ABCG2+ cells compared with ABCG2− cells, although c-kit and CK14 were not expressed in PLC5 and HuH7, respectively (Figures 1 and 8). AFP and albumin were differently expressed in ABCG2+ and ABCG2− cells. More intense expressions of AFP and albumin were observed in ABCG2+ and ABCG2− cells, respectively. Among transcription factors, GATA6, which is essential for the earliest stage of the hepatic development,33 was expressed only in ABCG2+ cells of HuH7. C/EBPα is continuously expressed in hepatoblasts and hepatocytes during normal hepatic development,34 and it was similarly expressed in ABCG2+ and ABCG2− subpopulations of both PLC5 and HuH7. C/EBPβ, which is implicated in the late phase of hepatic development,34 was expressed in ABCG2− cells of PLC5. The expression patterns of these molecules in ABCG2+ cells gradually altered during 4 weeks of subculture, whereas ABCG2− cells did not show significant changes in mRNA expression in this period.
Figure 9.
Expression patterns of hepatic progenitor cell markers (ABCG2, M3R, CK19, c-kit, and CK14), hepatocyte markers (AFP and albumin), and transcription factors involved in hepatic embryogenesis (GATA6, C/EBPα, and C/EBPβ) (RT-PCR). Hepatic progenitor cell markers and AFP are more intensely expressed in ABCG2+ cells compared with ABCG2− cells. Conversely, albumin expression is more intense in ABCG2− cells. Expression patterns of transcriptional factors are different between ABCG2+ and ABCG2− cells. Expression patterns of these molecules in ABCG2+ cells gradually altered during 4 weeks of subculture, whereas ABCG2− cells did not show significant changes in mRNA expression in this period.
Discussion
In this study, we conducted histological and culture studies to examine the possible participation of hepatic progenitor cells in the carcinogenesis of human HCC. In histological studies, hepatocytes expressing ABCG2 were observed in all cases of dysplastic nodules and of HCC. In addition, it is interesting that ABCG2+ hepatocytes were located in the periportal areas of the dysplastic nodule, similarly to those in background and normal livers. The interface between the portal tracts and hepatic parenchyma in the dysplastic nodule is not completely equivalent to the location of nonneoplastic livers, although hepatic progenitor cells are estimated to exist around this location in normal livers.35,36,37 ABCG2 is well known as one of the drug transporters and is involved in the acquisition of resistance to anti-cancer drugs in malignant tumors.38,39,40 Some dysplastic or neoplastic hepatocytes expressing ABCG2 also had M3R or CK19 expression; in addition, ABCG2+ subpopulations of culture cells showed a more intense expression of other progenitor cell markers compared with ABCG2− subpopulations. These results suggest that ABCG2 expressed in dysplastic nodules and HCCs does not completely reflect the drug-resistant phenotype obtained during carcinogenesis but corresponds to a progenitor cell phenotype maintained during tumor development. That is, ABCG2+ cells continuously exist during hepatocarcinogenesis from liver cirrhosis to HCC, and their locations in dysplastic nodules are characteristically similar to those in liver cirrhosis (periportal hepatocytes).
Then, we performed culture studies to elucidate the biological characteristics of ABCG2+ cells in HCC cell lines. Cell sorting analyses revealed that ABCG2+ subpopulations could generate both ABCG2+ and ABCG2− progenies; whereas, ABCG2− subpopulations could not bear ABCG2+ cells, suggesting that a cancer cell hierarchy with regard to ABCG2 expression might exist in HCC cell lines. ABCG2+ cells would exist at a higher rank in this hierarchy and have the ability to replicate themselves (self-renewal) and also generate ABCG2− progenies. In addition, ABCG2+ cells showed higher proliferative activity. Taken together, ABCG2+ cells had several of the biological properties of stem cells or progenitor cells: self-renewal, high proliferative activity, the preferential expression of other progenitor cell markers, and the ability to give rise to nonstem progenies (ABCG2− populations). ABCG2+ cells existing in dysplastic nodules and HCCs would be at a higher rank of cancer cell hierarchy and might play a central role in hepatocarcinogenesis and tumor proliferation as tumor-founding cells. This study, with regard to ABCG2 expression, supports the hypothesis that the progenitor cell origin theory and the hierarchical model could be applied to human HCC.
Recently, Haraguchi and colleagues23 identified SP cells from several cell lines of digestive system cancers, including three HCC cell lines (HuH7, HepG2, and HepG3). SP cells were successfully identified in HuH7 and HepG3, but not in HepG2. More recently, Chiba and colleagues24 also purified SP cells from two of four HCC cell lines: PLC5 and HuH7. SP cells could generate both SP and non-SP progenies, whereas non-SP cells bore only non-SP cells. The ratios of SP cells in subpopulations sorted as SP declined time-dependently and finally reached the presorting level. Those results based on an SP phenotype closely resemble the results of our study with regard to ABCG2 expression. This resemblance seems reasonable because the SP phenotype is mainly maintained by ABCG2.21,22 Zhou and colleagues21,22 performed research with regard to the SP phenotype in hematopoietic stem cells using Bcrp1−/− or Mdr1−/− knockout mice (Bcrp1 is a murine transporter corresponding to human ABCG2). Loss of Bcrp1 gene expression, but not Mdr1, led to a significant reduction in the number of SP cells. They concluded that expression of Bcrp1 is related to the efflux of Hoechst dye and maintenance of the SP phenotype.21,22 In contrast, the percentages of SP cells are quite different from the ratios of ABCG2+ cells in HCC cell lines. SP cells were less than 1.0% of the total culture cells in PLC and HuH7,23,24 whereas ABCG2+ cells made up 17.0% in PLC5 and 14.8% in HuH7 on flow cytometry in this study, suggesting that ABCG2+ cells might contain a larger range of cells compared with SP cells. SP cells might be included in ABCG2+ subpopulations; however, it seems difficult at this time to determine to what degree ABCG2+ subpopulations and SP cells are equivalent. Further analyses are mandatory to conclude which factors, such as the degree of ABCG2 expression or coexpression of other transporters, are implicated in the acquisition and maintenance of an SP phenotype. Indeed, SP cells are known to express other ATP-binding cassette transporters, such as MDR-1 (ABCB1), MRP-1 (ABCC1), and ABCA2.8,41,42
In this study, HepG2 were different from PLC5 and HuH7 according to flow cytometry analyses. HepG2 showed ABCG2 expression at the mRNA and protein levels, although we could not detect ABCG2+ cells in HepG2 using flow cytometry. Based on the analysis with a confocal laser microscope, this difference might be caused by the dislocation of ABCG2 from the cell membrane to the cytoplasm in HepG2 cells. Intracellular dislocation of ABCG2 has not been reported in any cell lines until now to the best of our knowledge. This is an interesting finding, although it is still unknown whether it has any functions other than a transporter in the cytoplasm. Further analyses are mandatory to address the significance of ABCG2 expression and its intracytoplasmic location in HepG2. In the previous study by Haraguchi and colleagues,23 SP cells could be identified in 17 of 18 cell lines of digestive tract cancer (esophageal, gastric, colorectal, hepatic, and pancreatic cancers). Interestingly, the only cell line in which SP cells could not be identified was HepG2. In addition, Chiba and colleagues24 also failed to isolate SP cells from HepG2. Intracellular dislocation of ABCG2 might have influenced the lack of SP cells in HepG2.
In 2005, Patrawala and colleagues43 studied ABCG2+ and ABCG2− cells with respect to their tumorigenicity in vivo. In their report, ABCG2+ and ABCG2− cells were similarly tumorigenic in the xenograft transplant experiments. In our study, ABCG2+ cells could not be generated from ABCG2− cells in vitro, although ABCG2+ and ABCG2− cells were similarly generated in both ABCG2+ and ABCG2− xenografts.43 This discrepancy might be caused by the difference of the cell lines used (prostate, breast, and colon cancer cell lines versus HCC cell lines) or experimental models (xenograft transplantation versus in vitro culture). Further analysis using large numbers of cell lines will be mandatory to elucidate this difference.
It is also interesting that transcription factors were differently expressed in ABCG2+ and ABCG2− cells. GATA6 is one of the essential factors in the earliest phase of hepatic development.33 C/EBPα is constantly expressed during hepatic embryogenesis, whereas C/EBPβ is more important in the late phase of liver development.34 GATA6 and C/EBPβ are intensely expressed in ABCG2+ and ABCG2− cells, respectively. C/EBPα is similarly expressed in both subpopulations. Those expression patterns of transcription factors in ABCG2+ and ABCG2− cells resemble those of embryonal hepatic development.33,34 A cancer cell hierarchy in HCC might be regulated by transcription factors similar to those in normal hepatic development. Expression patterns of AFP and albumin in ABCG2+ and ABCG2− cells also supported this similarity between hepatocyte proliferation during normal hepatic development and proliferation or differentiation of HCC cells along a cancer cell hierarchy.
We examined M3R expression, in addition to ABCG2 and CK19, as a progenitor cell marker in this study. In 2002, Cassiman and colleagues29 reported that M3R was expressed in hepatic progenitor cells, atypical reactive ductules, or intermediate hepatocyte-like cells in nonneoplastic livers. They suggested that the hepatic vagus branch stimulates the activation of hepatic progenitor cells via the M3R expressed on those cells.29 In our studies, M3R was expressed on the cell membrane of the canals of Hering, bile ductules, and bile ducts in nonneoplastic livers, whereas its expression was mostly in the cytoplasm of dysplastic or neoplastic hepatocytes in HCCs and their precursors. This is the first report with regard to M3R expression in the cytoplasm of dysplastic or neoplastic hepatocytes. It seems interesting to determine the nervous involvement in the proliferation or differentiation of cancer cells with a progenitor phenotype, because the nervous influence on progenitor cells has not been well documented so far, to the best of our knowledge.
In conclusion, this study revealed that cancer cells expressing progenitor cell markers exist in HCC and their precursors (dysplastic nodules) and they might be located at a higher rank in a cancer cell hierarchy, like cancer stem cells. These results suggested that the progenitor cell origin theory and the hierarchical model might be applicable to human HCC.
Footnotes
Address reprint requests to Yasuni Nakanuma, M.D., Department of Human Pathology, Kanazawa University Graduate School of Medicine, 13-1 Takaramachi, Kanazawa 920-8640, Japan. E-mail: pbcpsc@kenroku.kanazawa-u.ac.jp.
References
- Reya T, Morrison SJ, Clarke MF, Weissman IL. Stem cells, cancer, and cancer stem cells. Nature. 2001;414:105–111. doi: 10.1038/35102167. [DOI] [PubMed] [Google Scholar]
- Vescovi AL, Galli R, Reynolds BA. Brain tumour stem cells. Nat Rev Cancer. 2006;6:425–436. doi: 10.1038/nrc1889. [DOI] [PubMed] [Google Scholar]
- Bonnet D, Dick JE. Human acute myeloid leukemia is organized as a hierarchy that originates from a primitive hematopoietic cell. Nat Med. 1997;3:730–737. doi: 10.1038/nm0797-730. [DOI] [PubMed] [Google Scholar]
- Hope KJ, Jin L, Dick JE. Acute myeloid leukemia originates from a hierarchy of leukemic stem cell classes that differ in self-renewal capacity. Nat Immunol. 2004;5:738–743. doi: 10.1038/ni1080. [DOI] [PubMed] [Google Scholar]
- Beachy PA, Karhadkar SS, Berman DM. Tissue repair and stem cell renewal in carcinogenesis. Nature. 2004;432:324–331. doi: 10.1038/nature03100. [DOI] [PubMed] [Google Scholar]
- Thorgeirsson SS, Lee JS, Grisham JW. Functional genomics of hepatocellular carcinoma. Hepatology. 2006;43:S145–S150. doi: 10.1002/hep.21063. [DOI] [PubMed] [Google Scholar]
- Satyanarayana A, Manns MP, Rudolph KL. Telomeres and telomerase: a dual role in hepatocarcinogenesis. Hepatology. 2004;40:276–283. doi: 10.1002/hep.20308. [DOI] [PubMed] [Google Scholar]
- Hirschmann-Jax C, Foster AE, Wulf GG, Nuchtern JG, Jax TW, Gobel U, Goodell MA, Brenner MK. A distinct “side population” of cells with high drug efflux capacity in human tumor cells. Proc Natl Acad Sci USA. 2004;101:14228–14233. doi: 10.1073/pnas.0400067101. [DOI] [PMC free article] [PubMed] [Google Scholar]
- Kondo T, Setoguchi T, Taga T. Persistence of a small subpopulation of cancer stem-like cells in the C6 glioma cell line. Proc Natl Acad Sci USA. 2004;101:781–786. doi: 10.1073/pnas.0307618100. [DOI] [PMC free article] [PubMed] [Google Scholar]
- Hemmati HD, Nakano I, Lazareff JA, Masterman-Smith M, Geschwind DH, Bronner-Fraser M, Kornblum HI. Cancerous stem cells can arise from pediatric brain tumors. Proc Natl Acad Sci USA. 2003;100:15178–15183. doi: 10.1073/pnas.2036535100. [DOI] [PMC free article] [PubMed] [Google Scholar]
- Singh SK, Clarke ID, Hide T, Dirks PB. Cancer stem cells in nervous system tumors. Oncogene. 2004;23:7267–7273. doi: 10.1038/sj.onc.1207946. [DOI] [PubMed] [Google Scholar]
- Singh SK, Hawkins C, Clarke ID, Squire JA, Bayani J, Hide T, Henkelman RM, Cusimano MD, Dirks PB. Identification of human brain tumour initiating cells. Nature. 2004;432:396–401. doi: 10.1038/nature03128. [DOI] [PubMed] [Google Scholar]
- Al-Hajj M, Wicha MS, Benito-Hernandez A, Morrison SJ, Clarke MF. Prospective identification of tumorigenic breast cancer cells. Proc Natl Acad Sci USA. 2003;100:3983–3988. doi: 10.1073/pnas.0530291100. [DOI] [PMC free article] [PubMed] [Google Scholar]
- Goodell MA, Rosenzweig M, Kim H, Marks DF, DeMaria M, Paradis G, Grupp SA, Sieff CA, Mulligan RC, Johnson RP. Dye efflux studies suggest that hematopoietic stem cells expressing low or undetectable levels of CD34 antigen exist in multiple species. Nat Med. 1997;3:1337–1345. doi: 10.1038/nm1297-1337. [DOI] [PubMed] [Google Scholar]
- Jackson KA, Majka SM, Wang H, Pocius J, Hartley CJ, Majesky MW, Entman ML, Michael LH, Hirschi KK, Goodell MA. Regeneration of ischemic cardiac muscle and vascular endothelium by adult stem cells. J Clin Invest. 2001;107:1395–1402. doi: 10.1172/JCI12150. [DOI] [PMC free article] [PubMed] [Google Scholar]
- Montanaro F, Liadaki K, Schienda J, Flint A, Gussoni E, Kunkel LM. Demystifying SP cell purification: viability, yield, and phenotype are defined by isolation parameters. Exp Cell Res. 2004;298:144–154. doi: 10.1016/j.yexcr.2004.04.010. [DOI] [PubMed] [Google Scholar]
- Summer R, Kotton DN, Sun X, Ma B, Fitzsimmons K, Fine A. Side population cells and Bcrp1 expression in lung. Am J Physiol. 2003;285:L97–L104. doi: 10.1152/ajplung.00009.2003. [DOI] [PubMed] [Google Scholar]
- Terunuma A, Jackson KL, Kapoor V, Telford WG, Vogel JC. Side population keratinocytes resembling bone marrow side population stem cells are distinct from label-retaining keratinocyte stem cells. J Invest Dermatol. 2003;121:1095–1103. doi: 10.1046/j.1523-1747.2003.12531.x. [DOI] [PubMed] [Google Scholar]
- Falciatori I, Borsellino G, Haliassos N, Boitani C, Corallini S, Battistini L, Bernardi G, Stefanini M, Vicini E. Identification and enrichment of spermatogonial stem cells displaying side-population phenotype in immature mouse testis. FASEB J. 2004;18:376–378. doi: 10.1096/fj.03-0744fje. [DOI] [PubMed] [Google Scholar]
- Welm BE, Tepera SB, Venezia T, Graubert TA, Rosen JM, Goodell MA. Sca-1(pos) cells in the mouse mammary gland represent an enriched progenitor cell population. Dev Biol. 2002;245:42–56. doi: 10.1006/dbio.2002.0625. [DOI] [PubMed] [Google Scholar]
- Zhou S, Schuetz JD, Bunting KD, Colapietro AM, Sampath J, Morris JJ, Lagutina I, Grosveld GC, Osawa M, Nakauchi H, Sorrentino BP. The ABC transporter Bcrp1/ABCG2 is expressed in a wide variety of stem cells and is a molecular determinant of the side-population phenotype. Nat Med. 2001;7:1028–1034. doi: 10.1038/nm0901-1028. [DOI] [PubMed] [Google Scholar]
- Zhou S, Morris JJ, Barnes Y, Lan L, Schuetz JD, Sorrentino BP. Bcrp1 gene expression is required for normal numbers of side population stem cells in mice, and confers relative protection to mitoxantrone in hematopoietic cells in vivo. Proc Natl Acad Sci USA. 2002;99:12339–12344. doi: 10.1073/pnas.192276999. [DOI] [PMC free article] [PubMed] [Google Scholar]
- Haraguchi N, Utsunomiya T, Inoue H, Tanaka F, Mimori K, Barnard GF, Mori M. Characterization of a side population of cancer cells from human gastrointestinal system. Stem Cells. 2006;24:506–513. doi: 10.1634/stemcells.2005-0282. [DOI] [PubMed] [Google Scholar]
- Chiba T, Kita K, Zheng YW, Yokosuka O, Saisho H, Iwama A, Nakauchi H, Taniguchi H. Side population purified from hepatocellular carcinoma cells harbors cancer stem cell-like properties. Hepatology. 2006;44:240–251. doi: 10.1002/hep.21227. [DOI] [PubMed] [Google Scholar]
- Ferrell LD, Crawford JM, Dhillon AP, Scheuer PJ, Nakanuma Y. Proposal for standardized criteria for the diagnosis of benign, borderline, and malignant hepatocellular lesions arising in chronic advanced liver disease. Am J Surg Pathol. 1993;17:1113–1123. doi: 10.1097/00000478-199311000-00004. [DOI] [PubMed] [Google Scholar]
- Ishak KM, Goodman ZD, Stocker JT. Tumors of the liver and intrahepatic bile ducts. Rosai J, editor. Washington DC: the American Registry of Pathology,; Atlas of Tumor Pathology. 2001:pp 185–198. [Google Scholar]
- Shimano K, Satake M, Okaya A, Kitanaka J, Kitanaka N, Takemura M, Sakagami M, Terada N, Tsujimura T. Hepatic oval cells have the side population phenotype defined by expression of ATP-binding cassette transporter ABCG2/BCRP1. Am J Pathol. 2003;163:3–9. doi: 10.1016/S0002-9440(10)63624-3. [DOI] [PMC free article] [PubMed] [Google Scholar]
- Vander Borght S, Libbrecht L, Katoonizadeh A, van Pelt J, Cassiman D, Nevens F, Van Lommel A, Petersen BE, Fevery J, Jansen PL, Roskams TA. Breast cancer resistance protein (BCRP/ABCG2) is expressed by progenitor cells/reactive ductules and hepatocytes and its expression pattern is influenced by disease etiology and species type: possible functional consequences. J Histochem Cytochem. 2006;54:1051–1059. doi: 10.1369/jhc.5A6912.2006. [DOI] [PubMed] [Google Scholar]
- Cassiman D, Libbrecht L, Sinelli N, Desmet V, Denef C, Roskams T. The vagal nerve stimulates activation of the hepatic progenitor cell compartment via muscarinic acetylcholine receptor type 3. Am J Pathol. 2002;161:521–530. doi: 10.1016/S0002-9440(10)64208-3. [DOI] [PMC free article] [PubMed] [Google Scholar]
- Li WL, Su J, Yao YC, Tao XR, Yan YB, Yu HY, Wang XM, Li JX, Yang YJ, Lau JT, Hu YP. Isolation and characterization of bipotent liver progenitor cells from adult mouse. Stem Cells. 2006;24:322–332. doi: 10.1634/stemcells.2005-0108. [DOI] [PubMed] [Google Scholar]
- Crosby HA, Kelly DA, Strain AJ. Human hepatic stem-like cells isolated using c-kit or CD34 can differentiate into biliary epithelium. Gastroenterology. 2001;120:534–544. doi: 10.1053/gast.2001.21175. [DOI] [PubMed] [Google Scholar]
- Haruna Y, Saito K, Spaulding S, Nalesnik MA, Gerber MA. Identification of bipotential progenitor cells in human liver development. Hepatology. 1996;23:476–481. doi: 10.1002/hep.510230312. [DOI] [PubMed] [Google Scholar]
- Zhao R, Watt AJ, Li J, Luebke-Wheeler J, Morrisey EE, Duncan SA. GATA6 is essential for embryonic development of the liver but dispensable for early heart formation. Mol Cell Biol. 2005;25:2622–2631. doi: 10.1128/MCB.25.7.2622-2631.2005. [DOI] [PMC free article] [PubMed] [Google Scholar]
- Shiojiri N, Takeshita K, Yamasaki H, Iwata T. Suppression of C/EBP alpha expression in biliary cell differentiation from hepatoblasts during mouse liver development. J Hepatol. 2004;41:790–798. doi: 10.1016/j.jhep.2004.07.011. [DOI] [PubMed] [Google Scholar]
- Roskams TA, Theise ND, Balabaud C, Bhagat G, Bhathal PS, Bioulac-Sage P, Brunt EM, Crawford JM, Crosby HA, Desmet V, Finegold MJ, Geller SA, Gouw AS, Hytiroglou P, Knisely AS, Kojiro M, Lefkowitch JH, Nakanuma Y, Olynyk JK, Park YN, Portmann B, Saxena R, Scheuer PJ, Strain AJ, Thung SN, Wanless IR, West AB. Nomenclature of the finer branches of the biliary tree: canals, ductules, and ductular reactions in human livers. Hepatology. 2004;39:1739–1745. doi: 10.1002/hep.20130. [DOI] [PubMed] [Google Scholar]
- Theise ND, Saxena R, Portmann BC, Thung SN, Yee H, Chiriboga L, Kumar A, Crawford JM. The canals of Hering and hepatic stem cells in humans. Hepatology. 1999;30:1425–1433. doi: 10.1002/hep.510300614. [DOI] [PubMed] [Google Scholar]
- Sell S. Heterogeneity and plasticity of hepatocyte lineage cells. Hepatology. 2001;33:738–750. doi: 10.1053/jhep.2001.21900. [DOI] [PubMed] [Google Scholar]
- Doyle LA, Ross DD. Multidrug resistance mediated by the breast cancer resistance protein BCRP (ABCG2). Oncogene. 2003;22:7340–7358. doi: 10.1038/sj.onc.1206938. [DOI] [PubMed] [Google Scholar]
- Leslie EM, Deeley RG, Cole SP. Multidrug resistance proteins: role of P-glycoprotein, MRP1, MRP2, and BCRP (ABCG2) in tissue defense. Toxicol Appl Pharmacol. 2005;204:216–237. doi: 10.1016/j.taap.2004.10.012. [DOI] [PubMed] [Google Scholar]
- Mao Q, Unadkat JD. Role of the breast cancer resistance protein (ABCG2) in drug transport. AAPS J. 2005;7:E118–E133. doi: 10.1208/aapsj070112. [DOI] [PMC free article] [PubMed] [Google Scholar]
- Lechner A, Leech CA, Abraham EJ, Nolan AL, Habener JF. Nestin-positive progenitor cells derived from adult human pancreatic islets of Langerhans contain side population (SP) cells defined by expression of the ABCG2 (BCRP1) ATP-binding cassette transporter. Biochem Biophys Res Commun. 2002;293:670–674. doi: 10.1016/S0006-291X(02)00275-9. [DOI] [PubMed] [Google Scholar]
- Benchaouir R, Rameau P, Decraene C, Dreyfus P, Israeli D, Pietu G, Danos O, Garcia L. Evidence for a resident subset of cells with SP phenotype in the C2C12 myogenic line: a tool to explore muscle stem cell biology. Exp Cell Res. 2004;294:254–268. doi: 10.1016/j.yexcr.2003.11.005. [DOI] [PubMed] [Google Scholar]
- Patrawala L, Calhoun T, Schneider-Broussard R, Zhou J, Claypool K, Tang DG. Side population is enriched in tumorigenic, stem-like cancer cells, whereas ABCG2+ and ABCG2− cancer cells are similarly tumorigenic. Cancer Res. 2005;65:6207–6219. doi: 10.1158/0008-5472.CAN-05-0592. [DOI] [PubMed] [Google Scholar]


