

Abstract
Objectives. We aimed to quantify tsunami mortality and compare approaches to mortality assessment in the emergency context in Aceh, Indonesia, where the impact of the 2004 tsunami was greatest.
Methods. Mortality was estimated using geographic information systems–based vulnerability models and demographic methods from surveys of tsunami-displaced populations.
Results. Tsunami mortality in Aceh as estimated by demographic models was 131066 and was similar to official figures of 128063; however, it was a conservative estimate of actual mortality and is substantially less than official estimates of 168561 presumed dead, which included those classified as missing. Tsunami impact was greatest in the district of Aceh Jaya, where an estimated 27.0% (n=23862) of the population perished; Aceh Besar and Banda Aceh were also severely affected, with mortality at 21.0% (n = 61 650) and 11.5% (n = 25 903), respectively. Mortality was estimated at 23.7% for the population at risk and 5.6% overall.
Conclusions. Mortality estimates were derived using methodologies that can be applied in future disasters when predisaster demographic data are not available. Models could be useful in the early stages of disaster response by facilitating geographic targeting and management of humanitarian assistance.
The tsunami on December 26, 2004, devastated coastal areas in the Indian Ocean region and resulted in massive mortality and displacement. The tsunami received significant media attention and an enormous international response, both in terms of financial aid and humanitarian assistance. Indonesia’s Aceh province was most affected by the tsunami because of both its proximity to the earthquake epicenter and its large coastal population. Approximately 1 year after the tsunami, Indonesian government estimates totaled 129 775 deaths, 38 786 missing, and 504 518 tsunami-displaced persons in Aceh Province.1
Over the past several decades, natural disasters have become more frequent, and the populations affected by disasters annually have been increasing.2 The frequency and impact of natural disasters has led to a need to improve the understanding of vulnerability. Development of methods for the estimation of the numbers of deaths and death rates and population impacts using data obtained in the postdisaster context offers the possibility of assessing the impact of disasters in the context of widespread displacement and in the face of often inadequate demographic data.
Although information on the tsunami-affected population in Aceh Province is available from both the Indonesian Bureau of Reconstruction and Recovery (BRR) and the Indonesian Central Bureau of Statistics, development of a methodology to estimate mortality in the absence of predisaster demographic information was seen as useful, because in many natural disasters, particularly those in less developed countries, accurate population data are not available for impact estimation. Currently available data from BRR and Indonesian Central Bureau of Statistics, as well as forthcoming findings on tsunami impact, are useful for comparing the accuracy of findings from the present study and for assessing goodness-of-fit of models developed.
The full impact of the 2004 tsunami in Aceh Province, in terms of lives lost, may never be completely measured; however, there is clear evidence of differential impact by both age and gender, where children, older adults, and women were disproportionately affected. In an instantaneous hazard, such as an earthquake or a tsunami, it might be expected that deaths would occur more uniformly than in other disasters, such as droughts, which result in food insecurity and famine, mortality differentials within the population would be expected as a result of a variety of selection factors that play out over time. The continued development of mortality estimation methods can provide insight for impact estimation in future disasters where population data and resources are scarce.
We sought to estimate the mortality impact of the 2004 tsunami in Aceh Province, Indonesia, using data from surveys of the tsunami-displaced population and vulnerability models that were developed after the disaster.
METHODS
In January and February 2005, Johns Hopkins School of Public Health and Mercy Corps conducted an assessment of tsunami impact, needs, and resettlement intentions of displaced populations in the districts of Nagan Raya and Aceh Barat. The assessment also included information on mortality. Between March and August 2005, 3 additional surveys, which also incorporated household mortality, of tsunami-displaced populations in 7 other districts were conducted. Mortality rates from the 4 surveys were combined with community-level information and a vulnerability model developed by the Center for International Earth Sciences Information Network at Columbia University in New York City to estimate and map tsunami mortality in Aceh Province, compare model outcomes with official mortality figures, and provide recommendations for how disaster assessments can be carried out using only postdisaster demographic information.
Mortality Models
Model results were compared with each another and with mortality estimates as reported by the Indonesian government to identify the model with the most plausible findings. Two methodologies were considered: (1) application of mortality rates to the pretsunami population at risk, which was developed based on a vulnerability model overlaid on spatially distributed demographic data (described later) and other available demographic data, which categorized communities as affected,3 and (2) a model where mortality was derived from the tsunami-displaced population as reported by district authorities, the Humanitarian Information Centre, the United Nations Information Management Service (UNIMS), and BRR.1 Both methods used a similar set of assumptions and calculations, including the application of region-specific mortality rates determined in population-based surveys and a correction to account for survivor bias; the primary difference between the models was the source and type of population data.
The model that calculated mortality based on estimates of the surviving displaced population produced estimates that best approximated official mortality figures. Only the model based on the surviving displaced population is described in the “Methods” and “Results” sections; however, limitations of the model based on the pretsunami population at risk are presented in the Discussion. Mortality rates were obtained from 4 surveys of tsunami-displaced populations that were conducted between February and August 2005 (Figure 1▶). All of the surveys used a 20-cluster design, used probability proportional to size sampling, and surveyed approximately 400 households (see Doocy4 for a detailed description of survey methodologies). The combined survey population encompassed a total of 1653 tsunami-displaced households with a pretsunami population of 9635 individuals.
FIGURE 1—
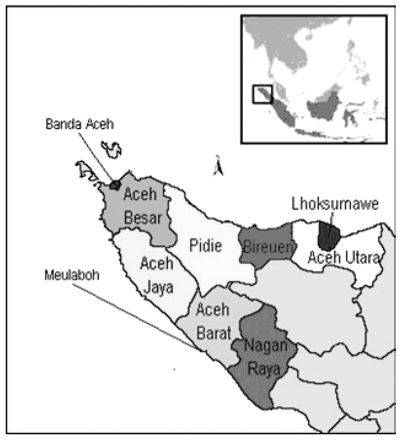
Tsunami–affected areas of Aceh Province, Indonesia, and survey regions: 2004.
Vulnerability Mapping
Environmental factors of vulnerability in the disaster context include physiogeographic features, which serve as a background for natural hazards.5,6 These parameters were used in geographic information systems (GIS)–based spatial modeling to produce an environmental vulnerability index based on vulnerability along coastal areas of the northern Sumatra peninsula.7 Standard GIS extraction and analysis techniques were applied to terrain data from the Shuttle Radar Topographic Mission global data set (sites containing Shuttle Radar Topographic Mission data include ftp://e0srp01u.ecs.nasa.gov and http://seamless.usgs.gov).8–11
The spatial model of the environmental vulnerability index was based on the following characteristics: aspect greater than 180°, which reflects the orientation of the coastline to the tsunami epicenter; slope less than 15°, which affects wave characteristics including height and inland distance; elevation less than 10 m, which reflects the area most likely to be affected by the tsunami; and maximum inundation depth = 4 km, which served to limit the area at risk within a 4-km distance of the coastline. Figure 2▶ shows an elevation map of Aceh province overlaid with “areas at risk” identified in the model, which are represented by the shaded areas on the coastline.
FIGURE 2—
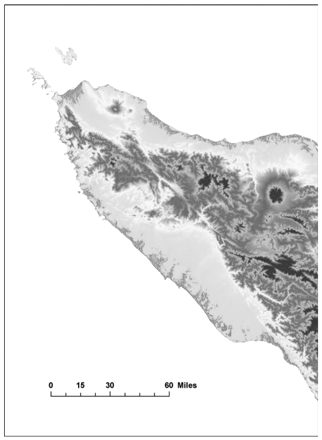
Areas at risk for tsunami impact based on geographic information systems and vulnerability model: Aceh Province, Indonesia, 2004.
Spatially distributed population data from the Global Rural Urban Mapping Project12 and “areas at risk” identified in GIS-based vulnerability models were aggregated by district to produce the density of the population at risk, and an environmental vulnerability indicator was constructed to represent the severity of impact of the tsunami based on environmental conditions. The following equation was constructed to estimate the environmental vulnerability index: (population at risk divided by area at risk) multiplied by coastline length (units are expressed as population at risk per unit meter of the coastline), which was compared with mortality estimates. To express the influence of the orientation of the shoreline in relation to tsunami epicenter, negative values were assigned to the coastline lengths within 0 to 180° of aspect, and positive values were assigned to the coastline lengths with orientation greater than 180°.
RESULTS
Mortality Models
Tsunami deaths estimated by the model using displaced populations were similar to low-end mortality estimates reported by the United Nations and the Indonesian government.1 The model is presented in Table 1▶ and illustrates the displaced population (as estimated by the United Nations or other sources), survey mortality rates, unadjusted mortality, survivor bias mortality, and estimates of population at risk and tsunami mortality by district; tsunami mortality figures as reported by UNIMS and BRR are also presented for comparative purposes. Total tsunami mortality was estimated at 131 066, with 61 827 (47.2%) deaths among males and 69 239 (52.8%) deaths among females.
TABLE 1—
Populations at Risk and Mortality Estimates for the 2004 Tsunami: Aceh Province, Indonesia
| Unadjusted Mortality |
Accounting for Survivor Bias |
|||||||||
|---|---|---|---|---|---|---|---|---|---|---|
| District | Surviving Displaced Population,a no. | Mortality Rate, %b | Unadjusted Population at Risk, no. | Unadjusted Mortality Estimate, no. | Household Mortality Rate, %c | Estimated Households Lost, no. | Additional Individual Mortality,d no. | Model Population at Risk, no. | Model Estimated Mortality, no. | BRR Reported Mortality, no. |
| Nagan Raya | 11 814 | 10.2 | 13 019 | 1 328 | 2.2 | 49 | 284 | 13 303 | 1 612 | 1 077 |
| Aceh Barat | 47 325 | 16.1 | 54 944 | 8 846 | 5.8 | 553 | 3 210 | 58 154 | 12 056 | 10 874 |
| Aceh Jaya | 32 611 | 23.6 | 40 307 | 9 512 | 35.6 | 2 474 | 14 349 | 54 657 | 23 862 | 16 797 |
| Aceh Besar | 146 307 | 23.6 | 180 835 | 42 677 | 10.5 | 3 271 | 18 973 | 199 809 | 61 650 | 92 166 |
| Banda Aceh | 67 402 | 22.0 | 82 230 | 18 091 | 9.5 | 1 347 | 7 812 | 90 042 | 25 903 | |
| Pidie | 42 634 | 6.1 | 45 235 | 2 759 | NA | NA | NA | 45 235 | 2 759 | 4 401 |
| Bireuen | 34 583 | 2.8 | 35 551 | 995 | NA | NA | NA | 35 551 | 995 | 461 |
| Aceh Utara and Lhoksumawe | 50 927 | 4.2 | 53 066 | 2 229 | NA | NA | NA | 53 066 | 2 229 | 2 098 |
| Total survey area | 433 603 | 23.7 | 505 251 | 86 174 | 10.1 | 43 783 | 7 549 | 549 033 | 131 066 | 128 063 |
Note. BRR = Bureau Reconstruction and Recovery; UNIMS = United Nations Information Management System; NA = Data not available, because overall mortality on the east coast was low. On the basis of anecdotal reports and the regression model, which also placed household mortality at zero, no adjustments for survivor bias were made.
aFrom Humanitarian Information Centre or UNIMS or BRR displaced population estimates.
bSurviving proportion of exposed population from surveys of displaced populations.
cFrom regression equations derived from Mercy Corps village profile data.
dCalculated by multiplying the estimated number of households lost by average pretsunami household size from displaced-population survey data.
It should be noted that mortality rates from survey data are based on a dichotomous classification of survived versus presumed dead. The presumed dead category incorporates known deaths, as well as individuals who were reported as missing. The BRR mortality estimates presented in Table 1▶ represent only individuals known to be dead and exclude estimates of the missing. Mortality among households that were not displaced is excluded as a result of survivor bias and the survey population (tsunami-displaced households only). The subsequent model did not seek to predict mortality among populations that were not displaced.
Mortality rates are presented for the survey population, the population at risk, and the district in Table 2▶. Survey population mortality rates represent mortality among displaced households with at least 1 surviving member. Mortality rates for the population at risk account for survivor bias and are indicative of mortality among displaced households and those households with no survivors. District mortality rates are estimates for the entire administrative unit and use the pretsunami district population (i.e., unaffected inland populations are incorporated in the denominator).
TABLE 2—
2004 Tsunami Mortality Rates by Population Type: Aceh Province, Indonesia
| Aceh Province District | Survey Population Mortality Rate, % | Population at Risk Mortality Rate, % | District Mortality Rate, % |
|---|---|---|---|
| Nagan Raya | 10.2 | 12.1 | 1.3 |
| Aceh Barat | 16.1 | 20.7 | 8.1 |
| Aceh Jaya | 23.6 | 43.7 | 27.2 |
| Aceh Besar | 23.6 | 30.9 | 21.0 |
| Banda Aceh | 22.0 | 28.8 | 11.5 |
| Pidie | 6.1 | 6.1 | 0.6 |
| Bireuen | 2.8 | 2.8 | 0.3 |
| Aceh Utara/Lhoksumawe | 4.2 | 4.2 | 0.4 |
| Survey Areaa | 14.1 | 23.7 | 5.6 |
aWeighted rates.
Vulnerability Mapping
The GIS-based vulnerability model was compared with district mortality estimates. Correlation between the environmental vulnerability index and mortality estimates produced a satisfactory result with r2 = 0.55 (Figure 3▶). The environmental vulnerability index ranged from 38 to 36; 3 provinces on the northern shore—Bireuen, Pidie, and Aceh Utara—produce the negative values because of the orientation of the coastline (opposite to the propagation of tsunami wave). These provinces have the lowest environmental vulnerability index values, and a small part of the Aceh Besar coastline also has similar conditions; however, this analysis was conducted only at the district level. Aceh Jaya was the 1 outlier that had very high estimated population mortality and a relatively low environmental vulnerability index.
FIGURE 3—
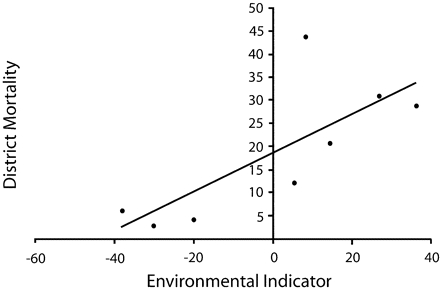
The relationship between the vulnerability model and the 2004 tsunami mortality: Aceh Province, Indonesia.
Note. Equation for line: y = 0.4208x + 18.508. R2 = 0.5834.
DISCUSSION
In the case of Aceh, mortality estimates based on the tsunami-displaced population were more accurate than estimates based on the size of the population at risk; consequently, models using displaced population estimates were used. The mortality survey and the subsequent mortality model encompassed a region that included 97.5% of reported tsunami deaths in Aceh1; thus, the model incorporated an area where the vast majority of mortality occurred. Estimated model mortality (131 066) for the survey area was similar to mortality as reported by BRR (128 063); however, it was a conservative estimate. Model mortality was based on a classification of presumed dead where individuals reported as dead or missing were classified as dead; when official UNIMS and BRR figures of dead and missing were combined, official estimates of tsunami mortality were as high as 168 561. Based on this overall estimate of mortality, it appears that the model may underestimate total mortality, and the primary reason identified for underestimation is that the model did not account for mortality among households that were not displaced (see “Limitations” section).
In most districts, model mortality estimates were relatively similar to but greater than mortality as reported by UNIMS and BRR (exceptions include Banda Aceh, Aceh Besar, and Bireuen). Aceh Jaya was the only district where the model mortality differed substantially from official figures: the model mortality estimate was 23 862 as compared with UNIMS and BRR estimates of 16 797 dead and 77 missing (16 874 presumed dead). Official mortality estimates for Aceh Jaya have been criticized previously as low, and mortality rates of up to 66% for coastal communities have been suggested.13 Modeling of mortality in Aceh Jaya was particularly difficult for the following reasons: (1) it was the most affected district, (2) there is relatively little information available as compared with other districts, and (3) survivor bias estimations account for a large proportion of mortality, and these estimates are made with less certainty than those derived from survey-based mortality rates (see “Limitations”).
Mortality rates among the survey population in Banda Aceh, Aceh Besar, and Aceh Jaya were substantially greater than among other districts and ranged from 22.0% to 23.6%. Survey population mortality rates in the districts of Aceh Barat and Nagan Raya were moderate, 16.1% and 10.2%, respectively, and lower mortality was observed on the east coast where survey population mortality rates ranged from 2.8% to 6.1% in the districts of Pidie, Bireuen, Lhoksumawe, and Aceh Utara. The impact of the tsunami, in terms of numbers that perished, was greatest in the district of Aceh Besar, where the model estimated mortality at 61650.
When relative impact is assessed in terms of mortality among the population at risk within the district, Aceh Jaya was clearly the most impacted, with a rate 43.7%, followed by Aceh Besar (30.9%) and Banda Aceh (28.8%). After the trend observed in survey population mortality rates, estimated mortality among the population at risk was intermediate for Meulaboh area districts (Aceh Barat and Nagan Raya) and relatively low for east coast districts (Pidie, Bireuen, Lhoksumawe, and Aceh Utara).
When assessing district-level mortality rates, the impact on Aceh Jaya was clearly the greatest, with an estimated district mortality rate of 27.1%. This finding was not surprising, considering the geography of the region where the district is largely mountainous and communities were concentrated along the coastline. Other districts with relatively high impact included Aceh Besar, Banda Aceh, and Aceh Barat, where district mortality rates were estimated at 21.0%, 11.5%, and 8.1%, respectively. In the remaining districts of Nagan Raya, Pidie, Bireuen, Lhoksumawe, and Aceh Utara, district mortality rates were estimated at less than 2% of the total pretsunami population, suggesting that tsunami impact was substantial but relatively low in comparison with the most affected districts.
Limitations
Mortality among households that were not displaced is not accounted for in the survey-based mortality model. Consequently, mortality estimates were likely to underestimate actual mortality because deaths among individuals in households that were not displaced were excluded. Model-estimated mortality was similar to official mortality figures; however, when compared with those reported as dead or missing, model mortality estimates were low. In future mortality assessments, incorporation of affected but nondisplaced populations would help to characterize impact among this group and provide more inclusive mortality estimates.
Another limitation encountered in the model was with the estimation of tsunami impact in Aceh Jaya. Relatively little information was available for Aceh Jaya in comparison with other districts; however, it was clearly the most devastated. Because of the high overall mortality in the district, the impact of survivor bias on model estimates was particularly large. However, without an independent (i.e., nonsurvey) point estimate for individual mortality, survivor bias could not be estimated. As a result, survivor bias and model mortality were somewhat dependent on external mortality estimates. The regression equations used to predict the numbers of households lost were based on community data in 3 districts adjacent to Aceh Jaya but not Aceh Jaya itself. Although only the most severely impacted communities were used in the regression model to account for the degree of impact in Aceh Jaya, it is possible that these equations did not accurately represent the individual-to-household mortality ratio in Aceh Jaya, because they derived from surrounding districts with lesser tsunami impact.
The principal limitations of GIS methodologies are spatial incompatibilities of scale and resolution between various GIS layers, in this case, population data and topographic attributes associated with tsunami-affected areas. An increasing number of global and regional data sets with moderate and high resolutions are available, but demographic data need to be more compatible with topographic data layers. Furthermore, cross-validating newly constructed geographies with traditional “ground-truthing” techniques (including estimating uncertainty associated with original data collection) are hard to use in the context of rapid response. Use of the highest-resolution commercial satellite imagery (QuickBird [Digital Globe, Longmont, Colo] or Ikonos [Land Info, Highlands Ranch, Colo]), however, may (depending on availability) fill in where ground-based knowledge cannot, although acquisition of these data, particularly over a large region, can be quite expensive and require additional expertise to process and interpret. A final limitation relates to the absence (in many cases) of comprehensive documentation and metadata from original data sets that can be used for analysis and spatial modeling. There is no substitute for good documentation of secondary data sources.
Lastly, we sought to assess the immediate mortality impact of the tsunami, but in large-scale natural disasters, the economic and living conditions of vulnerable populations can be affected over a period of years, and deteriorations in infrastructure and economic status, among other things, are likely to contribute to mortality over an extended time period that is ultimately associated with the natural disaster. Additional research on the long-term effects of the tsunami on demography, in particular, fertility and mortality, of the Acehenese population would provide insight into the prolonged effects of natural disasters.
Conclusions
Quantifying mortality from natural disasters is important for planning and resource allocation in the postdisaster context; in addition, understanding disaster impact and risk factors for mortality can aid in anticipating the consequences of future disasters and in developing risk reduction strategies. In developing mortality estimates, the importance of baseline data, or denominators for mortality rates, cannot be underestimated and is a primary constraint in the postdisaster context. Another complication is that basic demographic techniques for indirect mortality estimation are not ideal when there are no survivors (i.e., entire households perish), because mortality among the hardest-hit segment of the population may be overlooked or underestimated. New methods, which encompass data from multiple levels and sources and use varied approaches to assess the agreement of estimates, are necessary to adequately quantify mortality in high-impact disasters, such as the Asian tsunami.
The use of GIS models with environmental variables coupled with predisaster population estimates can create a map of the spatial distribution of populations at risk and expected mortality. This can be done immediately after the disaster and be used for both operational activities of humanitarian agencies in immediate disaster response and planning of postdisaster assessments. Demographic surveys of disaster-affected populations that are planned based on GIS models may provide more accurate estimates of mortality because of improved sampling capabilities. Our methods included GIS-based vulnerability models, a population-based survey of surviving households, and mortality estimation from survey data in combination with information reported from local authorities. Although agreement of mortality estimates was observed, integration of multiple methods and improvement in the use of rapidly available GIS-based information in field assessments and the early stages of disaster response could improve the quality of postdisaster assessment and planning and the provision of humanitarian assistance in future natural disasters.
Peer Reviewed
Contributors G. Burnham and S. Doocy led the study design for population surveys. Y. Gorokhovich was responsible for study design of the vulnerability mapping component. Data collection was supervised by S. Doocy with the support of C. Robinson. Analysis and writing was conducted by S. Doocy and Y. Gorokhovich with support from D. Balk. All of the authors helped to conceptualize ideas, interpret findings, and review drafts of the article.
Human Participant Protection The study was reviewed and approved by the Committee on Human Research at the Johns Hopkins Bloomberg School of Public Health.
References
- 1.Tsunami Recovery Status Report. United Nations Information Management Service in collaboration with the Rehabilitation and Reconstruction Agency; Sumatra, Indonesia; 2005.
- 2.EM-DAT. Emergency Disasters Database Natural Disasters Trends, 1900–2005. Data published 2006. Available at: http://www.em-dat.net/disasters/trends.htm. Accessed April 4, 2006.
- 3.Sejathera IH, with the Asian Development Bank. Aceh Mapframe. Jakarta, Indonesia; 2005.
- 4.Doocy S. Tsunami mortality in Aceh Province, Indonesia. Bull World Health Org. 2007; In press. [DOI] [PMC free article] [PubMed]
- 5.Alcántara-Ayala I. Geomorphology, natural hazards, vulnerability and prevention of natural disasters in developing countries. Geomorphology. 2002;47: 107–124. [Google Scholar]
- 6.Rosenfeld C. The geomorphological dimensions of natural disasters. Geomorphology. 1994;10:27–36. [Google Scholar]
- 7.Yalciner, Perincek, Ersoy, Prasetya, Hidayat, McAdoo. Field survey (Jan. 21–31, 2005) at north of Sumatra island, UNESCO IOC field survey report, 2005. Available at: http://ioc.unesco.org/iosurveys/Indonesia/yalciner/yalciner.htm. Accessed October 12, 2005.
- 8.Rabus B, Eineder M, Roth A, et al. The shuttle radar topography mission- a new class of digital elevation models acquired by spaceborne radar. J Photogram Remote Sensing. 2003;57:241–262. [Google Scholar]
- 9.Werner M. Shuttle Radar Topography Mission (SRTM), Mission overview. J Telecom (Frequenz). 2001; 55:75–79. [Google Scholar]
- 10.Farr TG, Kobrick M. Shuttle radar topography mission produces a wealth of data. Trans Am Geophys Union. 2001;81:583–585. [Google Scholar]
- 11.Burrough P, McDonnel R. Principles of Geographic Information Systems. Oxford, England: Oxford University Press; 1998.
- 12.Center for International Earth Science Information Network (CIESIN), Columbia University; International Food Policy Research Institute (IPFRI), the World Bank; and Centro Internacional de Agricultura Tropical (CIAT). Global Rural-Urban Mapping Project (GRUMP): Gridded Population of the World, version 3, with Urban Reallocation (GPW-UR). Palisades, NY: CIESIN, Columbia University; 2004. Available at: http://sedac.ciesin.columbia.edu/gpw. Accessed March 16, 2006.
- 13.Brennan RJ, Rimba K. Rapid health assessment in Aceh Jaya District, Indonesia, following the December 26 tsunami. Emerg Med Australas. 2005;17: 341–350. [DOI] [PubMed] [Google Scholar]