

1. Introduction
Modern radiation treatment techniques like intensity-modulated-radiation-therapy (IMRT) involve a highly sophisticated treatment process. Principle steps including inverse-optimisation of the modulated fluence, sequencing the fluence into multi-leaf-collimator (MLC) motion trajectories, and calculating the dose distribution taking full accommodation of the complexity of leaf motion and dynamic small aperture variation in output factor. Present day planning systems make many assumptions and approximations to model these treatments [1]. These approximations can and do present significant discrepancies between 3D computer-calculated distributions presented to the physician and the reality of the dose delivered to the patient. The magnitude of this problem was highlighted in a recent study by the Radiological Physics Center (RPC), who implement the dosimetry credentialing service for institutions to participate in RTOG clinical trials in the US. A recent RPC study [2] found that >30% of institutions failed the Head and Neck IMRT benchmark test despite a generous acceptance criteria of 7% dose difference, and 4 mm distance-to-agreement (DTA). Moreover this analysis was performed on just a single plane through the Head and Neck IMRT phantom, and several point TLD measurements. The question immediately arises, as to how many more institutions would have failed the benchmark test had the dosimetry been a fully comprehensive 3D verification and not restricted to the one plane and TLD positions. This question can only be answered by a 3D verification system, presenting a compelling argument for its necessity, and a rationale for this work.
The present work represents our first experiences relating to IMRT verification using a relatively new 3D dosimetry system consisting of a PRESAGE™ dosimeter [3,4] (Heuris Inc, Pharma LLC) and an optical-CT scanning system (OCTOPUS™ – MGS Inc). The work builds in a step-wise manner on prior work in our lab. The first step was a detailed investigating of the basic dosimetric properties of PRESAGE™ on small volumes using an efficient in-house linear laser scanning system [4,5]. This was followed by application of a large volume PRESAGE dosimeter to verify a simple 3D dose-distribution [6], known to be well modelled by the planning system (ECLIPSE). Comparison of measured and planned distributions enabled evaluation of the PRESAGE™/OCTOPUS™ dosimetry system. Confidence was further established by comparison with secondary independent measurement by EBT film. All these investigations confirmed the accurate performance of PRESAGE™/OCTOPUS™ system, and provided a solid foundation to proceed to the present application: IMRT 3D dose verification.
2. Methods
A large volume cylindrical PRESAGE™ dosimeter (16 cm diameter and 14 cm long – figure 1a) was taken through the regular patient IMRT treatment procedure at Duke University, including CT-simulation, contour definition, treatment planning (inverse optimisation in ECLIPSE for an 11 field 6 MV plan) and delivery on a Varian OBI machine. A complex but arbitrary planning-target-volume (PTV) was created to simulate a highly challenging IMRT treatment. The PTV consisted of a face like appearance, when viewed on an axial slice, with the face gradually changing from a happy expression at one end of the dosimeter to a sad/angry expression at the other. The remainder of the dosimeter was designated as an organ-at-risk (OAR). After treatment, the PRESAGE dosimeter was scanned in the OCTOPUS scanner (figure 1b). Thirty-one slices were scanned over the irradiation volume, each reconstructed from 100 projections at 1.8 degree increments. In-plane pixel size was 0.5 mm and the slice separation was 2 mm. The change in optical attenuation throughout the dosimeter was determined by subtracting a prescan of the dosimeter acquired before irradiation. Conversion to relative dose was achieved using a linear calibration curve.
Figure 1.
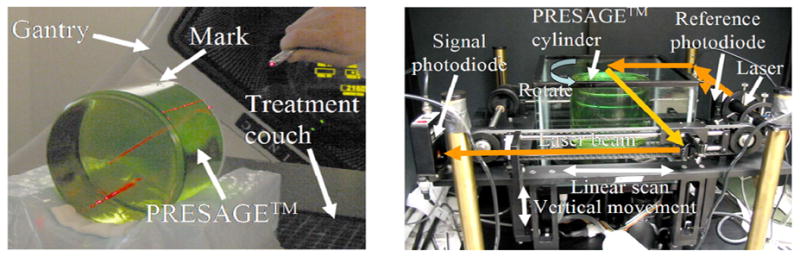
PRESAGE™ dosimeter in treatment position (left image), and in the OCTOPUS™ optical-CT scanner during imaging (right image). The arrows on the scanner indicate laser light ray paths.
3. Results
Comparison gray-scale dose maps from selected axial planes stepping through the dosimeter are shown in figure 2a–f. The general isodose overlays (not shown) show good agreement between the ECLIPSE and PRESAGE distributions, and the trends of the ECLIPSE plan are clearly seen in the PRESAGE distribution, including the face trend from happy to sad. The PRESAGE dose is less accurate close to the edges of the flask. Two possible causes are loss of sensitivity in the dosimeter, or refractive edge effects (7). The latter are discounted as they would tend to pull the isodose lines up at the edges. A more likely explanation is a loss of sensitivity at the edges. We have observed this in other older dosimeters that have been stored at room temperature for several months prior to irradiation. Dosimeters stored in the fridge and irradiated within 1 month do not exhibit this effect.
Figure 2.
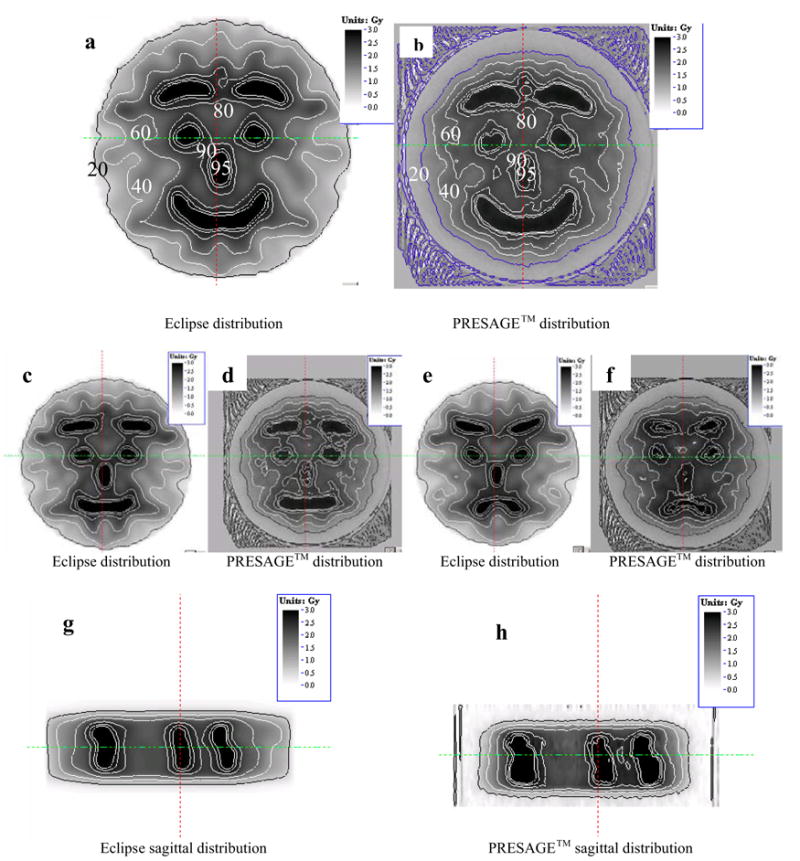
Comparison of isodose maps between the eclipse treatment planning system (a,c,e,g) and corresponding measurement from the PRESAGE/optical-CT dosimetry system (b,d,f,h). Pairs of images correspond to different planes or orientations as outlined in the main text.
Some differences between the measured and planned distributions are visible, and this is not surprising given the challenging nature of the distribution and known modelling inaccuracies in ECLIPSE. These discrepancies are better appreciated by a fuller analysis including gamma map plots, which will be presented. Additional cross- validation using EBT film will also be presented. Sagittal comparison of the distributions indicating the full 3D nature of the verification are shown in figures 2g–h.
4. Conclusions
The present results, when combined with other data from our lab not shown here, confirm the feasibility of PRESAGE™/OCTOPUS™ 3D dosimetry system for IMRT verification.
Contributor Information
Mark Oldham, Dept of Radiation Oncology, Duke University Medical Center, Durham, NC, USA.
Pengyi Guo, Dept of Radiation Oncology, Duke University Medical Center, Durham, NC, USA.
Gary Gluckman, Dept of Radiation Oncology, Duke University Medical Center, Durham, NC, USA.
John Adamovics, Dept of Chemistry and Biology, Rider University, Lawrenceville, NJ, USA.
References
- 1.Davidson S, Followill D, Ibbott G, Prado K. The evaluation of several commercial IMRT treatment planning systems heterogeneity dose calculation algorithms using an anthropomorphic thorax phantom. Med Phys. 2005;32:1988. [Google Scholar]
- 2.Molineu A, Hernandez N, Alvarez P, Followill D, Ibbott G. IMRT head and neck phantom irradiations: Correlation of results with institution size. Med Phys. 2005;32:1983–1984. [Google Scholar]
- 3.Adamovics J, Maryanski MJ. OCT scanning properties of PRESAGE - A 3D radiochromic solid polymer dosimeter. Med Phys. 2004;31:1906. [Google Scholar]
- 4.Guo P, Adamovics J, Oldham M. PRESAGE - A promising new material for 3D dosimetry. Int J Radiat Oncol Biol Phys. 2005;63:S206. [Google Scholar]
- 5.Guo P, Adamovics J, Oldham M. Charaterization of a new radiochromic three-dimensional dosimeter Med. Phys. 2006;33:1338–1345. doi: 10.1118/1.2192888. [DOI] [PMC free article] [PubMed] [Google Scholar]
- 6.Guo P, Adamovics J, Oldham M. A practical three-dimensional dosimetry system for radiation therapy. Med Phys. 2006 doi: 10.1118/1.2349686. In Press. [DOI] [PMC free article] [PubMed] [Google Scholar]
- 7.Oldham M, Kim L. Optical-CT gel-dosimetry. II: Optical artifacts and geometrical distortion. Med Phys. 2004;31:1093–1104. doi: 10.1118/1.1655710. [DOI] [PMC free article] [PubMed] [Google Scholar]