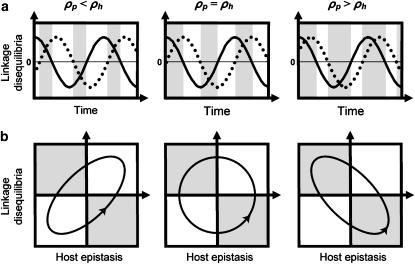
Figure 6.—
Schematic description of (a) the fluctuations in host and parasite linkage disequilibria over time and (b) the multiplicative epistasis induced in the host vs. the host linkage disequilibrium between selected loci A and B, in the coevolutionary model. In a we show how the ratio between host and parasite recombination rates affects the phase shift between host disequilibrium (solid curves) and parasite disequilibrium (dashed curves). Higher parasite recombination rates allow the parasite to track host genotype frequencies more closely. In b we show how the ratio between host and parasite recombination rates affects the geometry of the cycles between linkage disequilibrium and epistasis in the host. The fact that host linkage disequilibrium and epistasis more often have opposite signs (shaded regions) as parasite recombination increases indicates that there is more often a short-term benefit to breaking down disequilibrium in the host. This explains why higher parasite recombination selects for higher host recombination (assuming that the cycles are maintained,  ).
).

