

Abstract
Few neuro-imaging studies of the auditory system have examined the dependence of brain activation on sound bandwidth, a fundamental stimulus parameter, and none have examined bandwidth dependencies in the brainstem. The present study examined the effect of bandwidth on human brainstem activation using fMRI, an indicator of population neural activity. The studied stimuli (broadband, two-, one-, and third-octave continuous noise) activated three brainstem centers: cochlear nucleus, superior olivary complex, and inferior colliculus. Activation could be confidently attributed to these nuclei because it was appropriately punctate (given the small size of the imaged nuclei) and appropriately located (as determined from histological atlases). Activation in all three imaged centers increased monotonically with increasing bandwidth when either stimulus spectrum level or energy was held constant. Supplementary experiments indicated that the measured bandwidth dependencies were not contaminated by the extraneous sounds produced by the scanner. Increases in fMRI activation with increasing bandwidth would be expected from populations of neurons having a single best frequency and only excitatory responses to sound, but not necessarily from lower auditory system neurons with their often more complex responses. Our results provide basic information for designing auditory neuro-imaging studies that need to control for, or manipulate sound bandwidth.
Keywords: Functional imaging, Human auditory processing, Cochlear nucleus, Superior olivary complex, Inferior colliculus
1. Introduction
Growing interest in functional neuro-imaging of the human central auditory system has prompted numerous studies examining the relationship between fundamental stimulus parameters and brain activation. Both positron emission tomography and functional magnetic resonance imaging (fMRI) studies have examined the effects of sound level and rate, providing insights into auditory processing as well as basic data on which to base experimental designs (Price et al., 1992; Binder et al., 1994;Jäncke et al., 1998; Lockwood et al., 1999; Mohr et al., 1999; Giraud et al., 2000; Tanaka et al., 2000;Brechmann et al., 2002; Hall et al., 2001; Sigalovsky et al., 2001; Harms and Melcher, 2002; Hart et al., 2002,Hart et al., 2003; Lasota et al., 2003). There are, however, few data concerning another basic variable, namely sound bandwidth, and no data pertaining to bandwidth effects at brainstem levels of the pathway (Hall et al., 2001; Wessinger et al., 2001). Here, we attempt to fill this void by examining the effect of sound bandwidth on human brainstem activity using fMRI, an indicator of population neural activity.
The present study included two methodological components important for imaging auditory activity in the brainstem. One involved synchronizing fMRI image acquisitions to the subject’s cardiac cycle as a way to improve the detection of brainstem activation (Guimaraes et al., 1998). The second involved imaging a single brain slice, rather than multiple slices, in order to reduce the extraneous sounds produced during imaging. This “single slice” approach for reducing the imaging sounds was used instead of more common methods (“sparse imaging”, Hall et al., 1999; “clustered volume acquisition”, Edmister et al., 1999) because: (1) it yields 4-5 times more data per unit time and (2) much of the brainstem auditory pathway can be captured in a single slice (because of the small size and spatial arrangement of nuclei; Kiang et al., 1984;Fig. 1). To ensure that the imaged slice would intersect the structures of interest, it was positioned based on gross anatomical landmarks and measurements determined from brainstem atlases. Supplementary experiments were conducted to test whether the single slice approach provided adequate reduction of the scanner sounds. The results indicate that it did.
Fig. 1.
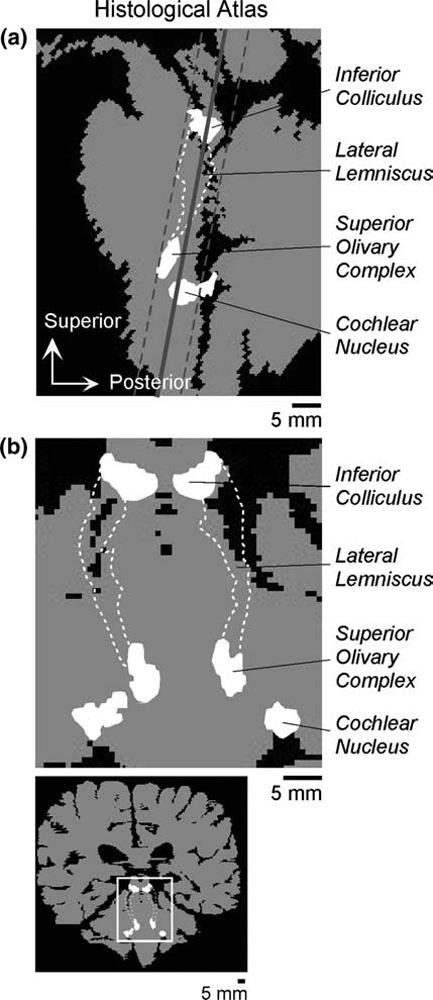
Brainstem auditory structures in a histological atlas of one human brain. (a) Sagittal view of the brainstem. Auditory structures have been projected onto a mid-sagittal slice (140 μm thick). The boundaries shown for the inferior colliculus correspond to the central nucleus. Boundaries for the superior olivary complex include periolivary, as well as principal nuclei. The cochlear nucleus boundaries include both the ventral and dorsal divisions. The white dashed lines enclose both the nuclei (dorsal and ventral) and fiber tracts of the lateral lemniscus. Brain tissue outside the classical auditory pathway is shaded gray. The portion of the (dorsal) cochlear nucleus overlapping cerebrospinal fluid (black) of the fourth ventricle is actually located lateral to the displayed mid-sagittal slice. The solid and dashed gray lines indicate, respectively, the center and edges of the imaging plane used in the present study. (b) Auditory brainstem structures viewed in the imaging plane. Gray indicates brain tissue in a slice defined by the solid line in (a). The auditory structures have been projected onto this slice. The area shown in the top panel of (b) is indicated on the wholebrain section in the bottom panel. Atlas resolution: 140 × 140 × 700 μm. Scale bars indicate distances corrected for an estimated tissue shrinkage of 20%.
Our main experiments parametrically varied the bandwidth of a continuous noise stimulus and examined the resulting fMRI activation in three brainstem auditory centers: cochlear nucleus, superior olivary complex, and inferior colliculus. As bandwidth was varied, stimulus center frequency was held constant (at 1 kHz) and stimulus level was equalized across bandwidths by holding either spectrum level or energy constant. Continuous noise was chosen as the stimulus because it is a potent activator of brainstem nuclei (Melcher et al., 2000; personal observations of the authors). Our data indicate that population neural activity (as reflected by fMRI activation) in all of the imaged brainstem centers increases monotonically with increasing stimulus bandwidth.
2. Methods
2.1. Subjects
A total of 10 paid volunteers were imaged. All had normal hearing (20 dB HL or less at all standard audiometric frequencies from 250 Hz to 8 kHz). Four were female, and nine were right-handed. Written informed consent was obtained from each subject prior to testing. All procedures were approved by human studies committees at the Massachusetts Eye and Ear Infirmary, Massachusetts General Hospital, and Massachusetts Institute of Technology.
2.2. Sound stimuli
Stimuli were broadband continuous noise and bandlimited noise with a center frequency of 1 kHz and bandwidth of a third, one, or two octaves. The level of broadband noise was 50-55 dB SL (measured for each subject in the scanner room in the absence of scanner-generated sounds, i.e., no images were being acquired and the scanner coolant pump was off). The level of the band-limited stimuli was matched in either spectrum level or overall energy to the broadband stimulus. Four subjects were presented with all seven stimuli (broadband and the three band-limited stimuli matched in either spectrum level or energy). Six subjects were presented with two stimuli (the broadband stimulus and the third octave stimulus matched in energy). The broadband noise (uniform and white) was spectrally shaped only by the frequency response of the stimulus delivery system. The band-limited stimuli were produced by filtering the broadband noise using Chebychev filters with ripple in the pass-band of less than 6 dB and attenuation in the stop-band of approximately 40 dB (filter orders between 2 and 11).
Stimuli were presented in 30- or 32-s segments (ramped on and off linearly over 2.5 ms) alternated with equal duration “off” periods during which no stimulus was presented. Seven alternations between “stimulus on” and “off” periods constituted a single scanning “run”. In experiments using all seven stimuli, each stimulus was presented once per run and the order of stimuli varied across runs. In experiments using two stimuli, the stimuli were alternated within each run.
For subjects studied with all seven stimuli, stimulus levels in dB SPL were as follows. Broadband: 86 ± 4; equal energy band-limited: 86 ± 4 (third octave), 88 ± 4 (one), 89 ± 4 (two); equal spectrum level: 70 ± 4 (third), 78 ± 4 (one), 82 ± 4 (two). For subjects studied with two stimuli, they were 81 ± 5 (broadband) and 80 ± 5 (third octave). These levels were calculated (over a 30-s time-window) based on the measured gain and frequency response of each component of the sound delivery system. The transfer characteristics of the headphone assembly were measured using a Larson Davis artificial ear (AEC101) and microphone (2559).
2.3. Sound delivery
Stimuli were delivered binaurally through a headphone assembly that also provided attenuation of scanner-generated sounds. Specifically, stimuli were produced by a digital-to-analog board, amplified, and fed to a pair of piezoelectric transducers housed in earmuffs (custom-built by GEC Marconi, Inc.). The frequency response of the acoustic system was flat to within ∼12 dB from 50 Hz to 10 kHz, except for a 30 dB notch near 4 kHz.
2.4. Handling scanner-generated sounds
Extraneous sounds produced by the scanner came from two sources (Ravicz et al., 2000) and were handled in several ways. One source was the scanner coolant pump. Sounds from this source were eliminated by turning the pump off during functional imaging. A second source was the scanner gradient coils which produced sound each time an image was acquired. The gradient sound associated with each image acquisition had a duration of ∼60 ms and was dominated by a frequency component at 1.4 kHz. The sounds from the gradient coils were reduced in level by the attenuating earmuffs of the headset, resulting in a level under the earmuffs of ∼60 dB SPL1 (A-weighted over 30 s). The gradient sounds were also reduced in rate of occurrence by imaging a single slice rather than multiple slices. In two imaging sessions, we tested the adequacy of our methods for handling the gradient sounds by reducing the rate of occurrence of these sounds even further (by a factor of 4). The stimuli used for these tests (broadband and third-octave noise) sampled opposite extremes of the bandwidth range.
2.5. Imaging
Images were collected using a Siemens Allegra 3 T scanner and head coil. Each imaging session included the following:
Contiguous sagittal images of the whole head were acquired.
Using the sagittal images, the brain slice to be functionally imaged was selected. The slice intersected the inferior colliculi (visualized directly;Fig. 2, top panels). It also intersected the brainstem approximately two-thirds of the way from the ventral-most part of the ponto-medullary junction to the floor of the fourth ventricle (measured along the shortest possible trajectory joining these landmarks in the mid-sagittal plane, i.e., the dashed line in Fig. 2, bottom right). Measurements from histological atlases of the human brainstem indicated that a 6 mm thick slice with this orientation would almost completely encompass the brainstem auditory pathway (Fig. 1).
A T1-weighted, high-resolution anatomical image was acquired of the selected brain slice for subsequent overlay of the functional data (thickness = 6 mm; in-plane resolution = 0.78 × 0.78 mm; TR = 700 ms, TE = 12 ms, flip = 70°).
Functional images of the selected slice were acquired approximately every 2 s (or approximately every 8 s during the two sessions examining the effects of reduced scanner noise). The images were obtained using a blood oxygenation level dependent (BOLD) sequence (gradient echo, TE = 30 ms, flip = 90°, slice thickness = 6 mm, in-plane resolution = 3.13 × 3.13 mm).
Fig. 2.

Functional imaging plane superimposed on sagittal, anatomical images 5 mm from the midline (top panels) and at the midline (bottom panels). The plane (thick white line) passed through the inferior colliculi (top panels). It also intersected the brainstem approximately two-thirds of the way from the ventral-most part of the ponto-medullary junction to the floor of the fourth ventricle (measured along the shortest trajectory joining these landmarks; dashed line, bottom right panel). Rectangles in the left panels indicate area of the enlargements in the right panels.
Functional imaging was performed using a cardiac gating method known to improve the detection of activation in the inferior colliculus (Guimaraes et al.,1998). Image acquisitions were synchronized to every other QRS complex in the subject’s electrocardiogram, and the inter-image interval (TR, ∼2 s) was recorded. Fluctuations in heart rate led to variations in TR that resulted in image-to-image variations in image signal strength (i.e., a “T1 effect”). Image signal was corrected to account for these variations using the measured TR values (Guimaraes et al., 1998). In the two sessions examining the effects of reduced scanner noise, there was a minimum 7.5 s interval between image acquisitions, and each acquisition was synchronized to the first QRS complex following this minimum interval. The result was an average TR of ∼8 s. Since the resulting TR was long (∼8 s), any T1 effects were negligible so corrections to image signal were not necessary.
2.6. Regions of interest
Activation was quantified within regions of interest (ROIs) corresponding to the left and right inferior colliculi, superior olivary complexes, and cochlear nuclei. The ROIs were first identified in the T1-weighted, high-resolution anatomical images (in-plane resolution 0.78 × 0.78 mm). They were then down sampled to the resolution of the functional images (3.13 × 3.13 mm).
Since the borders of the superior olivary complex and cochlear nucleus were not visible in the anatomical images, computerized atlases based on serial histological sections were used to delimit the ROIs enclosing these structures. The histological material for two of the brainstem atlases has been described previously (Kiang et al., 1984; Levine et al., 1993). The material for a third was processed according to the method of Yakovlev(1970) and consisted of 35 μm Nissl- and myelin-stained sections (every 20th and 21st). Distances measured from the atlases (to define the ROIs) were corrected for an assumed 20% tissue shrinkage (due to fixation) in order to obtain distances appropriate for living brains.
The ROIs were defined as follows. The circular borders of the inferior colliculi could be seen directly in the anatomical images (e.g., Fig. 3). Any voxel lying mainly within these borders was assigned to an “inferior colliculus” ROI. The cochlear nucleus ROI was located at the caudal edge of the pons and had medial and lateral edges 6 and 15 mm from the midline, respectively. (These medial and lateral distances, and all others given here, represent the minimum and maximum, respectively, across atlases.) The overall cochlear nucleus ROI was subdivided into separate ROIs for the dorsal and ventral cochlear nucleus at a distance 9 mm from the midline. The superior olivary complex ROI was rostral to that of the cochlear nucleus, extended 3-6 mm in the rostro-caudal dimension, and had medial and lateral edges 3 and 9 mm from the midline. At the resolution of the functional images (∼3 × 3 × 6 mm), the sizes of the ROIs were 1-4 voxels (inferior colliculus), 6-8 voxels (superior olivary complex), and 3-4 voxels (cochlear nucleus).
Fig. 3.
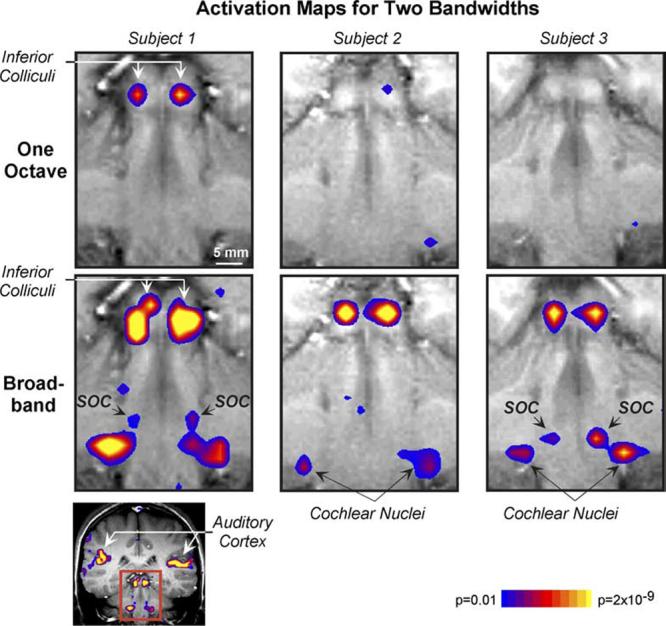
Brainstem activation for one octave (top) and broadband (bottom) continuous noise. Each panel shows a T1-weighted anatomical image (grayscale) and superimposed activation map (color). The area shown in each panel is indicated on the whole-brain image (bottom, left; rectangle). For the activation maps, regions are colored according to the result of a t test comparison of image signal strength during “stimulus on” and “off” periods. Blue and yellow correspond to the lowest (p = 0.01) and highest (p =2 × 10⁻⁹) significance levels, respectively. Both the activation maps and anatomical images have been interpolated. Images are displayed in radiological convention so each subject’s right is displayed on the left. Equal spectrum level stimuli. SOC, superior olivary complex.
2.7. Data analysis
The functional data were corrected for slight movements of the head (<2.5 mm, usually <1 mm) that may have occurred over the course of the imaging session. Each functional image of a session was translated and rotated to fit the first image of the first functional run using standard software (SPM95, Friston et al.,1995). Because only one slice was imaged, these translations and rotations were confined to the two dimensions of the imaging plane.
The functional images were further processed as follows: (1) Image signal versus time for each voxel and run was corrected for linear and quadratic drifts in signal amplitude over time. (2) Image signal was normalized such that the time-average signal had the same (arbitrary) value for all voxels and runs. This normalization was done to eliminate artificial discontinuities in the signal level between runs. (3) The time-series of images corresponding to individual functional runs were concatenated to form a single data set for each imaging session.
2.7.1. Generating activation maps
Spatial maps of activation were derived as follows. First, each image was assigned to either a “stimulus on” or “off” period. To account for the delayed change in image signal following the onset of a stimulus (e.g.,Kwong et al., 1992), images acquired within 4 s after stimulus onset were assigned to the preceding “off” period and, images acquired within 4 s after stimulus offset were assigned to the preceding “on” period. For each stimulus, image signal strength during the stimulus “on” and immediately following “off” periods was compared on a voxel-by-voxel basis using an unpaired t test. The p-value result of this test was then plotted for each voxel with p <0.01 to yield a spatial map of activation.
2.7.2. Quantifying activation
The activation produced by each stimulus was quantified in terms of the percent change in image signal = (Son - Soff)/((Son + Soff)/2), where Son is the signal averaged over stimulus “on” periods, and Soff is the average over the immediately following “off” periods.
Percent signal change was compared across stimuli using two approaches. For each subject and ROI, percent change was calculated for the lowest p-value voxel (1) identified separately for each stimulus and (2) identified by taking into consideration all stimuli. For the first approach, the selected voxel could differ across stimuli while, for the second, the selected voxel was fixed across stimuli. The bandwidth dependencies revealed by the two approaches were essentially the same. The presented results used the second approach. For the cochlear nucleus, the selected voxel by both approaches always ended up being located in the portion of the ROI corresponding to the ventral division.
3. Results
Activation in response to binaural continuous noise of various bandwidths was almost always detected bilaterally in the inferior colliculi (10/10 subjects) and cochlear nuclei (9/10 subjects). In some subjects, activation was also detected in the superior olivary complex (on both sides in 5/10 subjects and on one side in an additional subject). Maps showing activation in the various structures are given in Fig. 3.
3.1. Inferior colliculus
Figs. 3 and 4 illustrate how inferior colliculus activation varied with bandwidth for stimuli of equal spectrum level. The activation maps in Fig. 3 are typical in that they show greater activation for broadband, as compared to one-octave noise. (Greater activation in the maps is shown as a lower p-value, indicating a more significant difference in image signal between stimulus “on” and “off” periods.) That activation increased steadily with increasing bandwidth when spectrum level was held constant across stimuli can be seen from the plots of percent signal change vs. bandwidth in Fig. 4 (top left and middle, dotted lines). The increase in percent signal change from one-third to two octaves was significant (p = 0.001, paired t test), as was the increase from two octaves to broadband (p < 0.001).
Fig. 4.

Percent signal change vs. bandwidth for equal spectrum level (dashed curves) and equal energy (solid) stimuli. (Left) Percent change averaged across subjects and sides. Bars indicate the SEM. (Middle and right) Each curve corresponds to a particular subject and side. To facilitate comparison of the trends across bandwidth, each curve has been displaced vertically by adding a constant such that the resulting mean across bandwidths is equal to the population mean. A curve is shown for each structure with detectable activation in the four subjects studied with all seven stimuli (i.e., eight inferior colliculi, six superior olives, seven cochlear nuclei).
When stimulus energy (instead of spectrum level) was held constant, the variation in inferior colliculus activation with bandwidth was essentially the same, although there was some difference in the absolute magnitude of activation (Fig. 4, top left and right, solid lines). Percent signal change increased significantly from one-third to two octaves (p < 0.001) and from two octaves to broadband (p < 0.001). Thus, activation increased steadily with increasing bandwidth for equal energy, as well as for equal spectrum level stimuli. At a third, one, and two octaves, percent change for the equal energy stimuli exceeded that for the equal spectrum level stimuli (third octave: p = 0.04, one: p = 0.03, two: p = 0.05). Correspondingly, the level of the equal energy stimuli exceeded that of the equal spectrum level stimuli (by 16 dB (third octave), 10 dB (one), 7 dB (two)). Thus, activation in the inferior colliculus showed a dependence on stimulus level, as well as bandwidth.
3.2. Cochlear nucleus and superior olivary complex
The cochlear nucleus and superior olivary complex showed essentially the same dependencies on bandwidth as the inferior colliculus, albeit with greater inter-subject variability. Like the inferior colliculus, both of these lower brainstem structures showed greater activation for broadband as compared to band-limited stimuli equated either in energy or spectrum level (Figs. 3 and 4). When stimulus energy was held constant, activation on average increased with increasing bandwidth. (While there were no statistically significant differences between the various band-limited conditions, there was a significant difference between each of the band-limited conditions and the broadband condition; p ≤ 0.002.) As in the inferior colliculus, activation in the cochlear nucleus and superior olivary complex at a third, one, and two octaves was less for the equal spectrum level stimuli than for equal energy stimuli indicating a dependence of activation on level as well as bandwidth. Based on measurements from histological atlases, the location of cochlear nucleus activation matched the position of the ventral, rather than the dorsal cochlear nucleus, so the cochlear nucleus data appear to specifically pertain to the ventral division.
3.3. Activation in standard vs. reduced background noise conditions
Fig. 5 shows results for the inferior colliculus in which the background acoustic noise during imaging was further reduced compared to our standard conditions (by increasing the inter-image interval from ∼2 s to ∼8 s). For both third octave and broadband stimuli (equal energy), percent signal change in the reduced noise condition (filled circles in Fig. 5; two subjects) fell within the range for our standard condition (open circles; eight subjects). Like the standard condition, the reduced noise condition showed greater percent change for the broadband, as compared to the third octave stimulus. Thus, the additional reduction in background noise had no obvious effect on either the magnitude or bandwidth dependence of inferior colliculus activation.
Fig. 5.

Inferior colliculus activation vs. bandwidth in two scanner acoustic noise conditions: standard (open circles) and reduced (closed circles). Each data point corresponds to a subject and side. The stimuli (third octave and broadband) were equal in energy. The standard and reduced noise conditions differed in the rate of imaging: one image every ∼2 s (standard) vs. one image every ∼8 s (reduced).
Neither of the subjects studied with reduced background noise showed activation in the superior olivary complex, but one showed activation in the cochlear nuclei. For both cochlear nuclei, percent signal change fell within the range for our standard conditions and increased with increasing bandwidth. Thus, the additional reduction in background imaging noise had no apparent effect on cochlear nucleus activation in the one subject for which there was pertinent data.
4. Discussion
The inferior colliculus, superior olivary complex, and cochlear nucleus all showed increases in fMRI activation with increasing bandwidth of a continuous noise stimulus. The increases in activation are specifically attributable to changes in bandwidth since stimulus level was held constant as bandwidth was varied and, the same trend (monotonically increasing activation) was seen with two different level-equalization strategies (energy constant, spectrum level constant). Given the number of bandwidths sampled (three plus broadband), it remains possible that local minima and maxima in the activation vs. bandwidth functions were missed in the present study. However, the data at hand indicate an overall growth in activation with increasing bandwidth. To our knowledge, these are the first neuro-imaging data showing the dependence of fMRI activation on bandwidth in auditory brainstem centers.
The present study used a non-standard approach for reducing the extraneous scanner sounds during fMRI (imaging a single slice, rather than multiple slices) which was advantageous because it provides 4-5 times more data per unit time compared to standard techniques (Edmister et al., 1999; Hall et al., 1999) and was possible because most of the brainstem auditory pathway can be encompassed by a single imaging slice. An important component of the present study was testing the adequacy this “single slice” approach. The test involved acquiring data in conditions that reduced the scanner sounds even more than our standard protocol by increasing the interval between image acquisitions (and hence the time between sounds produced by the scanner gradient coils). The long interval (∼8 s) between images in the tests left time for the brain’s response to the gradient sound to largely die out from one image acquisition to the next (Hall et al., 2000) thus ensuring that any measured activation represented an uncontaminated response to the intended stimuli. The data from the tests agreed with those taken with our standard protocol indicating that the reported bandwidth dependencies (obtained with our standard protocol) were not contaminated by the extraneous scanner sounds and likely reflect what would be seen in quiet.
4.1. Imaging brainstem auditory structures
In the present study, sound-evoked fMRI activation could be confidently attributed to specific brainstem nuclei because the measured activation was appropriately punctate (given the small size of the imaged nuclei), and appropriately located (based on histological atlases). fMRI activation in the inferior colliculus and cochlear nucleus was highly repeatable, while activation in the superior olivary complex was seen less consistently perhaps because the superior olive in toto responded more weakly to the stimulus. [Even when activation in the superior olive met our threshold criterion, the activation levels tended to be lower than in the inferior colliculus or cochlear nucleus (see Fig. 4).] A weak overall response may also explain why the nuclei of the lateral lemniscus did not show activation even though they were likely encompassed by the imaged slice. (They lie within the lateral lemniscus borders indicated in Fig.1(a)) However, the size and morphology of these nuclei also work against detecting their activation. The dorsal nucleus of the lateral lemniscus is smaller (∼2 × 2 × 2 mm) than the inferior colliculus (∼6 × 6 × 4 mm), superior olivary complex (∼2 × 2 × 5 mm), or cochlear nucleus (∼3 × 3 × 7 mm). Since the ventral nucleus of the lateral lemniscus is long and thin (∼9 × 0.5 × 0.5 mm), its response would be spread over multiple voxels, and could therefore be diluted to the point that it is undetectable.
4.2. Previous neuro-imaging data concerning bandwidth dependencies in humans
Previous neuro-imaging studies examining bandwidth effects have focused exclusively on auditory cortex. For the most part, the cortical data show the same overall trend as the brainstem data, i.e., greater activation for broader, as compared to narrower-band stimuli (Hall et al., 2001; Wessinger et al., 2001). However, decreases in cortical activation with increasing bandwidth have also been reported for certain stimuli (Hawley and Melcher, 2002) suggesting that the specific relationship between activation and bandwidth in cortical areas may be stimulus dependent. Whether this is also the case in brainstem structures has yet to be determined since only one type of stimulus (continuous noise) was examined in the present study.
4.3. Neural interpretations
While the hemodynamic and metabolic mechanisms linking fMRI activation and neural activity are still being worked out, it is generally accepted that increases and decreases in fMRI activation reflect concordant changes in neural activity (Bandettini et al., 1992; Kwong et al., 1992; Ogawa et al., 1992). Furthermore, there is growing evidence that the linkage between fMRI activation and synaptic (rather than discharge) activity may be particularly strong (Logothetis et al., 2001; Arthurs and Boniface, 2002). Therefore, our fMRI results indicate increases in (most likely synaptic) neural activity of the cochlear nucleus, superior olivary complex and inferior colliculus with increasing bandwidth. Since the spatial resolution of the functional images (∼3 × 3 × 6 mm) was comparable to the dimensions of the imaged nuclei, the fMRI activation measurements reflect an overall population response from each of the imaged centers. The location of the imaging plane and the position of cochlear nucleus activation within the imaging plane suggest that the fMRI activation measurements for the cochlear nucleus mainly reflect population neural activity of the ventral, rather than dorsal division.
A monotonic increase in fMRI activation with increasing bandwidth would be expected from populations of neurons having a single best frequency (BF) and only excitatory responses to sound, but not necessarily from lower auditory system neurons with their more complex responses. Many neuronal types projecting to the superior olivary complex and inferior colliculus (as well as superior olive and colliculus neurons themselves) do not have purely excitatory receptive fields (e.g., they show excitation at BF with “off-BF” inhibition; Ehret and Merzenich, 1988; Young and Brownell, 1976). In the auditory nerve (a major source of synaptic activity in the cochlear nucleus) suppression sidebands in single unit receptive fields can result in a plateau or even a decline in activity with increasing bandwidth at higher bandwidths (Ruggero, 1973). The monotonic increases in fMRI activation with increasing bandwidth seen here over a wide bandwidth range occurred despite these complexities.
5. Conclusions
The present study demonstrates that fMRI activation, an indicator of population neural activity, increases with increasing bandwidth in three major nuclei of the human auditory brainstem: cochlear nucleus, superior olivary complex, and inferior colliculus. The results provide fundamental data on which to base the design of neuro-imaging studies that need to control for, or manipulate stimulus bandwidth. They also provide basic information concerning the response properties of neural populations in the human auditory brainstem.
Acknowledgments
Support was provided by NIH/NIDCD PO1DC00119, T32DC00038, P30DC005209. The authors thank Barbara Norris and Haobing Wang for assistance in generating and visualizing the brain atlases, Barbara Norris for assistance in figure making, and John Guinan and Barbara Norris for comments on an earlier draft of this manuscript.
Footnotes
Portions of this work were presented at the 25th Annual Meeting of the Association for Research in Otolaryngology (2002) and the 7th Annual Meeting of the Organization for Human Brain Mapping (2001).
This level was estimated from measurements of unattenuated gradient sounds by correcting for the earmuff attenuation. The methods for measuring the gradient sounds were identical to those of Ravicz et al. (2000), except here they were applied to a different scanner. The earmuff attenuation measurements come from Ravicz and Melcher (2001) who characterized earmuffs identical to those used in the present study.
References
- Arthurs OJ, Boniface S. How well do we understand the neural origins of the fMRI BOLD signal? Trends Neurosci. 2002;25:27–31. doi: 10.1016/s0166-2236(00)01995-0. [DOI] [PubMed] [Google Scholar]
- Bandettini PA, Wong EC, Hinks RS, Tikofsky RS, Hyde JS. Time course EPI of human brain function during task activation. Magn. Reson. Med. 1992;25:390–397. doi: 10.1002/mrm.1910250220. [DOI] [PubMed] [Google Scholar]
- Binder JR, Rao SM, Hammeke TA, Frost JA, Bandettini PA, Hyde JS. Effects of stimulus rate on signal response during functional magnetic resonance imaging of auditory cortex. Cognitive Brain Res. 1994;2:31–38. doi: 10.1016/0926-6410(94)90018-3. [DOI] [PubMed] [Google Scholar]
- Brechmann A, Baumgart F, Scheich H. Sound-level-dependent representation of frequency modulations in human auditory cortex: a low-noise fMRI study. J. Neurophysiol. 2002;87:423–433. doi: 10.1152/jn.00187.2001. [DOI] [PubMed] [Google Scholar]
- Edmister WB, Talavage TM, Ledden PJ, Weisskoff RM. Improved auditory cortex imaging using clustered volume acquisitions. Human Brain Mapp. 1999;7:89–97. doi: 10.1002/(SICI)1097-0193(1999)7:2<89::AID-HBM2>3.0.CO;2-N. [DOI] [PMC free article] [PubMed] [Google Scholar]
- Ehret G, Merzenich MM. Complex sound analysis (frequency resolution, filtering and spectral integration) by single units of the inferior colliculus of the cat. Brain Res. Rev. 1988;13:139–163. doi: 10.1016/0165-0173(88)90018-5. [DOI] [PubMed] [Google Scholar]
- Friston KJ, Ashburner J, Frith CD, Poline J-B, Heather JD, Frackowiak RSJ. Spatial registration and normalization of images. Human Brain Mapp. 1995;2:165–189. [Google Scholar]
- Giraud A-L, Lorenzi C, Ashburner J, Wable J, Johnsrude I, Frackowiak R, Kleinschmidt A. Representation of the temporal envelope of sounds in the human brain. J. Neurophysiol. 2000;84:1588–1598. doi: 10.1152/jn.2000.84.3.1588. [DOI] [PubMed] [Google Scholar]
- Guimaraes AR, Melcher JR, Talavage TM, Baker JR, Ledden P, Rosen BR, Kiang NYS, Fullerton BC, Weisskoff RM. Imaging subcortical auditory activity in humans. Human Brain Mapp. 1998;6:33–41. doi: 10.1002/(SICI)1097-0193(1998)6:1<33::AID-HBM3>3.0.CO;2-M. [DOI] [PMC free article] [PubMed] [Google Scholar]
- Hall DA, Haggard MP, Akeroyd MA, Palmer AR, Summerfield AQ, Elliott MR, Gurney EM, Bowtell RW. Sparse temporal sampling in auditory fMRI. Human Brain Mapp. 1999;7:213–223. doi: 10.1002/(SICI)1097-0193(1999)7:3<213::AID-HBM5>3.0.CO;2-N. [DOI] [PMC free article] [PubMed] [Google Scholar]
- Hall DA, Haggard MP, Summerfield AQ, Akeroyd MA, Palmer AR. Functional magnetic resonance imaging measurements of sound-level encoding in the absence of background scanner noise. J. Acoust. Soc. Am. 2001;109:1559–1570. doi: 10.1121/1.1345697. [DOI] [PubMed] [Google Scholar]
- Hall DA, Summerfield AQ, Gonçalves MS, Foster JR, Palmer AR, Bowtell RW. Time-course of the auditory BOLD response to scanner noise. Magn. Reson. Med. 2000;43:601–606. doi: 10.1002/(sici)1522-2594(200004)43:4<601::aid-mrm16>3.0.co;2-r. [DOI] [PubMed] [Google Scholar]
- Harms MP, Melcher JR. Sound repetition rate in the human auditory pathway: representations in the waveshape and amplitude of fMRI activation. J. Neurophysiol. 2002;88:1433–1450. doi: 10.1152/jn.2002.88.3.1433. [DOI] [PubMed] [Google Scholar]
- Hart HC, Palmer AR, Hall DA. Heschl’s gyrus is more sensitive to tone level than non-primary auditory cortex. Hear. Res. 2002;171:170–190. doi: 10.1016/s0378-5955(02)00498-7. [DOI] [PubMed] [Google Scholar]
- Hart HC, Hall DA, Palmer AR. The sound-dependent growth in the extent of fMRI activation in Heschl’s gyrus is different for low- and high-frequency tones. Hear. Res. 2003;179:104–112. doi: 10.1016/s0378-5955(03)00100-x. [DOI] [PubMed] [Google Scholar]
- Hawley ML, Melcher JR. Representation of sound band-width in the human auditory system using fMRI; Abstracts ofthe Twenty-fifth Annual Midwinter Research Meeting, Association for Research in Otolaryngology Abstracts:.2002. p. 244. [Google Scholar]
- Jäncke L, Mirzazade S, Specht K, Loose R, Himmelback M, Müller-Gärtner H-W. A parametric analysis of the ‘rate effect’ in the sensorimotor cortex: a fMRI analysis. Neuroimage. 1998;7:S938. doi: 10.1016/s0304-3940(98)00540-0. [DOI] [PubMed] [Google Scholar]
- Kiang NYS, Fullerton BC, Richter EA, Levine RA, Norris BE. Artificial stimulation of the auditory system. In: Hoke M, editor. Advances in Audiology. Vol. 1. Karger; Basel: 1984. pp. 6–17. [Google Scholar]
- Kwong KK, Belliveau JW, Chesler DA, Goldberg IE, Weisskoff RM, Poncelet BP, Kennedy DN, Hoppel BE, Cohen MS, Turner R, Cheng H-M, Brady TJ, Rosen BR. Dynamic magnetic resonance imaging of human brain activity during primary sensory stimulation. Proc. Natl. Acad. Sci. USA. 1992;89:5675–5679. doi: 10.1073/pnas.89.12.5675. [DOI] [PMC free article] [PubMed] [Google Scholar]
- Lasota KJ, Ulmer JL, Firszt JB, Biswal BB, Daniels DL, Prost RW. Intensity-dependent activation of the primary auditory cortex in functional magnetic resonance imaging. J. Comput. Assist. Tomogr. 2003;27:213–218. doi: 10.1097/00004728-200303000-00018. [DOI] [PubMed] [Google Scholar]
- Levine RA, Gardner JC, Stufflebeam SM, Fullerton BC, Carlisle EW, Furst M, rosen BR, Kiang NYS. Binaural auditory processing in multiple sclerosis subjects. Hear. Res. 1993;68:59–72. doi: 10.1016/0378-5955(93)90065-9. [DOI] [PubMed] [Google Scholar]
- Lockwood AH, Salvi RJ, Coad ML, Arnold SA, Wack DS, Murphy BW, Burkard RF. The functional anatomy of the normal human auditory system: responses to 0.5 and 4.0 kHz tones at varied intensities. Cereb. Cortex. 1999;9:65–76. doi: 10.1093/cercor/9.1.65. [DOI] [PubMed] [Google Scholar]
- Logothetis NK, Pauls J, Augath M, Trinath T, Oeltermann A. Neurophysiological investigation of the basis of the fMRI signal. Nature. 2001;412:150–157. doi: 10.1038/35084005. [DOI] [PubMed] [Google Scholar]
- Melcher JR, Sigalovsky I, Guinan JJ, Jr., Levine RA. Lateralized tinnitus studied with functional magnetic resonance imaging: abnormal inferior colliculus activation. J. Neurophysiol. 2000;83:1058–1072. doi: 10.1152/jn.2000.83.2.1058. [DOI] [PubMed] [Google Scholar]
- Mohr C, King WM, Freeman AJ, Briggs RW, Leonard CM. Influence of speech stimuli intensity on the activation of auditory cortex investigated with functional magnetic resonance imaging. J. Acoust. Soc. Am. 1999;105:2738–2745. doi: 10.1121/1.426942. [DOI] [PubMed] [Google Scholar]
- Ogawa S, Tank DW, Menon R, Ellermann JM, Kim S-G, Merkle H, Ugurbil K. Intrinsic signal changes accompanying sensory stimulation: functional brain mapping with magnetic resonance imaging. Proc. Nat. Acad. Sci. USA. 1992;89:5951–5955. doi: 10.1073/pnas.89.13.5951. [DOI] [PMC free article] [PubMed] [Google Scholar]
- Price C, Wise R, Ramsay S, Friston K, Howard D, Patterson K, Frackowiak R. Regional response differences within the human auditory cortex when listening to words. Neurosci. Lett. 1992;146:179–182. doi: 10.1016/0304-3940(92)90072-f. [DOI] [PubMed] [Google Scholar]
- Ravicz ME, Melcher JR. Isolating the auditory system from acoustic noise during functional magnetic resonance imaging: examination of noise conduction through the ear canal, head, and body. J. Acoust. Soc. Am. 2001;109:216–231. doi: 10.1121/1.1326083. [DOI] [PMC free article] [PubMed] [Google Scholar]
- Ravicz ME, Melcher JR, Kiang NYS. Acoustic noise during functional magnetic resonance imaging (fMRI) J. Acoust. Soc. Am. 2000;108:1683–1696. doi: 10.1121/1.1310190. [DOI] [PMC free article] [PubMed] [Google Scholar]
- Ruggero MA. Response to noise of auditory nerve fibers in the squirrel monkey. J. Neurophysiol. 1973;36:569–587. doi: 10.1152/jn.1973.36.4.569. [DOI] [PubMed] [Google Scholar]
- Sigalovsky I, Hawley ML, Harms MP, Melcher JR. Sound level representations in the human auditory pathway investigated using fMRI. Neuroimage. 2001;13:S939. [Google Scholar]
- Tanaka H, Fujita N, Watanabe Y, Hirabuki N, Takanashi M, Oshiro Y, Nakamura H. Effects of stimulus rate on the auditory cortex using fMRI with sparse temporal sampling. Neuroreport. 2000;11:2045–2049. doi: 10.1097/00001756-200006260-00047. [DOI] [PubMed] [Google Scholar]
- Wessinger CM, VanMeter J, Tian B, Van Lare J, Pekar J, Rauschecker JP. Hierarchical organization of the human auditory cortex revealed by functional magnetic resonance imaging. J. Cognitive Neurosci. 2001;13:1–7. doi: 10.1162/089892901564108. [DOI] [PubMed] [Google Scholar]
- Yakovlev PI. Whole brain serial histological sections. In: Tedeschi GC, editor. Neuropathology: Methods and Diagnosis. Little Brown; Boston, NY: 1970. pp. 371–378. [Google Scholar]
- Young ED, Brownell WE. Responses to tones and noise of single cells in dorsal cochlear nucleus of unanesthetized cats. J. Neurophysiol. 1976;39:282–299. doi: 10.1152/jn.1976.39.2.282. [DOI] [PubMed] [Google Scholar]