Abstract
Eukaryotic genome size varies over five orders of magnitude; however, the distribution is strongly skewed toward small values. Genome size is highly correlated to a number of phenotypic traits, suggesting that the relative lack of large genomes in eukaryotes is due to selective removal. Using phylogenetic contrasts, we show that the rate of genome size evolution is proportional to genome size, with the fastest rates occurring in the largest genomes. This trend is evident across the 20 major eukaryotic clades analyzed, indicating that over long time scales, proportional change is the dominant and universal mode of genome-size evolution in eukaryotes. Our results reveal that the evolution of eukaryotic genome size can be described by a simple proportional model of evolution. This model explains the skewed distribution of eukaryotic genome sizes without invoking strong selection against large genomes.
Genome size is a unique biological trait because it lies at the intersection of genotype and phenotype. Eukaryotic genomes have ∼104 genes (Walbot and Petrov 2001); therefore, the five-orders-of-magnitude variation is largely due to varying amounts of introns and noncoding DNA (Lynch and Conery 2003). While the size of the genome does not necessarily confer genotypic information, it might have great evolutionary significance, as evidenced by its large number of phenotypic correlates, including cell size (Gregory 2001, and references therein), metabolic rate (Vinogradov 1995, 1997; Kozlowski et al. 2003), and genomic landscape (i.e., the relative number of genes, introns, and mobile genetic elements) (Lynch and Conery 2003; van Nimwegen 2003). Many causal hypotheses have been proposed to account for the strong statistical correlations between these traits and genome size (Petrov et al. 2000; Gregory 2001; Petrov 2001; Gregory 2003; Cavalier-Smith 2005). While these explanations differ regarding the particular evolutionary mechanisms that ultimately determine genome size, natural selection acting on its phenotypic correlates might prove to be the means by which the genome-size distribution in nature is determined. Large eukaryotic genomes are rare (Gregory 2005), and studies on the rates of extinction and species richness suggest that large genome size is a deleterious trait that is selectively removed from Eukarya (Vinogradov 2003, 2004b; Knight et al. 2005). However, the influence of the underlying molecular mechanisms on the dynamics of genome size evolution has not been fully considered. Here, we show that the dynamics of genome size evolution necessarily lead to the comparative lack of large genomes, even in the absence of selection against them.
The rate of genome size evolution is determined by the rates of DNA insertion and deletion (indels). Thus, genome size evolution is governed by the rates and biases in indel generation by mutation and in their subsequent fixation in populations (Petrov et al. 2000). In eukaryotes, the dominant mechanisms of indel generation include unequal chromosome crossover (Smith 1976), DNA replication errors (Albertini et al. 1982; Bebenek and Kunkel 1990; Kunkel 1990), polyploidization (Soltis and Soltis 1999), and the proliferation and illegitimate recombination of transposable elements (Devos et al. 2002; Kazazian 2004).
Although the mechanisms of indel production are diverse, the effect of almost all of them on the overall quantity of DNA added or removed per genome depends strongly on the initial genome size. For example, the increase in DNA resulting from polyploidization is proportional to the haploid genome size, as is the portion of the total amount of DNA added or removed via insertions and deletions produced by replication errors. In addition, the probability of transposition is a function of the initial transposon copy number, as well as the number of potential target insertion sites (Zhu et al. 2003; Kazazian 2004). Because indels affect genome size in a proportionate rather than additive manner, lineages with larger starting genomes should show more rapid genome size evolution. The same pattern is not necessarily expected if genome sizes evolve to variable species-specific optimal values determined by ecological and environmental variables.
In this study, we estimated the rate of genome size evolution in 20 traditionally recognized eukaryotic taxonomic groups comprising 168 species, and used the concept of Brownian evolution (Bookstein 1987) and phenotypic contrasts (Felsenstein 1985) to investigate patterns of genome size evolution. In a simple Brownian model, the absolute magnitude of evolutionary change (i.e., rate of evolution) behaves as if drawn randomly from a right one-half normal positive distribution at each time step, with variance equal to the Brownian motion rate parameter. In other words, the variance of the underlying evolutionary change is drawn from a fixed distribution and is independent of the preceding phenotype. However, a trait under proportional evolution violates the Brownian model because the mean and the variance of the underlying evolutionary rate scale with, and depend on, the preceding phenotype. Therefore, if a phenotypic trait, such as genome size, evolves primarily in a proportional manner, we would expect two clear patterns of genome size evolution to emerge. First, the absolute rate of genome size evolution should be positively correlated with genome size, while the variance of the underlying evolutionary rate should clearly deviate from the right one-half normal positive distribution predicted under Brownian evolution. Second, if genome size data were proportionally transformed a priori (e.g., Log10), thus removing the dependency of the underlying evolutionary rate variance on the preceding phenotype, the absolute rate of genome-size evolution should show no correlation to genome size. Furthermore, the proportional transformation should result in a right one-half normal positive distribution of evolutionary changes in Log10 genome size, thus approximating the simple Brownian model. Using these diagnostics, we specifically tested whether the relative lack of large genome sizes among eukaryotes could be a consequence of proportional evolution that does not necessarily require universal purifying selection against large genomes. In our analysis, we found strong evidence of proportional evolution in eukaryotic genome size, and show that underlying parameters of proportional evolution are surprisingly similar among very diverse lineages. We argue that observed right-skewed genome size distribution in eukaryotes emerges necessarily from the underlying mechanics of proportional evolution even in the absence of natural selection against large genomes.
Results
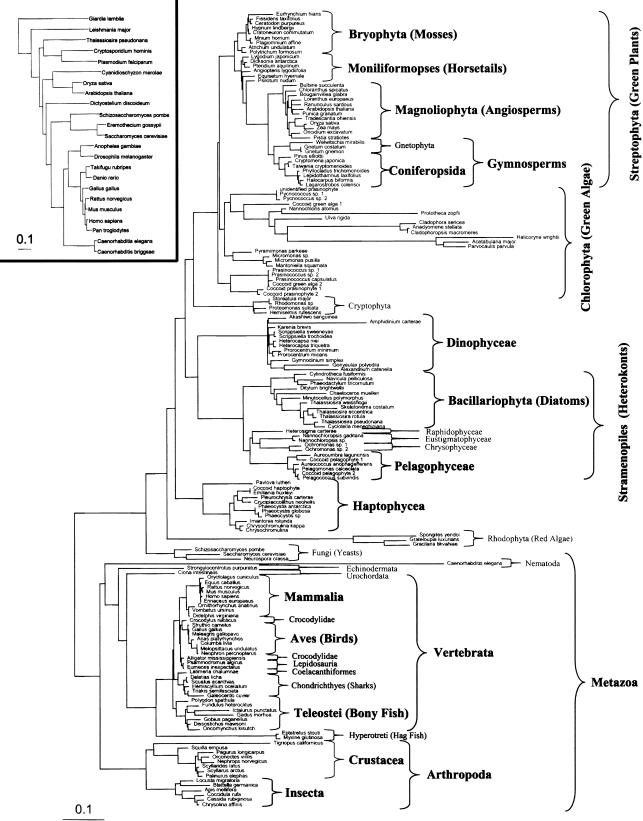
We estimated the rate of genome size evolution in eukaryotes using the phylogenetic contrast method. This method uses a local maximum likelihood estimation of a phenotypic trait (genome size) at each node in a tree based on the trait at its tips. The main tree in this analysis is based on 18S rDNA sequences (Fig. 1). A contrast is the quantitative difference between the genome sizes of the subtending branches for each node, standardized to its evolutionary distance based on the subtending branch lengths. The absolute value of this standardized contrast represents an estimate of the underlying rate of genome size evolution, based on divergence from a common ancestor, as long as the mutation rate of the 18S rDNA sequence and genome size change are not directly coupled (i.e., branch length is not correlated to genome size) (Garland 1992). In our analysis, there is no such correlation; we emphasize that the rates inferred in this method are relative, as the tree is clocked in the units of 18S rDNA evolution and not in either absolute or generation time. However, even though the 18S rDNA mutation rates vary among taxonomic groups, this variation likely has minimal effects on the estimation of genome size evolution, because genome size varies by multiple orders of magnitude, while mutation rates in the 18S rDNA sequence vary by less than one order of magnitude. Nevertheless, understanding the influence of branch-length error when using phylogenetic contrasts is critical, as an incorrect tree topology can lead to misinterpretation (Diaz-Uriarte and Garland 1998). Trees based on 18S rDNA sequences alone have been shown to be problematic in determining evolutionary relationships (Duvall and Ervin 2004). To determine empirically whether the estimation of genome size evolution was significantly influenced by a variable mutation rate in the 18S rDNA gene, we also estimated the rate of genome size evolution using a smaller (23 species), published eukaryotic tree based on 31 concatenated orthologs (Ciccarelli et al. 2006). As an additional test of the sensitivity of our results to the branch lengths of the 18S rDNA tree, we estimated a chronogram (Sanderson 1997) from the 18S rDNA tree. This procedure effectively changes the branch lengths in the tree until it fits the assumptions of temporal autocorrelation in the rates of molecular evolution. We treated these changes in branch length computed in the chronogram as an additional sensitivity test of our contrast-analysis results.
Figure 1.
Maximum likelihood tree based on 18S rDNA sequences built using PHYML. Taxonomic groups highlighted in bold were analyzed for genome size evolution. Accession numbers for the 18S rDNA sequences used in this analysis are given in Supplemental Table 1. (Inset) Alternative eukaryotic tree based on 31 orthologs that was used to verify the general trend of genome size evolution inferred from the 18S rDNA tree (Ciccarelli et al. 2006).
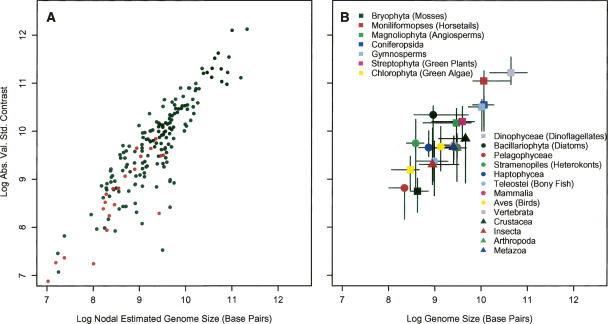
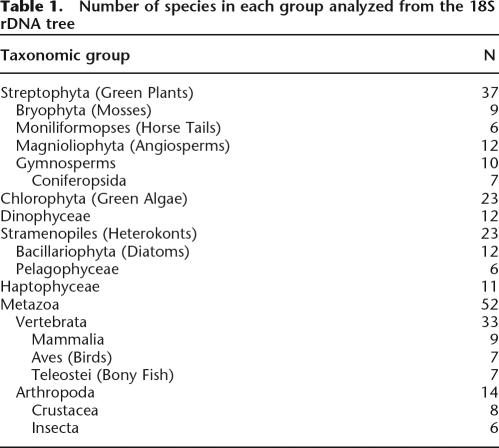
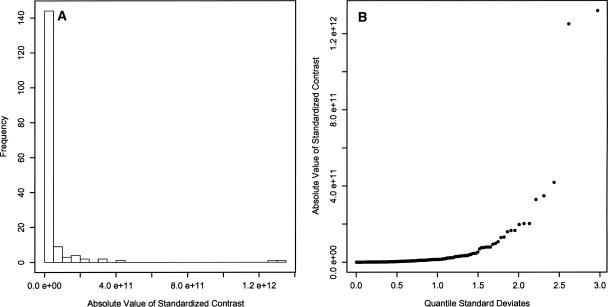
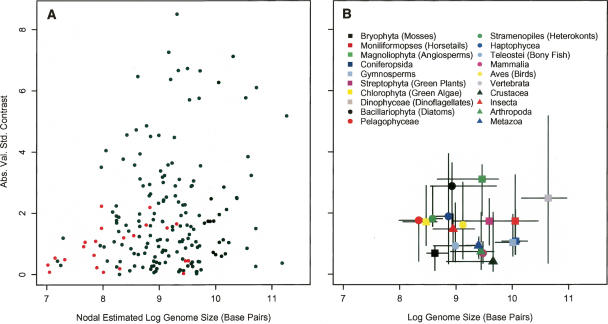
We examined the relationship between genome size and the absolute value of standardized contrasts (i.e., absolute magnitude of the rate of divergence) in two ways. First, the maximum likelihood estimation of genome size at each node was compared with the contrast calculated at each node for the whole 18S rDNA tree and for the 31-ortholog tree (Fig. 2A). Second, the 18S rDNA tree was divided into 20 traditionally recognized taxonomic subtrees, from which the median genome size and median contrast for each subtree was taken as the representative for the group (Fig. 2B; Table 1). The 31-ortholog tree was not divided because of its small size. These analyses showed a significant positive relationship between initial or median genome size and the rate of genome size evolution, while analyses of the distribution of the absolute value of the contrasts revealed a significant deviation from a right one-half normal positive distribution as predicted by the Brownian model (Fig. 3). The pattern of genome size evolution inferred from the 18S rDNA tree and the 31-ortholog tree are consistent with each other (Fig. 2A), and calculating the contrasts based on the estimated chronogram did not change the positive relationship between genome size and the absolute value of standardized contrasts (Supplemental Fig. 1). These results suggest that variance in the mutation rate in the 18S rDNA tree does not significantly influence the rate estimate of genome size evolution in eukaryotes in our analysis.
Figure 2.
(A) A tree-wise analysis of the nodal estimated genome size and the calculated contrast at each node from the 18S rDNA tree (black dots) and the 31-ortholog tree (red dots). Estimations from both trees indicate that as genome size increases, the rate of evolution of genome size increases (shown on Log10 axes for plotting purposes). (B) Distribution of the median absolute contrast and the median genome size of the 20 traditionally recognized taxonomic groups from the 18S rDNA tree. Bars represent bootstrapped 95% confidence intervals. Again, a clear positive relationship is evident between genome size and the rate of genome size evolution (shown on Log10 axes for plotting purposes).
Table 1.
Number of species in each group analyzed from the 18S rDNA tree
Figure 3.
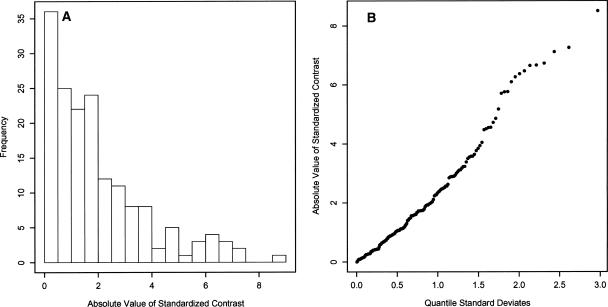
(A) Distribution of the absolute value of the standardized contrasts from the 18S rDNA tree showing a strong deviation from the right one-half normal positive distribution expected from a phenotypic trait under Brownian evolution. A strong deviation would be expected for a trait under proportional evolution. (B) Quantile distribution of the absolute value of the standardized contrasts. These contrasts do not show a near-linear relationship to the positive quantile standard deviates, indicating a strong deviation from a right one-half normal positive distribution. This is expected for a trait under proportional evolution.
An alternative and more direct test of proportional genome size evolution involves an a priori Log10 transformation of the genome size data, thus removing any proportional dependency between the rate of genome-size evolution and genome size. Comparisons of Log10-transformed genome size and the calculated contrasts revealed no significant correlation (Fig. 4), indicating that the underlying specific (i.e., proportional) rate of genome-size evolution is independent of genome size. Again, estimates of the rate of the Log10-transformed genome size evolution were consistent between the 18S rDNA tree and the 31-ortholog tree, and calculating the contrasts from the estimated chronogram did not change the results (Supplemental Fig. 2). The analysis of the distribution of the contrasts calculated from Log10-transformed genome size also shows that the contrasts approximate a right one-half normal positive distribution, thus fitting the Brownian model of evolution quite well (Fig. 5). This indicates that the dominant mode of genome size evolution is proportional, with the tempo increasing with genome size. Hence, in eukaryotes, the larger the genome, the faster its size is evolving.
Figure 4.
A priori Log10 transformation of genome size removes the proportional effect of genome size on the rate of genome size evolution. (A) A tree-wise analysis of the nodal estimated genome size and the calculated contrast at each node shows no significant correlation. (B) The distribution of the median absolute contrast and the median genome size of 20 traditionally recognized taxonomic groups also shows no significant correlation. Bars represent bootstrapped 95% confidence intervals. As in Figure 3A, red dots represent estimations from the 31-ortholog tree and black dots represent estimations from the 18S rDNA tree.
Figure 5.
(A) Distribution of the absolute value of the standardized contrasts calculated from Log10-transformed genome size and the 18S rDNA tree. This calculation shows approximately a right one-half normal positive distribution expected from a phenotypic trait under Brownian evolution. (B) Quantile distribution of the absolute value of the standardized contrasts calculated from Log10-transformed genome size data. These contrasts show a near-linear relationship to the positive quantile standard deviates, indicating the expected right one-half normal positive distribution of the contrasts for a phenotypic trait under Brownian evolution.
Discussion
Traditionally, the paucity of large genomes in eukaryotes has been interpreted as a universal selection against this trait, yet precise descriptions of the specific selection pressures against large genomes are admittedly indirect (Vinogradov 2004b; Knight et al. 2005). This is not to say that there are no real reductive selection pressures on genome size in specific instances; loss of DNA in organisms co-opted as organelles (i.e., mitochondria and plastids), and in organisms with parasitic life histories, might be due to natural selection acting against large genome size (Cavalier-Smith 2005). However, even in these cases, it is not clear whether these genome-size reductions are due to the inherently higher fitness of reduced genome size or to the apparent inability of mobile elements to flourish due to sexual constraints (Arkhipova and Meselson 2000; Wright and Finnegan 2001). The observed correlations between environmental factors, extinction rates, and genome size in some eukaryotic groups also suggest that natural selection may act against species with large genomes, possibly at higher taxonomic levels (Knight and Ackerly 2002; Vinogradov 2004b; Knight et al. 2005). However, it is not clear whether such selection is necessary or sufficient to generate the observed skew in the distribution of genome sizes in eukaryotes. Here, we offer an alternative explanation for the lack of large eukaryotic genomes that does not rely on selection acting on genome size.
We suggest that proportional evolution of genome size necessarily leads to the skewed distribution of genome sizes in nature. For instance, let us consider a Gaussian distribution centered at zero, which represents all of the possible changes in genome size for all genomes. For a specific genome at a given time step, either a stochastic or selective process produces a single variate draw from this distribution at each time step. However, the effect the variate draw has on genome size change is a multiple of genome size. Therefore, the effect of the variate draw at each time step on small genomes is much less than for large genomes. In short, under proportional evolution, it is more difficult for small genomes to become and stay large and easier for large genomes to become and stay small. Therefore, by virtue of proportional evolution, we expect far more small genomes than large genomes in eukaryotes. This corroborates the observation that eukaryote families characterized by large genomes tend to have a much larger range of genome sizes than families with small genomes (Hinegardner and Rosen 1972), and the recent suggestion that it is difficult for small genomes to increase in size after a prolonged phase of genome reduction (Ciccarelli et al. 2006).
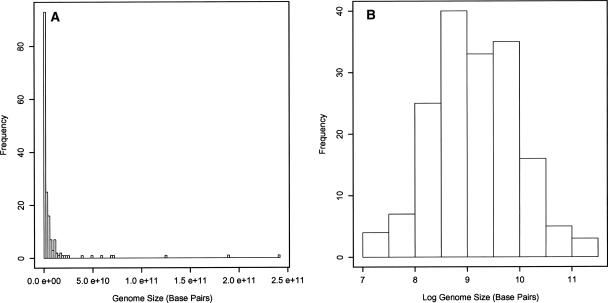
The general expectation of proportional evolution is that the distribution of a trait under this mode of evolution should approximate log-normality after sufficiently long periods of time (Lewontin and Cohen 1969). Eukaryotes are thought to be between 1.45 and two billion years old (Embley and Martin 2006), thus it is a reasonable expectation that large eukaryotic genomes are rare, not because of a universal selection pressure against them, but because of the underlying molecular mechanics that drive the proportional evolution of genome size. The distribution of genome sizes used in this analysis (Fig. 6) supports this hypothesis. Similar trends in genome size distribution have also been observed in Teleosts (Hinegardner and Rosen 1972), Angiosperms (Knight et al. 2005) and Metazoans (Gregory 2005). It should be noted however, that the conceptual model presented here predicts that genome size should approach zero if integrated over infinite time points. This is resolved by assuming that genome size growth and reduction is primarily a result of the insertion and deletion of noncoding DNA. As mentioned previously, the number of eukaryotic genes is relatively stable and makes up a very small fraction of the total DNA, while the large amount of noncoding DNA is responsible for the large variation in eukaryotic genome sizes (Lynch and Conery 2003). Therefore, as a genome becomes very small by reducing the amount of nonessential DNA, the fraction of essential DNA increases within the genome. For small genomes consisting of only essential DNA, deletions, especially large ones, are more dangerous than insertions, as deletions require at least two DNA breaks, whereas insertions require only one (Petrov 2002; Vinogradov 2004a). This effect provides the lower boundary of eukaryotic genome size.
Figure 6.
Distribution of genome sizes used in this analysis in linear space (A) and logarithmic space (B) exhibit a log-normal distribution, as predicted by proportional evolution integrated over long time periods.
Despite the small sample size for each of the taxonomic groups, there appear to be some interesting trends in these specific rates of genome size evolution (Fig. 4B). For example, it has been hypothesized that birds evolve at a slower rate compared with other terrestrial vertebrates and have especially constrained genomes due to flight (Gregory 2002). But the rate of bird genome size evolution is near the expected rate for a genome whose size falls under the forces of proportional evolution. Conversely, large variation in observed genome size within large-genome lineages has been interpreted as a lack of constraint on genome size evolution (Hinegardner and Rosen 1972). We suggest that this is an expected condition if genome size is evolving in a proportional way. Our analysis shows only Magnoliophyta and Bacillariophyta genomes evolve at statistically significantly higher specific rates than the other eukaryotic groups, possibly due to frequent polyploidy in these clades (Chepurnov et al. 2002). It should be noted, however, that because the main effect on the rate of genome size evolution is removed via a priori logarithmic transformation of genome size, it is also possible that intergroup differences in 18S rDNA mutation rates influence estimates of the specific rates of genome-size evolution. While the lack of statistical significance does not imply a true lack of the differences among or within species groups because of small sample size, future investigations of genome-size evolution will need to take into account the dominance of the proportional mode of evolution of genome size before inferring unusually fast or slow patterns of genome size evolution.
Our results suggest that the tempo of genome-size evolution is positively correlated to genome size across broad eukaryotic diversity. This relationship is consistent with a proportional model of genome size change as the dominant mode of genome-size evolution. Furthermore, the proportional evolution of genomes provides an alternative explanation for the distribution of genome size in nature and is not reliant on a universal selection pressure against large genomes. Along with genome size, there is strong evidence of proportional evolution in other aspects of genomes, namely, in the number of members in gene families (Huynen and van Nimwegen 1998), and in genome DNA word usage (Luscombe et al. 2002). Of the clades examined here, none appeared to violate proportional genome size evolution; therefore, we conclude that eukaryotic genome size does not evolve to taxa-specific optima, which vary in an unpredictable manner. Rather, eukaryotic genome sizes might evolve in a stochastically proportionate manner, which necessarily produces far more small genomes than large genomes, even in the absence of selection.
Methods
Tree building and analysis
We used two trees in this analysis. The first was based on 18S rDNA sequences that simultaneously allowed for broad coverage across the eukaryotic tree and incorporated variable mutation rates in these sequences associated with various reproductive strategies and life histories. Therefore, the rates of evolution are in terms of 18S rDNA divergence. We first automatically aligned these sequences using ClustalX, and then hand edited the alignment. We computed a Maximum Likelihood tree using PHYML (GTR model, 1000 bootstraps). See http://atgc.lirmm.fr/phyml/. The second tree used in this analysis was a small published eukaryotic tree estimated from 31 concatenated orthologs (Ciccarelli et al. 2006). The main purpose of this tree was to determine whether the inherent variation in 18S rDNA mutation rates significantly skewed our estimation of genome size evolution. Figures 2A and 4A both indicate that the overall trend of proportional genome evolution in eukaryotes is evident from both trees. We also estimated a chronogram from the 18S rDNA tree using the chronogram function in the “APE” library (Analyses of Phylogenetics and Evolution) (Paradis et al. 2004) in the program R (R Development Core Team 2006)
Genome size (1C values) estimates for the 18S rDNA tree come from various literature (Shuter et al. 1983; Veldhuis et al. 1997) and web sources (Supplemental Table 1). These sources tabulate genome sizes from other research efforts, and have those references within. Most eukaryotic genome-size estimates are from only a few taxonomic groups (namely green plants and animals). The goal of this study was to look at the broad scale pattern of eukaryotic genome size evolution; therefore, not all available estimates of genome size were used. Instead, we favored a more even distribution of species from across the eukaryotic tree. We used a random number generator from the two largest databases of genome size, the Kew database http://www.kew.org/cval/homepage.html and the Animal Genome Size Database http://www.genomesize.com/, to pick 6–10 species without replacement. Clearly, not all species or taxonomic groups could be included in this type of analysis; however, we believe we achieved broad taxonomic coverage of the eukaryotic domain. Genome size estimates for the 31-ortholog tree also come from various sources (Supplemental Table 2). While this tree does have some overlap with the 18S rDNA tree, it also includes some parasitic eukaryotes not included in the 18S rDNA tree.
We calculated standardized independent contrasts for the 20 taxonomic groups in Table 1 using the pic function in the APE library (Paradis et al. 2004) in the statistical program R (R Development Core Team 2006).
Regression analysis
For Figure 2, A and B, the data are shown on a Log10-transformed axis, but we calculated the statistics using the linear data. For Figure 2A, a standard OLS regression of the two variables indicates a significant positive correlation (R2 = 0.67, P << 0.001). However, the local maximum likelihood estimations of genome size at each node are not independent of each other, since the estimation of the genome size at any node depends on the distal nodes above it, therefore making a standard P value unreliable. Hence, to determine whether the positive correlation was significant, we used the PDSIMUL module of the PDAP program to simulate proportional evolution of genome size (Garland et al. 1993). We based parameterization of the model on the distribution of the genome sizes and based the tree topology on the 18S rDNA divergence used in this analysis. We used correlations computed from 1000 Monte Carlo simulations of proportional evolution of genome sizes to estimate the significance of the of the OLS correlation coefficient computed in Figure 2A. The correlation fell within the 95% confidence interval of the expected correlation between the nodal estimation of genome size and the absolute value of the standardized contrast (P = 0.226), indicating that the trend in Figure 2A was not significantly different from what would be expected under proportional evolution of genome size. We also took non-independence of regression variables into account for Figure 2B due to the hierarchical nature of the subgroups considered. For example, Vertebrata are not independent of Metazoa, because Metazoa subsumes Vertebrata. Therefore, we performed regression analysis only on the medians of the mutually exclusive subgroups (R2 = 0.84, P << 0.001). We took the same statistical precautions for Figure 4, A and B, which were based on a priori Log10-transforming genome size. For Figure 4A, a standard OLS regression showed no significant relationship (R2 = 0.021, P = 0.057). Monte Carlo simulation of proportional evolution of genome size indicated that the OLS correlation fell within the 95% confidence interval of the expected correlation between the nodal estimation of Log10 genome size and the absolute value of the standardized contrast (P = 0.137), indicating that the trend in Figure 4A was not significantly different from what would be expected under proportional evolution of genome size. For Figure 4B, the median values of the mutually exclusive subgroups showed no significant correlation (R2 = 0.006, P = 0.787). While Figures 2B and 4B affirm the overall proportional relationship between genome size and the rate of genome-size evolution, we emphasize that correlation of medians should be interpreted with caution and, therefore, should be treated as visual heuristic companions to Figures 2A and 4A.
Acknowledgments
Funding for this research was provided by NSF Biocomplexity OCE-0084032 and NASA Biodiversity NASA-NNG06GH75G1/3. We are indebted to Dr. Theodore Garland Jr. of the University of California, Riverside, for helpful discussions and access to the PDAP software package. We also thank Dr. Mark Moline, Dr. Charley Knight, Dr. Kay Bidle, Dr. Robert Chant, and two anonymous reviewers for helpful comments and discussions.
Footnotes
[Supplemental material is available online at www.genome.org.]
Article published online before print. Article and publication date are at http://www.genome.org/cgi/doi/10.1101/gr.6096207
References
- Albertini A.M., Hofer M., Calos M.P., Miller J.H., Hofer M., Calos M.P., Miller J.H., Calos M.P., Miller J.H., Miller J.H. On the formation of spontaneous deletions: The importance of short sequence homologies in the generation of large deletions. Cell. 1982;29:319–328. doi: 10.1016/0092-8674(82)90148-9. [DOI] [PubMed] [Google Scholar]
- Arkhipova I., Meselson M., Meselson M. Transposable elements in sexual and ancient asexual taxa. Proc. Natl. Acad. Sci. 2000;97:14473–14477. doi: 10.1073/pnas.97.26.14473. [DOI] [PMC free article] [PubMed] [Google Scholar]
- Bebenek K., Kunkel T.A., Kunkel T.A. Frameshift errors initiated by nucleotide misincorporation. Proc. Natl. Acad. Sci. 1990;87:4946–4950. doi: 10.1073/pnas.87.13.4946. [DOI] [PMC free article] [PubMed] [Google Scholar]
- Bookstein F.L. Random walk and the existence of evolutionary rates. Paleobiology. 1987;13:446–464. [Google Scholar]
- Cavalier-Smith T. Economy, speed and size matter: Evolutionary forces driving nuclear genome miniaturization and expansion. Ann. Bot. 2005;95:147–175. doi: 10.1093/aob/mci010. [DOI] [PMC free article] [PubMed] [Google Scholar]
- Chepurnov V.A., Mann D.G., Vyverman W., Sabbe K., Danielidis D., Mann D.G., Vyverman W., Sabbe K., Danielidis D., Vyverman W., Sabbe K., Danielidis D., Sabbe K., Danielidis D., Danielidis D. Sexual reproduction, mating system, and protoplast dynamics of Seminavis (Bacillariophyceae) J. Phycol. 2002;38:1004. [Google Scholar]
- Ciccarelli F.D., Doerks T., von Mering C., Creevey C.J., Snel B., Bork P., Doerks T., von Mering C., Creevey C.J., Snel B., Bork P., von Mering C., Creevey C.J., Snel B., Bork P., Creevey C.J., Snel B., Bork P., Snel B., Bork P., Bork P. Toward automatic reconstruction of a highly resolved tree of life. Science. 2006;311:1283–1287. doi: 10.1126/science.1123061. [DOI] [PubMed] [Google Scholar]
- Devos K.M., Brown J.K.M., Bennetzen J.L., Brown J.K.M., Bennetzen J.L., Bennetzen J.L. Genome size reduction through illegitimate recombination counteracts genome expansion in Arabidopsis. Genome Res. 2002;12:1075–1079. doi: 10.1101/gr.132102. [DOI] [PMC free article] [PubMed] [Google Scholar]
- Diaz-Uriarte R., Garland T.J., Garland T.J. Effects of branch length on the performance of phylogenetically independent contrasts. Syst. Biol. 1998;47:654–672. doi: 10.1080/106351598260653. [DOI] [PubMed] [Google Scholar]
- Duvall M.R., Ervin A.B., Ervin A.B. 18S gene trees are positively misleading for monocot/dicot phylogenetics. Mol. Phylogenet. Evol. 2004;30:97–106. doi: 10.1016/s1055-7903(03)00187-8. [DOI] [PubMed] [Google Scholar]
- Embley M.T., Martin W., Martin W. Eukaryotic evolution, changes and challenges. Nature. 2006;440:623–630. doi: 10.1038/nature04546. [DOI] [PubMed] [Google Scholar]
- Felsenstein J. Phylogenies and the comparative method. Am. Nat. 1985;125:1–15. [Google Scholar]
- Garland T., Jr. Rate tests for phenotypic evolution using phylogenetically independent contrasts. Am. Nat. 1992;140:509–519. doi: 10.1086/285424. [DOI] [PubMed] [Google Scholar]
- Garland T., Jr., Dickerman A.W., Janis C.M., Jones J.A., Dickerman A.W., Janis C.M., Jones J.A., Janis C.M., Jones J.A., Jones J.A. Phylogenetic analysis of covariance by computer simulation. Syst. Biol. 1993;42:265–292. [Google Scholar]
- Gregory T.R. Coincidence, coevolution, or causation? DNA content, cell size, and the C-value enigma. Biol. Rev. Camb. Philos. Soc. 2001;76:65–101. doi: 10.1017/s1464793100005595. [DOI] [PubMed] [Google Scholar]
- Gregory T.R. A bird's-eye view of the C-value enigma: Genome size, cell size, and metabolic rate in the class aves. Evolution Int. J. Org. Evolution. 2002;56:121–130. doi: 10.1111/j.0014-3820.2002.tb00854.x. [DOI] [PubMed] [Google Scholar]
- Gregory T.R. Is small indel bias a determinant of genome size? Trends Genet. 2003;19:485–488. doi: 10.1016/S0168-9525(03)00192-6. [DOI] [PubMed] [Google Scholar]
- Gregory T.R. The C-value enigma in plants and animals: A review of parallels and an appeal for partnership. Ann. Bot. 2005;95:133–146. doi: 10.1093/aob/mci009. [DOI] [PMC free article] [PubMed] [Google Scholar]
- Hinegardner R.R., Rosen D.E., Rosen D.E. Cellular DNA content and the evolution of Teleostean fishes. Am. Nat. 1972;106:621–644. [Google Scholar]
- Huynen M.A., van Nimwegen E., van Nimwegen E. The frequency distribution of gene family sizes in complete genomes. Mol. Biol. Evol. 1998;15:583–589. doi: 10.1093/oxfordjournals.molbev.a025959. [DOI] [PubMed] [Google Scholar]
- Kazazian H.H., Jr. Mobile elements: Drivers of genome evolution. Science. 2004;303:1626–1632. doi: 10.1126/science.1089670. [DOI] [PubMed] [Google Scholar]
- Knight C.A., Ackerly D.D., Ackerly D.D. Variation in nuclear DNA content across environmental gradients: A quantile regression analysis. Ecol. Lett. 2002;5:66–76. [Google Scholar]
- Knight C.A., Molinari N.A., Petrov D.A., Molinari N.A., Petrov D.A., Petrov D.A. The large genome constraint hypothesis: Evolution, ecology and phenotype. Ann. Bot. 2005;95:177–190. doi: 10.1093/aob/mci011. [DOI] [PMC free article] [PubMed] [Google Scholar]
- Kozlowski J., Konarzewski M., Gawelczyk A.T., Konarzewski M., Gawelczyk A.T., Gawelczyk A.T. Cell size as a link between noncoding DNA and metabolic rate scaling. Proc. Natl. Acad. Sci. 2003;100:14080–14085. doi: 10.1073/pnas.2334605100. [DOI] [PMC free article] [PubMed] [Google Scholar]
- Kunkel T.A. Misalignment-mediated DNA synthesis errors. Biochemistry. 1990;29:8003–8011. doi: 10.1021/bi00487a001. [DOI] [PubMed] [Google Scholar]
- Lewontin R.C., Cohen D., Cohen D. On population growth in a randomly varying environment. Proc. Natl. Acad. Sci. 1969;62:1056–1060. doi: 10.1073/pnas.62.4.1056. [DOI] [PMC free article] [PubMed] [Google Scholar]
- Luscombe N.M., Qian J., Zhang Z., Johnson T., Gerstein M., Qian J., Zhang Z., Johnson T., Gerstein M., Zhang Z., Johnson T., Gerstein M., Johnson T., Gerstein M., Gerstein M. Genome Biol. Vol. 3. 2002. The dominance of the population by a selected few: Power-law behavior applies to a wide variety of genomic properties. RESEARCH0040. [DOI] [PMC free article] [PubMed] [Google Scholar]
- Lynch M., Conery J.S., Conery J.S. The origins of genome complexity. Science. 2003;302:1401–1404. doi: 10.1126/science.1089370. [DOI] [PubMed] [Google Scholar]
- Paradis E., Claude J., Strimmer K., Claude J., Strimmer K., Strimmer K. APE: Analyses of phylogenetics and evolution in R language. Bioinformatics. 2004;20:289–290. doi: 10.1093/bioinformatics/btg412. [DOI] [PubMed] [Google Scholar]
- Petrov D.A. Evolution of genome size: New approaches to an old problem. Trends Genet. 2001;17:23–28. doi: 10.1016/s0168-9525(00)02157-0. [DOI] [PubMed] [Google Scholar]
- Petrov D.A. Mutational equilibrium model of genome size evolution. Theor. Popul. Biol. 2002;61:531–544. doi: 10.1006/tpbi.2002.1605. [DOI] [PubMed] [Google Scholar]
- Petrov D.A., Sangster T.A., Johnston J.S., Hartl D.L., Shaw K.L., Sangster T.A., Johnston J.S., Hartl D.L., Shaw K.L., Johnston J.S., Hartl D.L., Shaw K.L., Hartl D.L., Shaw K.L., Shaw K.L. Evidence for DNA loss as a determinant of genome size. Science. 2000;287:1060–1062. doi: 10.1126/science.287.5455.1060. [DOI] [PubMed] [Google Scholar]
- R Development Core Team . 2006. R: A language and environment for statistical computing. R Foundation for Stastistical Computing, Vienna. [Google Scholar]
- Sanderson M.J. A nonparametric approach to estimating divergence times in the absence of rate constancy. Mol. Biol. Evol. 1997;14:1218–1231. [Google Scholar]
- Shuter B.J., Thomas J.E., Taylor W.D., Zimmerman A.M., Thomas J.E., Taylor W.D., Zimmerman A.M., Taylor W.D., Zimmerman A.M., Zimmerman A.M. Phenotypic correlates of genomic DNA content in unicellular eukaryotes and other cells. Am. Nat. 1983;122:26–44. [Google Scholar]
- Smith G.P. Evolution of repeated DNA sequences by unequal crossover. Science. 1976;191:528–535. doi: 10.1126/science.1251186. [DOI] [PubMed] [Google Scholar]
- Soltis D.E., Soltis P.S., Soltis P.S. Polyploidy: Recurrent formation and genome evolution. Trends Ecol. Evol. 1999;14:348–352. doi: 10.1016/s0169-5347(99)01638-9. [DOI] [PubMed] [Google Scholar]
- van Nimwegen E. Scaling laws in the functional content of genomes. Trends Genet. 2003;19:479–484. doi: 10.1016/S0168-9525(03)00203-8. [DOI] [PubMed] [Google Scholar]
- Veldhuis M.J.W., Cucci T.L., Sieracki M.E., Cucci T.L., Sieracki M.E., Sieracki M.E. Cellular DNA content of marine phytoplankton using two new fluorochromes: Taxonomic and ecological implications. J. Phycol. 1997;33:527–541. [Google Scholar]
- Vinogradov A.E. Nucleotypic effect in homeotherms: Body-mass-corrected basal metabolic rates of mammals is related to genome size. Evolution Int. J. Org. Evolution. 1995;49:1249–1259. doi: 10.1111/j.1558-5646.1995.tb04451.x. [DOI] [PubMed] [Google Scholar]
- Vinogradov A.E. Nucleotypic effect in homeotherms: Body-mass independent resting metabolic rate of passerine birds is related to genome size. Evolution Int. J. Org. Evolution. 1997;51:220–225. doi: 10.1111/j.1558-5646.1997.tb02403.x. [DOI] [PubMed] [Google Scholar]
- Vinogradov A.E. Selfish DNA is maladaptive: Evidence from the plant Red List. Trends Genet. 2003;19:609–614. doi: 10.1016/j.tig.2003.09.010. [DOI] [PubMed] [Google Scholar]
- Vinogradov A.E. Evolution of genome size: Multilevel selection, mutation bias or dynamical chaos? Curr. Opin. Genet. Dev. 2004a;14:620–626. doi: 10.1016/j.gde.2004.09.007. [DOI] [PubMed] [Google Scholar]
- Vinogradov A.E. Genome size and extinction risk in vertebrates. Proc. R. Soc. Lond. B. Biol. Sci. 2004b;271:1701–1705. doi: 10.1098/rspb.2004.2776. [DOI] [PMC free article] [PubMed] [Google Scholar]
- Walbot V., Petrov D.A., Petrov D.A. Gene galaxies in the maize genome. Proc. Natl. Acad. Sci. 2001;98:8163–8164. doi: 10.1073/pnas.161278798. [DOI] [PMC free article] [PubMed] [Google Scholar]
- Wright S., Finnegan D., Finnegan D. Genome evolution: Sex and the transposable element. Curr. Biol. 2001;11:296–299. doi: 10.1016/s0960-9822(01)00168-3. [DOI] [PubMed] [Google Scholar]
- Zhu Y., Dai J., Fuerst P.G., Voytas D.F., Dai J., Fuerst P.G., Voytas D.F., Fuerst P.G., Voytas D.F., Voytas D.F. Controlling integration specificity of a yeast retrotransposon. Proc. Natl. Acad. Sci. 2003;100:5891–5895. doi: 10.1073/pnas.1036705100. [DOI] [PMC free article] [PubMed] [Google Scholar]


