

Abstract
Small insertions and deletions (indels) and single nucleotide polymorphisms (SNPs) are common genetic variants that are thought to be associated with a wide variety of human diseases. Owing to the genome’s size and complexity, manually characterizing each one of these variations in an individual is not practical. While significant progress has been made in automated single-base mutation discovery from the sequences of diploid PCR products, automated and reliable detection of indels continues to pose difficult challenges. In this paper, we present PolyScan, an algorithm and software implementation designed to provide de novo heterozygous indel detection and improved SNP identification in the context of high-throughput medical resequencing. Tests on a human diploid PCR-based sequence data set, consisting of 90,270 traces from 13 genes, indicate that PolyScan identified ∼90% of the 151 consensus indel sites and ∼84% of the 1546 heterozygous indels previously identified by manual inspection. Tests on tumor-derived data show that PolyScan better identifies high-quality, low-level mutations as compared with other mutation detection software. Moreover, SNP identification improves when reprocessing the results of other programs. These results suggest that PolyScan may play a useful role in the post human genome project research era.
The study of the genetic bases of complex diseases, such as diabetes, heart disease, and cancer, requires the accurate identification of genomic variations and genetic mutations at different levels of resolution. Techniques have successfully been established in a number of areas. For example, common single nucleotide polymorphism (SNP) genotyping can be performed at 99.9% accuracy using SNP arrays (Gunderson et al. 2005; Hinds et al. 2005; The International HapMap Consortium 2005). Large structural variations, such as in copy number, can also be studied by various methods (Fredman et al. 2004; Iafrate et al. 2004; Conrad et al. 2006). Conversely, our understanding of small-scale insertions and deletions (indels) is far less advanced (Tuzun et al. 2005; Conrad et al. 2006).
Mills et al. (2006) report that indels may account for up to 25% of all sequence polymorphisms in humans (∼10 M), over one-third of which could be within known genes. This represents an average density of one indel per 7.2 kb of DNA. A similar figure was reported in other studies of human chromosome 22 (Mullikin et al. 2000; Dawson et al. 2001). Although less prevalent than substitutions, indels raise a greater probability of deleterious biological effects since they are more likely to disrupt protein structures or to interfere with the functions of coding, splicing, and regulatory sequence elements.
Small indels have been found in >500 genes that are linked to diseases such as cystic fibrosis, acute episodic ataxia, spinocerebellar ataxia (SCA types 1,2,3,6,7), Huntington’s Disease (HD), Fragile X Syndrome, various ataxias, and Myotonic Dystrophy (Ball et al. 2005). Transposable elements also can be implicated in indel-related human diseases such as hemophilia, neurofibromatosis, muscular dystrophy, and cancer (Ostertag and Kazazian 2001). Indels in certain genes, e.g., FLT3, NPM1, ERBB2, and EGFR, also have been postulated to play a role in acute myeloid leukemia (AML) and non-small-cell lung cancer (Ley et al. 2003; Strausberg et al. 2003; Pao et al. 2004; Cox et al. 2005). Since it is clear that indels play an important role in biological processes and human disease, their accurate detection, annotation, and characterization are critical for high-throughput human resequencing studies.
Directed sequencing of genomic DNA is presently the most effective analytic and diagnostic approach to indel identification. This technique contrasts with mutation-specific genotyping, which can detect only known sequence variations and is limited to single base changes. While homozygous indels are readily located by identifying gaps in the alignment of the sequences, the more common heterozygotic indels pose a number of non-trivial difficulties. First, when aligning sequence traces to a reference sequence, multiple alignments are possible when these traces contain signals from dissimilar alleles. Second, phase-shifted signals, along with the background noise routinely found in dye terminator sequence traces of PCR products, confuse the standard base-calling algorithms that were originally designed to analyze sequences from cloned DNA (Ewing and Green 1998; Ewing et al. 1998). Lastly, the heterogeneous nature of acquired somatic mutations and the chromosomal rearrangements often present in tumor-derived samples may result in a skewed ratio of allele signal intensities. The combination of these issues leads to lowered sensitivity in most of the current indel detection software tools (Nickerson et al. 1997; Weckx et al. 2005; Stephens et al. 2006).
Indels are routinely mischaracterized in a number of ways. In particular, signature trace patterns are interpreted as low quality data or identified as multiple heterozygous SNPs with irregular alignments. Also, the lower intensity allele can be incorrectly filtered as background noise or signal contamination. Regions of high GC content and low sequence complexity, e.g., microsatellite repeats and homopolymeric/mononucleotide repeats, may be hot spots of indel acquisition, yet they present significant challenges to accurate PCR amplification and dye terminator sequencing. Manual evaluation is normally required to correct computational predictions, despite the high error rate and intrinsic inconsistencies resulting from subjective interpretation.
While significant advancements have been made for SNP discovery and detection in PCR-amplified genomic DNA samples, progress in indel detection and annotation has been rather limited. We have addressed this problem with a new algorithm and software implementation called PolyScan. In particular, PolyScan is intended to provide de novo heterozygous indel detection functionality with high sensitivity and improved specificity that is adjustable, according to different needs. Furthermore, PolyScan increases SNP identification accuracy by selectively combining the results of existing SNP detection programs, especially those mentioned above. Most variant discovery pipelines rely on a sequential, multi-program strategy, e.g., phred/phrap/PolyPhred or phred/SIM/SNPdetector, that tend to propagate errors. For example, secondary alleles miscalled by phred lead to genotyping errors in PolyPhred and SNPdetector. Conversely, PolyScan was designed as a fully integrated approach, combining base calling, sequence alignment, and indel/SNP detection into a single program to reduce the extent of error propagation (see Methods).
Results
Indel detection for polymorphism discovery
We tested PolyScan (version 2.0) on a subset of diploid traces used by Stephens et al. (2006) and obtained from http://droog.mbt.washington.edu/poly_data.html. Of the 26 genes that were manually annotated, 13 contained indels at 151 chromosomal locations (Supplemental Table 1). Heterozygous alleles were found at each of these 151 sites across various sets of samples that were sequenced for each gene. Homozygous rare alleles were found only at 83 sites (55.0%). Altogether, there are a total of 1546 occurrences of heterozygous indel sites among individual samples, almost exactly half of which are 1-bp indels (Supplemental Table 2). The sequences of a DNA sample are usually represented by multiple overlapping reads produced by different amplicons in different orientations. Consequently, we will use the term “read sites” to represent variant sites that were identified from individual reads and the term “sample sites” to represent variant sites identified for individual samples.
We processed all 90,270 traces using phred and aligned them to corresponding GenBank reference sequences using the Consed cross-match algorithm (Gordon et al. 1998). We ran PolyScan on each of these 13-gene data sets and compared the predicted annotations with those generated manually. Because the available manual annotations are lists of sample sites, whereas the predicted annotations are lists of read sites, a formal system is required to compare annotations at two different levels. There is no standard way to combine read sites into sample sites. The possibility of biased amplification means that reads sequenced from the same sample by overlapping amplicons are not necessarily a uniform representation of a diploid DNA sequence. In addition, reads of different qualities may not contribute equal confidence to the determination of sample sites. Moreover, because the locations of the indel sites are inherently ambiguous in repetitive regions, conclusive matches to manual annotation cannot routinely be obtained. Consequently, we make use of the following rule: a sample site is correctly identified if at least one read site from any of its associated reads lies within a fixed interval of W bp, where W is a variable controlling the stringency of comparison. Detection sensitivity is thus defined at the sample level as the ratio of the number of correctly identified sample sites to the total number of sample sites in the manual annotation. Conversely, the specificity is defined at the read level as the number of predicted read sites that hit sample sites divided by the total number of predicted read sites.
Accuracy of indel identification
We first ran PolyScan in single (S) mode in which each read is analyzed independently. At a score threshold of 10 and W = 50, 1248 sample sites (80.72%) and 138 consensus sites (91.39%) were found with 29.14% specificity. We then ran PolyScan in group (G) mode, where overlapping reads from different samples that contain similar indel patterns are grouped together to scan for a common indel site. Owing to the increased read depth, PolyScan was able to correctly identify 1297 sample sites (83.89%) and 134 consensus sites (88.74%) with 29.85% specificity.
We manually examined all consensus sites that were overlooked by PolyScan when executed in G mode. Out of 17 missed sites, 14 have estimated minor allele frequencies (MAFs) <0.1, 11 have estimated MAFs <0.01, and nine are singletons (only one sample is heterozygous at this position). Visual inspection in Consed indicated that 10 of these 17 sites were actually detected by PolyScan with exact sizes, but were placed >50 bp away from their target locations (including the three sites that have MAFs >0.1). Of the seven undetected, six were singletons, four were covered by low-quality reads having significant background signal, and one was immediately (40 bp) downstream of another indel site. Only two singleton sites were missed for no apparent reason.
For comparison, we ran PolyPhred (version 6.0 beta) on the same data using default parameters and evaluated its performance under the same criteria. At a threshold of 90, PolyPhred correctly identified 1057 sample sites (68.37%) and 114 consensus sites (75.50%) with 34.53% specificity. When a threshold of 70 was used, 1109 sample sites (71.73%) and 120 consensus sites (79.47%) were found with 22.16% specificity.
Plotting sensitivity versus specificity at various score thresholds (Fig. 1) revealed that PolyScan G mode achieved a better sensitivity/specificity tradeoff than either PolyScan S mode or PolyPhred 6.0b. We further dissected the overall sensitivity by plotting the percentage of missed sample sites versus indel sizes and found that PolyScan G mode performed the best for a wide range of indel sizes (Supplemental Fig. 1; Supplemental Table 2).
Figure 1.

Heterozygous indel detection sensitivity vs. specificity for PolyScan v2.0 G mode, PolyScan v2.0 S mode, and PolyPhred v6.0b over a data set of 13 genes for W = 50.
Accuracy of indel size identification
To test how accurately PolyScan identifies indel sizes, we increased the stringency of our evaluation criteria. Besides requiring computational indels to reside within 50 bp of manually annotated ones, we also required the sizes of the predicted indels to exactly match those in the manual annotation. Here, PolyScan correctly identified 1223 sample sites in S mode and 1254 sample sites in G mode. In light of the figures reported above, it appears that 1223 of 1248 indels (97.9%) are identified with the exact sizes in S mode and 96.7% (1254 of 1297) in G mode. These numbers compare quite favorably with PolyPhred 6.0b, whose accuracy we found to be 1003 of 1057 (94.5%) at a threshold of 90 and 1044 of 1109 (94.1%) at a threshold of 70.
Accuracy of indel location
We further assessed the accuracy of predicted indel locations by plotting the sample site sensitivity as a function of W, which varies from 0 to 100 (Fig. 2). It is clear that PolyScan G mode locates indel sites more accurately than both PolyScan S mode and PolyPhred 6.0b. In PolyScan G mode, 79.50% of the computational sites are located within 30 bp of the manually annotated sites, 73.67% are within 10 bp, and 66.24% are within 5 bp. In PolyScan S mode, these numbers are 72.57%, 62.81%, and 57.83%, respectively. In PolyPhred 6.0b, we find 66.17%, 58.34%, and 48.71%, respectively. Although the G mode of PolyScan did not significantly improve the overall sensitivity and specificity, it significantly improved the accuracy in identifying indel locations, which ultimately can lead to more accurate genotyping.
Figure 2.

Percentage of sample sites detected within W bp of the manually tagged locations.
Indel detection for mutation discovery
We have incorporated PolyScan into our mutation discovery pipeline for analyzing putative oncogenes and tumor suppressor genes which themselves have previously characterized indels. All data described in the analysis below originated from this pipeline and have previously undergone extensive expert manual review and annotation.
We analyzed Nucleophosmin (NPM1), a gene that encodes a nucleo-cytoplasmic shuttling protein with prominent nucleolar localization. This gene is thought to be involved in several different oncogenic processes, including the ARF–p53 pathway (Verhaak et al. 2005; Thiede et al. 2006). In particular, mutations in the NPM1 gene have been found in 25%–35% of primary tumor cells from AML patients. The most common alteration found is an insertion of 4 bp near positions 956 through 959 of the mRNA reference sequence (GenBank accession number NM_002520) in the protein-coding sequence of the last exon that affects the C terminus of NPM1 and results in its cellular mislocalization. A simple repeat directly upstream of the last exon causes difficulties in amplification and sequencing of this region. Consequently, only sequence from the negative strand was of sufficient quality for analysis in these samples. In addition to the C-terminal alteration, a 1-bp deletion site having a frequency of ∼60% occurs in the 3′ UTR, 187 bp downstream of the 4-bp frameshift mutation. Altogether, there were 384 reads included in this study, sequenced from 94 samples using two amplicons. We believe that this data set is representative of the larger, more comprehensive data sets that now are being produced by high-throughput sequencing pipelines. The data include both high-quality and low-quality traces, simple repetitive regions, and closely located indel sites, all of which pose difficulties for both sequencing and analysis.
The initial run of PolyScan G mode for this data set, using default parameters, identified 38 of 39 (97.4%) 1-bp heterozygous deletions and 24 of 31 (77.4%) 4-bp heterozygous insertions, with 62 of 80 (77.5%) specificity. The integrated base recalling approach (see Methods) allows PolyScan to realize enhanced sensitivity on normal-cell-contaminated samples by appropriate adjustment of the parameters. For example, when we reanalyzed these data by PolyScan, with the secondary/primary peak ratio reduced from the default value of 0.15 to 0.10, the sensitivity improved to 39 of 39 (100%) at the deletion site, and 27 of 31 (87.1%) at the insertion site, with 66 of 76 (86.8%) specificity. Combining the results of these two PolyScan runs gave an overall sensitivity of 39 of 39 (100%) at the deletion site and 29 of 31 (93.5%) at the insertion site, with 68 of 89 (76.4%) specificity. In our evaluation, the indels were tallied as being correctly identified only if they had the exact sizes and were located within 5 bp of the manual annotations.
For comparison, we ran Mutation Surveyor v3.0 (MS3) on this data set, as well. MS3 is designed to directly identify mutation patterns in each chromatogram without making explicit base calls and quality estimations. MS3 detected 37 of 39 (94.9%) indels at the deletion site and 27 of 31 (87.1%) at the insertion site (including two instances that are >5 bp off the target), at a threshold of 0. The indel sizes were all correctly identified, but their locations varied around the true target locations due to MS3’s trace-specific analysis.
Although MS3 did identify mutations that were overlooked by both PolyScan runs on low-quality traces (Supplemental Fig. 2), it missed high-quality, low-level mutations that PolyScan detected with enhanced sensitivity (Supplemental Fig. 3). The specificity of MS3 on this data set is only 64 of 305 (21.0%) at a threshold of 0, with most false positives predicted in low-quality regions of the traces. At a threshold of 10, specificity improved to 62 of 152 (40.8%) while sensitivity dropped to 36 of 39 (92.3%) at the deletion site and 26 of 31 (83.9%) at the insertion site. Because MS3 can process only 400 traces in a single project, we were unable to expand our comparative study on larger data sets.
We also ran PolyPhred 6.0b on this data set using default parameters. At a threshold of 50, it detected 28 of 39 (71.8%) indels at the 1-bp deletion site, but only 5 of 31 (16.1%) at the 4-bp insertion site, with 33 of 45 (73.33%) specificity. Further analysis revealed that eight of the 1-bp deletion sites that were counted as false positives were actually detected 80 bp downstream of their correct locations. If these eight sites are considered to be correct, the sensitivity at the 1-bp site becomes 36 of 39 (92.3%), and the overall specificity is then 41 of 45 (91.1%). At a threshold of 90, PolyPhred detected 23 of 39 (71.8%) indels at the deletion site and found 0 of 31 (0%) at the insertion site with 23 of 29 (79.31%) specificity. Results for the entire assessment exercise for NPM1 are summarized in Table 1.
Table 1.
Heterozygous indel detection sensitivity (%) and specificity (%) of PolyScan v2.0, Mutation Surveyor v3.0, and PolyPhred v6.0b run under various parameters on the NPM1 data set

In this analysis, predicted indel sites are required to be within 5 bp of the target sites to be counted as correct.
SNP identification
The SNP discovery component of PolyScan was designed to provide additional confidence scores for SNPs and genotypes on the basis of considering an extended set of trace characteristics. We evaluated the SNP prediction performance of PolyScan using two large-scale data sets. In both sets, PolyScan was used to combine the SNP sites predicted by PolyPhred and SNPdetector (Zhang et al. 2005) by rescoring the polymorphic sites tagged by either program. PolyPhred v5.03 and SNPdetector v2 were run in these tests with the default parameters.
Test using human resequencing data
The first data set was generated at the Washington University Genome Sequencing Center and consists of 20,149 traces and 70 manually validated SNP sites from five genes (AKT3, ARAF, ERBB4, FGFR2, and FGFR4). Overall, PolyPhred v5.03 achieved the best sensitivity (Supplemental Fig. 4) on this data set. In particular, 66 of 70 (94.29%) of validated SNPs were detected at score 50. However, it showed a rather low specificity of ∼40% over its scoring range (including 99). In comparison, SNPdetector v2 showed an improved specificity for all of its six score categories (reject, low3, low2, low1, medium, and high), although at the cost of lowered sensitivity (<80%). PolyScan achieved better performance than either program in terms of specificity and sensitivity. Specifically, PolyScan’s sensitivity was comparable to that of PolyPhred, but it improved upon PolyPhred specificity by ∼15%, on average. Conversely, PolyScan achieved specificity comparable to SNPdetector, but with 5%–10% higher sensitivity. In this particular test, we found that SNPdetector identified the same set of SNPs as did PolyPhred. It therefore appears that simply combining the results of SNPdetector and PolyPhred does not necessarily improve overall sensitivity.
SNP identification in an ENCODE region
The second data set was obtained from the NCBI trace archive, and includes sequence data from 48 individuals. It consists of 100,704 traces that encompass 1403 validated SNP sites across a 500-kb ENCODE region (ENm013) on human chromosome 7q21.13. The traces were produced by the Broad Institute, and the same samples were subsequently genotyped by Perlegen as part of the HapMap project (The International HapMap Consortium 2005). These traces were base-called by phred and aligned and assembled to the NCBI build 35 reference sequence using cross-match. In order to make an objective comparison, identical inputs were formulated for each of the programs, and consisted of trace data, PHD files, and Consed ACE files. The predicted SNP sites from each program were then compared with the Perlegen genotype data for 39 individuals released by the HapMap Project (www.hapmap.org). The entire evaluation was performed automatically, without any manual intervention.
Results similar to the first test were obtained (Supplemental Fig. 5). At high sensitivity, PolyScan achieved ∼3% higher specificity than PolyPhred, with a slight loss of sensitivity (reduced from 88.7% to 88.1%). PolyScan also showed a better combination of sensitivity and specificity than did SNPdetector. Further analysis revealed that, out of 1403 confirmed SNP sites, SNPdetector identified only four of the 62 SNP sites that were missed by PolyPhred. This again suggests that the sensitivity of SNP prediction cannot be improved simply by combining the outputs from PolyPhred and SNPdetector.
Discussion
Whole-genome association studies are quickly becoming critical in the quest to understand complex genetic diseases. There is now an urgent demand for software that can automatically and accurately identify DNA polymorphisms or mutations in genomic regions of interest. The diploid-based indel detection problem remains unsolved, largely due to the absence of a mathematical formulation that integrates sequence evidence over a large genomic region (typically hundreds of base pairs) characterized by multiple traces. The algorithm we propose here represents a considerable advance for heterozygous indel detection and genotyping. The Bayesian probabilistic approach enables integration of various kinds of evidence into a single confidence score through an elegant probabilistic framework. As a result, PolyScan can group sequence reads according to indel patterns, analyzing them as a population. Moreover, it exploits known reference sequences and polymorphism sites to calculate prior probabilities. Finally, it can be expanded to include enhanced quality measures of the four-channel diploid traces and can include additional evidence from homozygous indels detected at the same location. Such integration allows PolyScan to achieve enhanced statistical power and good tradeoffs between sensitivity and specificity.
Like the other programs we evaluated, PolyScan’s performance varies by project and depends strongly on the quality of the data. The ∼90% sensitivity associated with the 13-gene data set (Stephens et al. 2006) probably represents the average performance one could expect. This result is acceptable for polymorphism discovery, given that most of the overlooked sites in our data are singletons or rare variants (MAF <0.1) that are not particularly informative. We anticipated special difficulties with tumor samples because they are frequently “contaminated” by normal adjacent stroma. Consequently, we incorporated a base re-calling component that allows tracking of low-intensity signals in all four fluorescent channels. This feature provides enhanced sensitivity over phred in analyzing tumor samples, as was demonstrated in our NPM1 assessment. The sensitivity and specificity tradeoff compares favorably to other programs, especially on larger data sets generated by high-throughput sequencing pipelines. Such data are the focus of PolyScan. This is in contrast to tools such as Mutation Surveyor and InSNP (Manaster et al. 2005), which are designed to analyze small sets of traces with extensive manual intervention.
A distinct advantage of PolyScan’s ability to detect heterozygous indels from diploid PCR-based traces is the high degree of accuracy with which indel sizes can be determined. The long stretches of overlapping fluorescent peaks serve as physical landmarks, delimiting relative frame shifts between two alleles. The Sanger sequencing reaction is especially suited for this purpose because of its comparatively long (∼800 bp) read lengths. In other words, the resulting continuity allows medium-sized indels, i.e., those up to several hundred base pairs, to be resolved. This observation also implies that newer sequencing methods, e.g., pyrosequencing, which is expected to facilitate more sensitive and accurate mutation analysis, may have limitations due to both shorter read lengths (Brenner et al. 2000) and decreased accuracy in base-calling monomers (Margulies et al. 2005).
Despite the encouraging results shown here, some limitations remain. The lack of accurate quality measures in phase-shifted signals has restricted our ability to accurately distinguish low-quality traces from high-quality ones in regions that may contain heterozygous indels. Visual inspection of PolyScan results in Consed indicates that a large percentage of false positives are caused by low-quality traces having irregularly shaped peaks with poor resolution. In principle, future versions of PolyScan will likely address this problem via a learned quality function, similar to what phred uses, to estimate independent quality scores in each of the channels. Such a function can be calibrated using sequence data that are genotyped and validated by multiple independent platforms (e.g., the ENCODE project). Applying heuristics may help improve the specificity as well. For example, we found that the specificity of PolyScan can be improved to 49.09% on the 13-gene data set by simply not reporting indels identified in the downstream of poly tracks of eight or more repeats with only 3.52% loss of sensitivity. The Bayesian probabilistic framework we applied could be further extended to include multiple base-calling possibilities at each position, and might implement allele-based analysis in each fluorescence channel. This will eventually allow us to explore the full potential of mutation detection based on Sanger sequencing.
Methods
Materials
A subset of 26 genes used by Stephens et al. (2006) was also used here for indel analysis. These were obtained from http://droog.mbt.washington.edu/poly_data.html (Supplemental Table 1). Data for the ENCODE region Enm013 were generated by the Broad Institute and were procured from the NCBI trace archive. All remaining data, including traces for the NPM1 region, were produced by PCR amplification of either native or phi-29 (Φ-29) amplified genomic DNA using primers tailed with universal forward and reverse sequences. In particular, the NPM1 data set was derived from 94 AML tumor samples and provided 359 reads. PCR products were sequenced following treatment with Exo/SAP using BigDye v3.1 dye terminators and either forward or reverse universal primers. Sequence data were initially aligned to the NCBI Human Build 35 reference sequence using cross-match (http://www.phrap.org). Traces having tailed PCR primers were clipped to exclude primer sequences, but no further attempts were made to discard low-quality sequences from analysis. For NPM1, analysis focused specifically on the last exon and the 3′ UTR. Prediction errors in the form of true positives and false positives are determined from manual review by expert technicians of a variety of redundant, context-specific information within individual reads, the reference sequence, and from comparable reads. The latter are those reads acquired either from the same samples or from the same PCR products and obtained under similar experimental conditions. In addition, known variant sites from the public domain such as dbSNP (http://www.ncbi.nlm.nih.gov/projects/SNP/) are also annotated in the assembled sample reads.
Algorithmic methods
PolyScan takes an integrated approach, combining base calling, alignment, statistical sequence analysis, and indel and SNP identification into a single program. Figure 3 shows a schematic view of the PolyScan algorithm. Each of these programmatical aspects is described in greater detail, as follows.
Figure 3.

Overview of PolyScan v2.0 calculation sequence. PolyScan takes as input a set of chromatogram files, phd files created by base callers such as phred, a Consed ace file containing first-pass assembly information, and a set of candidate SNP positions predicted by other software or extracted from public domain data. It outputs a set of putative heterozygous indels and SNPs.
Base re-calling
PolyScan currently takes a Consed-generated “ace” file as input, along with the associated “phd” files containing the called bases, positions, and quality scores. It first reanalyzes the chromatograms using the called base positions as initial conditions and boundaries to search for additional peaks in each of the four fluorescence channels. Peaks and valleys are located at positions where the channel signal reaches local extrema and the first derivative changes sign. The first derivatives using pixels on the left and the right side of a peak are used to estimate the top angle θ in radians. The sharpness of a peak is calculated using φ = tanh(θ/π). The pixels on the left of each identified peak are folded over on top of the pixels on the right and a linear regression is performed to minimize the mean square fitting error. Four statistics are stored for each of the peaks (Supplemental Fig. 6): position, height, sharpness, and regularity (the regression coefficients R2). As compared with the “poly” files produced by phred, these statistics provide a more accurate representation of the trace signals and facilitate more accurate pattern recognition.
Noise reduction
Noise reduction is the process of differentiating true peaks from background noise. The program advances through each fluorescent channel using overlapping 30-bp windows, tracking height, sharpness, and regularity of each peak. Two Gaussian mixture models are integrated into a log-likelihood test statistic. This statistic asymptotically follows a χ2 distribution, enabling standard significance testing to be used (Supplemental materials). We currently assume that the sequencing traces under analysis are products of bi-allelic template mixtures and can therefore be adequately represented as sequences of genotypes (two bases per position). Therefore, maximally two peaks at each position are extracted to form a genotype sequence representing the observed sequence of chromatographic peaks.
Heterozygous indel signature identification
The non-reference sequence is now inferred from the deduced genotype sequences by subtracting the reference sequence (Fig. 4A) from the genotype sequence. Ideally, if the base calls and the alignments are perfect, the error rate in the non-reference sequence would not be higher than the SNP rate, i.e., roughly one per 200 bp (Fig. 4B). However, errors can be substantially higher in regions having miscalled, over-called, or under-called bases. This is observed most often at positions where peak resolution is low or where the alignment between the reference sequence and the genotype sequence is ambiguous (Fig. 4C,D).
Figure 4.

Illustration of heterozygous indel signature identification in PolyScan. (A) The reference genomic DNA, (B) ideal genotype sequence with no base-calling or phase inference errors, (C) actual deduced genotype sequence with various degrees of base-calling and phase inference errors, (D) the inferred non-reference sequence, (E) alignment of the non-reference and reference sequences using the segmented alignment algorithm. The 4-bp deletion indel was concluded from multiple subsequence alignment.
Computations based on such a subtraction algorithm can only reliably detect heterozygous indels that are much shorter than the amplicon size. We overcome this problem by using a segmented alignment algorithm that is both independent of the size of the amplicon and more tolerant of errors in the non-reference sequence (Fig. 4E). Specifically, a set of overlapping subsequences S′ = {s1,s2, · · ·, sN} is selected from the non-reference sequence, each 20 bp in length (adjustable) with an average heterozygote rate of ≥0.3. The selected subsequences are aligned to the reference sequence using a simplified Smith–Waterman algorithm that uniformly penalizes gap openings and gap extensions for computational reduction. The scoring matrix is configured such that external gaps at the beginning or the end of the subsequence are not penalized while internal gaps are heavily penalized. Two statistics are saved for each of the N alignments: the alignment shift hi (relative to the original position of subsequence si) and the percent identity match mi. These statistics are used to compute a score Qv for each uniquely observed alignment shift v:
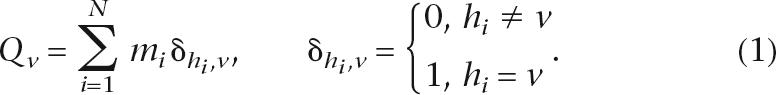 |
The highest scoring v* is selected:
If v* is non-zero, the union of all subsequences whose alignment shifts equal to v* is registered as a putative indel signature and is subjected to further analysis. Our tests show that this procedure is much less sensitive to base-calling and phase errors in the non-reference sequence and significantly increases the sensitivity of indel signature detection in low-quality traces.
Heterozygous indel identification
After the putative indel signatures are computed, PolyScan attempts to group them according to similarity, as defined by adjustable parameters. In the single (S) mode, all indel signatures are considered independent of one another. In the group model (G), those from a common origin (e.g., the same sample or the same amplicon) are grouped together if they contain similar alignment shifts and are closely located in a genomic region. A single indel hypothesis is predicted from each pool of indel signatures through the following maximum a posteriori (MAP) procedure:
 |
where l, k, and b are the location, size, and type (het deletion or insertion) of indel, respectively. The starred notation on these variables represents the winning hypothesis that maximizes the a posteriori probability score. Finally, R denotes the group of reads in the pool, A the alignment of each read to the reference sequence, and N the reference sequence. Assuming reads in each pool are independent from one another, Equation 3 can be expanded as follows based on Bayes Theorem (Feller 1971):
 |
where ri denotes the genotype sequences decoded from the ith read in the pool and di the sequencing direction of ri. Also, P(l,k,b|N) represents the prior probability of an indel hypothesis (l,k,b), given N, and can be used to model various sequence motifs that are found to be overrepresented in the vicinity of indels. Such would include, for example, the heptanucleotide CCCC CTG that shares homology with the complement of the 8-bp human minisatellite conserved sequence/chi-like element (GCW GGWGG) (Ball et al. 2005).
The conditional probability P(ri|l,k,b,N,di) of each read given the indel hypothesis (l,k,b), is computed using a first order Markov Chain (MC) model in the current implementation:
 |
where j represents the position in the L-bp-long region, selected to cover all indel signatures in the group, ri,j is the genotype at position j in read i, and Θ(l,k,b,N,di) denotes an expected MC indel model. Parameters for this model can be estimated from the expected genotype sequence constructed, based on knowledge of the PCR amplicon and the known reference sequence N (Supplemental Fig. 7). Reads from opposite directions are differentially modeled to account for the difference in their expected genotype sequences and their alignments to the reference. Computational efficiency is enhanced by modeling the 5′ flanked indel signature region as two segments: the expected normal homozygous sequence upstream of the indel signature and the expected frame-shifted heterozygous sequence within the signature. Moreover, computational reduction proportional to L can be achieved by calculating P(ri|l,k,b,N) recursively from either P(ri|l − 1,k,b,N) or P(ri|l + 1,k,b,N). Note that the indel size k is limited only by N, not by L.
SNP identification
The last step of PolyScan is SNP identification. Like PolyPhred, SNPs are identified primarily as doublet peaks whose heights are roughly half of those observed in the homozygous individuals. Here, however, trace statistics extracted from the individual channels via the integral base re-calling and noise-reduction steps are used to conduct statistical analysis. Procedures called Horizontal Scan and Vertical Scan are performed: The former provides significance estimates of observed heterozygous trace patterns based on computed distance metrics within given reads; the latter furnishes information regarding heterozygous peak height variation among individuals using Gaussian mixture models and χ2 significance testing. More algorithmic details are described in the supplemental information.
Acknowledgments
We thank Tim Ley and the Genomics of AML PPG team (NCI PO1 CA101937, PI T. Ley) and William Pao and Harold Varmus for kindly allowing use of their genomic DNA samples for data production and analysis; Rick Meyer, Henry Bauer, Ling Lin, and Yuzhu Tang for testing PolyScan and providing helpful feedback; and David Dooling, John Osborne, and Nick Kellmeyer for compiling and deploying PolyScan. This work was supported by a grant from the National Human Genome Research Institute (HG003079, Principal Investigator R.K.W.).
Footnotes
[Supplemental material is available online at www.genome.org and http://genome.wustl.edu/tools/software/polyscan.cgi.]
Article published online before print. Article and publication date are at http://www.genome.org/cgi/doi/10.1101/gr.6151507
References
- Ball E.V., Stenson P.D., Abeysinghe S.S., Krawczak M., Cooper D.N., Chuzhanova N.A., Stenson P.D., Abeysinghe S.S., Krawczak M., Cooper D.N., Chuzhanova N.A., Abeysinghe S.S., Krawczak M., Cooper D.N., Chuzhanova N.A., Krawczak M., Cooper D.N., Chuzhanova N.A., Cooper D.N., Chuzhanova N.A., Chuzhanova N.A. Microdeletions and microinsertions causing human genetic disease: Common mechanisms of mutagenesis and the role of local DNA sequence complexity. Hum. Mutat. 2005;26:205–213. doi: 10.1002/humu.20212. [DOI] [PubMed] [Google Scholar]
- Brenner S., Johnson M., Bridgham J., Golda G., Lloyd D.H., Johnson D., Luo S., McCurdy S., Foy M., Ewan M., Johnson M., Bridgham J., Golda G., Lloyd D.H., Johnson D., Luo S., McCurdy S., Foy M., Ewan M., Bridgham J., Golda G., Lloyd D.H., Johnson D., Luo S., McCurdy S., Foy M., Ewan M., Golda G., Lloyd D.H., Johnson D., Luo S., McCurdy S., Foy M., Ewan M., Lloyd D.H., Johnson D., Luo S., McCurdy S., Foy M., Ewan M., Johnson D., Luo S., McCurdy S., Foy M., Ewan M., Luo S., McCurdy S., Foy M., Ewan M., McCurdy S., Foy M., Ewan M., Foy M., Ewan M., Ewan M., et al. Gene expression analysis by massively parallel signature sequencing (MPSS) on microbead arrays. Nat. Biotechnol. 2000;18:630–634. doi: 10.1038/76469. [DOI] [PubMed] [Google Scholar]
- Conrad D.F., Andrews T.D., Carter N.P., Hurles M.E., Pritchard J.K., Andrews T.D., Carter N.P., Hurles M.E., Pritchard J.K., Carter N.P., Hurles M.E., Pritchard J.K., Hurles M.E., Pritchard J.K., Pritchard J.K. A high-resolution survey of deletion polymorphism in the human genome. Nat. Genet. 2006;38:75–81. doi: 10.1038/ng1697. [DOI] [PubMed] [Google Scholar]
- Cox C., Bignell G., Greenman C., Stabenau A., Warren W., Stephens P., Davies H., Watt S., Teague J., Edkins S., Bignell G., Greenman C., Stabenau A., Warren W., Stephens P., Davies H., Watt S., Teague J., Edkins S., Greenman C., Stabenau A., Warren W., Stephens P., Davies H., Watt S., Teague J., Edkins S., Stabenau A., Warren W., Stephens P., Davies H., Watt S., Teague J., Edkins S., Warren W., Stephens P., Davies H., Watt S., Teague J., Edkins S., Stephens P., Davies H., Watt S., Teague J., Edkins S., Davies H., Watt S., Teague J., Edkins S., Watt S., Teague J., Edkins S., Teague J., Edkins S., Edkins S., et al. A survey of homozygous deletions in human cancer genomes. Proc. Natl. Acad. Sci. 2005;102:4542–4547. doi: 10.1073/pnas.0408593102. [DOI] [PMC free article] [PubMed] [Google Scholar]
- Dawson E., Chen Y., Hunt S., Smink L.J., Hunt A., Rice K., Livingston S., Bumpstead S., Bruskiewich R., Sham P., Chen Y., Hunt S., Smink L.J., Hunt A., Rice K., Livingston S., Bumpstead S., Bruskiewich R., Sham P., Hunt S., Smink L.J., Hunt A., Rice K., Livingston S., Bumpstead S., Bruskiewich R., Sham P., Smink L.J., Hunt A., Rice K., Livingston S., Bumpstead S., Bruskiewich R., Sham P., Hunt A., Rice K., Livingston S., Bumpstead S., Bruskiewich R., Sham P., Rice K., Livingston S., Bumpstead S., Bruskiewich R., Sham P., Livingston S., Bumpstead S., Bruskiewich R., Sham P., Bumpstead S., Bruskiewich R., Sham P., Bruskiewich R., Sham P., Sham P., et al. A SNP resource for human chromosome 22: Extracting dense clusters of SNPs from the genomic sequence. Genome Res. 2001;11:170–178. doi: 10.1101/gr.156901. [DOI] [PMC free article] [PubMed] [Google Scholar]
- Ewing B., Green P., Green P. Base-calling of automated sequencer traces using phred. II. Error probabilities. Genome Res. 1998;8:186–194. [PubMed] [Google Scholar]
- Ewing B., Hillier L., Wendl M.C., Green P., Hillier L., Wendl M.C., Green P., Wendl M.C., Green P., Green P. Base-calling of automated sequencer traces using phred. I. Accuracy assessment. Genome Res. 1998;8:175–185. doi: 10.1101/gr.8.3.175. [DOI] [PubMed] [Google Scholar]
- Feller W. An introduction to probability theory and its applications. Wiley; New York: 1971. [Google Scholar]
- Fredman D., White S.J., Potter S., Eichler E.E., Den Dunnen J.T., Brookes A.J., White S.J., Potter S., Eichler E.E., Den Dunnen J.T., Brookes A.J., Potter S., Eichler E.E., Den Dunnen J.T., Brookes A.J., Eichler E.E., Den Dunnen J.T., Brookes A.J., Den Dunnen J.T., Brookes A.J., Brookes A.J. Complex SNP-related sequence variation in segmental genome duplications. Nat. Genet. 2004;36:861–866. doi: 10.1038/ng1401. [DOI] [PubMed] [Google Scholar]
- Gordon D., Abajian C., Green P., Abajian C., Green P., Green P. Consed: A graphical tool for sequence finishing. Genome Res. 1998;8:195–202. doi: 10.1101/gr.8.3.195. [DOI] [PubMed] [Google Scholar]
- Gunderson K.L., Steemers F.J., Lee G., Mendoza L.G., Chee M.S., Steemers F.J., Lee G., Mendoza L.G., Chee M.S., Lee G., Mendoza L.G., Chee M.S., Mendoza L.G., Chee M.S., Chee M.S. A genome-wide scalable SNP genotyping assay using microarray technology. Nat. Genet. 2005;37:549–554. doi: 10.1038/ng1547. [DOI] [PubMed] [Google Scholar]
- Hinds D.A., Stuve L.L., Nilsen G.B., Halperin E., Eskin E., Ballinger D.G., Frazer K.A., Cox D.R., Stuve L.L., Nilsen G.B., Halperin E., Eskin E., Ballinger D.G., Frazer K.A., Cox D.R., Nilsen G.B., Halperin E., Eskin E., Ballinger D.G., Frazer K.A., Cox D.R., Halperin E., Eskin E., Ballinger D.G., Frazer K.A., Cox D.R., Eskin E., Ballinger D.G., Frazer K.A., Cox D.R., Ballinger D.G., Frazer K.A., Cox D.R., Frazer K.A., Cox D.R., Cox D.R. Whole-genome patterns of common DNA variation in three human populations. Science. 2005;307:1072–1079. doi: 10.1126/science.1105436. [DOI] [PubMed] [Google Scholar]
- Iafrate A.J., Feuk L., Rivera M.N., Listewnik M.L., Donahoe P.K., Qi Y., Scherer S.W., Lee C., Feuk L., Rivera M.N., Listewnik M.L., Donahoe P.K., Qi Y., Scherer S.W., Lee C., Rivera M.N., Listewnik M.L., Donahoe P.K., Qi Y., Scherer S.W., Lee C., Listewnik M.L., Donahoe P.K., Qi Y., Scherer S.W., Lee C., Donahoe P.K., Qi Y., Scherer S.W., Lee C., Qi Y., Scherer S.W., Lee C., Scherer S.W., Lee C., Lee C. Detection of large-scale variation in the human genome. Nat. Genet. 2004;36:949–951. doi: 10.1038/ng1416. [DOI] [PubMed] [Google Scholar]
- The International HapMap Consortium A haplotype map of the human genome. Nature. 2005;437:1299–1320. doi: 10.1038/nature04226. [DOI] [PMC free article] [PubMed] [Google Scholar]
- Ley T.J., Minx P.J., Walter M.J., Ries R.E., Sun H., McLellan M., DiPersio J.F., Link D.C., Tomasson M.H., Graubert T.A., Minx P.J., Walter M.J., Ries R.E., Sun H., McLellan M., DiPersio J.F., Link D.C., Tomasson M.H., Graubert T.A., Walter M.J., Ries R.E., Sun H., McLellan M., DiPersio J.F., Link D.C., Tomasson M.H., Graubert T.A., Ries R.E., Sun H., McLellan M., DiPersio J.F., Link D.C., Tomasson M.H., Graubert T.A., Sun H., McLellan M., DiPersio J.F., Link D.C., Tomasson M.H., Graubert T.A., McLellan M., DiPersio J.F., Link D.C., Tomasson M.H., Graubert T.A., DiPersio J.F., Link D.C., Tomasson M.H., Graubert T.A., Link D.C., Tomasson M.H., Graubert T.A., Tomasson M.H., Graubert T.A., Graubert T.A., et al. A pilot study of high-throughput, sequence-based mutational profiling of primary human acute myeloid leukemia cell genomes. Proc. Natl. Acad. Sci. 2003;100:14275–14280. doi: 10.1073/pnas.2335924100. [DOI] [PMC free article] [PubMed] [Google Scholar]
- Manaster C., Zheng W., Teuber M., Wachter S., Doring F., Schreiber S., Hampe J., Zheng W., Teuber M., Wachter S., Doring F., Schreiber S., Hampe J., Teuber M., Wachter S., Doring F., Schreiber S., Hampe J., Wachter S., Doring F., Schreiber S., Hampe J., Doring F., Schreiber S., Hampe J., Schreiber S., Hampe J., Hampe J. InSNP: A tool for automated detection and visualization of SNPs and InDels. Hum. Mutat. 2005;26:11–19. doi: 10.1002/humu.20188. [DOI] [PubMed] [Google Scholar]
- Margulies M., Egholm M., Altman W.E., Attiya S., Bader J.S., Bemben L.A., Berka J., Braverman M.S., Chen Y.J., Chen Z., Egholm M., Altman W.E., Attiya S., Bader J.S., Bemben L.A., Berka J., Braverman M.S., Chen Y.J., Chen Z., Altman W.E., Attiya S., Bader J.S., Bemben L.A., Berka J., Braverman M.S., Chen Y.J., Chen Z., Attiya S., Bader J.S., Bemben L.A., Berka J., Braverman M.S., Chen Y.J., Chen Z., Bader J.S., Bemben L.A., Berka J., Braverman M.S., Chen Y.J., Chen Z., Bemben L.A., Berka J., Braverman M.S., Chen Y.J., Chen Z., Berka J., Braverman M.S., Chen Y.J., Chen Z., Braverman M.S., Chen Y.J., Chen Z., Chen Y.J., Chen Z., Chen Z., et al. Genome sequencing in microfabricated high-density picolitre reactors. Nature. 2005;437:376–380. doi: 10.1038/nature03959. [DOI] [PMC free article] [PubMed] [Google Scholar]
- Mills R.E., Luttig C.T., Larkins C.E., Beauchamp A., Tsui C., Pittard W.S., Devine S.E., Luttig C.T., Larkins C.E., Beauchamp A., Tsui C., Pittard W.S., Devine S.E., Larkins C.E., Beauchamp A., Tsui C., Pittard W.S., Devine S.E., Beauchamp A., Tsui C., Pittard W.S., Devine S.E., Tsui C., Pittard W.S., Devine S.E., Pittard W.S., Devine S.E., Devine S.E. An initial map of insertion and deletion (INDEL) variation in the human genome. Genome Res. 2006;16:1182–1190. doi: 10.1101/gr.4565806. [DOI] [PMC free article] [PubMed] [Google Scholar]
- Mullikin J.C., Hunt S.E., Cole C.G., Mortimore B.J., Rice C.M., Burton J., Matthews L.H., Pavitt R., Plumb R.W., Sims S.K., Hunt S.E., Cole C.G., Mortimore B.J., Rice C.M., Burton J., Matthews L.H., Pavitt R., Plumb R.W., Sims S.K., Cole C.G., Mortimore B.J., Rice C.M., Burton J., Matthews L.H., Pavitt R., Plumb R.W., Sims S.K., Mortimore B.J., Rice C.M., Burton J., Matthews L.H., Pavitt R., Plumb R.W., Sims S.K., Rice C.M., Burton J., Matthews L.H., Pavitt R., Plumb R.W., Sims S.K., Burton J., Matthews L.H., Pavitt R., Plumb R.W., Sims S.K., Matthews L.H., Pavitt R., Plumb R.W., Sims S.K., Pavitt R., Plumb R.W., Sims S.K., Plumb R.W., Sims S.K., Sims S.K., et al. An SNP map of human chromosome 22. Nature. 2000;407:516–520. doi: 10.1038/35035089. [DOI] [PubMed] [Google Scholar]
- Nickerson D.A., Tobe V.O., Taylor S.L., Tobe V.O., Taylor S.L., Taylor S.L. PolyPhred: Automating the detection and genotyping of single nucleotide substitutions using fluorescence-based resequencing. Nucleic Acids Res. 1997;25:2745–2751. doi: 10.1093/nar/25.14.2745. [DOI] [PMC free article] [PubMed] [Google Scholar]
- Ostertag E.M., Kazazian H.H., Jr., Kazazian H.H., Jr. Biology of mammalian L1 retrotransposons. Annu. Rev. Genet. 2001;35:501–538. doi: 10.1146/annurev.genet.35.102401.091032. [DOI] [PubMed] [Google Scholar]
- Pao W., Miller V., Zakowski M., Doherty J., Politi K., Sarkaria I., Singh B., Heelan R., Rusch V., Fulton L., Miller V., Zakowski M., Doherty J., Politi K., Sarkaria I., Singh B., Heelan R., Rusch V., Fulton L., Zakowski M., Doherty J., Politi K., Sarkaria I., Singh B., Heelan R., Rusch V., Fulton L., Doherty J., Politi K., Sarkaria I., Singh B., Heelan R., Rusch V., Fulton L., Politi K., Sarkaria I., Singh B., Heelan R., Rusch V., Fulton L., Sarkaria I., Singh B., Heelan R., Rusch V., Fulton L., Singh B., Heelan R., Rusch V., Fulton L., Heelan R., Rusch V., Fulton L., Rusch V., Fulton L., Fulton L., et al. EGF receptor gene mutations are common in lung cancers from “never smokers” and are associated with sensitivity of tumors to gefitinib and erlotinib. Proc. Natl. Acad. Sci. 2004;101:13306–13311. doi: 10.1073/pnas.0405220101. [DOI] [PMC free article] [PubMed] [Google Scholar]
- Stephens M., Sloan J.S., Robertson P.D., Scheet P., Nickerson D.A., Sloan J.S., Robertson P.D., Scheet P., Nickerson D.A., Robertson P.D., Scheet P., Nickerson D.A., Scheet P., Nickerson D.A., Nickerson D.A. Automating sequence-based detection and genotyping of SNPs from diploid samples. Nat. Genet. 2006;38:375–381. doi: 10.1038/ng1746. [DOI] [PubMed] [Google Scholar]
- Strausberg R.L., Simpson A.J., Wooster R., Simpson A.J., Wooster R., Wooster R. Sequence-based cancer genomics: Progress, lessons and opportunities. Nat. Rev. Genet. 2003;4:409–418. doi: 10.1038/nrg1085. [DOI] [PubMed] [Google Scholar]
- Thiede C., Koch S., Creutzig E., Steudel C., Illmer T., Schaich M., Ehninger G., Koch S., Creutzig E., Steudel C., Illmer T., Schaich M., Ehninger G., Creutzig E., Steudel C., Illmer T., Schaich M., Ehninger G., Steudel C., Illmer T., Schaich M., Ehninger G., Illmer T., Schaich M., Ehninger G., Schaich M., Ehninger G., Ehninger G. Prevalence and prognostic impact of NPM1 mutations in 1485 adult patients with acute myeloid leukemia (AML) Blood. 2006;107:4011–4020. doi: 10.1182/blood-2005-08-3167. [DOI] [PubMed] [Google Scholar]
- Tuzun E., Sharp A.J., Bailey J.A., Kaul R., Morrison V.A., Pertz L.M., Haugen E., Hayden H., Albertson D., Pinkel D., Sharp A.J., Bailey J.A., Kaul R., Morrison V.A., Pertz L.M., Haugen E., Hayden H., Albertson D., Pinkel D., Bailey J.A., Kaul R., Morrison V.A., Pertz L.M., Haugen E., Hayden H., Albertson D., Pinkel D., Kaul R., Morrison V.A., Pertz L.M., Haugen E., Hayden H., Albertson D., Pinkel D., Morrison V.A., Pertz L.M., Haugen E., Hayden H., Albertson D., Pinkel D., Pertz L.M., Haugen E., Hayden H., Albertson D., Pinkel D., Haugen E., Hayden H., Albertson D., Pinkel D., Hayden H., Albertson D., Pinkel D., Albertson D., Pinkel D., Pinkel D., et al. Fine-scale structural variation of the human genome. Nat. Genet. 2005;37:727–732. doi: 10.1038/ng1562. [DOI] [PubMed] [Google Scholar]
- Verhaak R.G., Goudswaard C.S., van Putten W., Bijl M.A., Sanders M.A., Hugens W., Uitterlinden A.G., Erpelinck C.A., Delwel R., Lowenberg B., Goudswaard C.S., van Putten W., Bijl M.A., Sanders M.A., Hugens W., Uitterlinden A.G., Erpelinck C.A., Delwel R., Lowenberg B., van Putten W., Bijl M.A., Sanders M.A., Hugens W., Uitterlinden A.G., Erpelinck C.A., Delwel R., Lowenberg B., Bijl M.A., Sanders M.A., Hugens W., Uitterlinden A.G., Erpelinck C.A., Delwel R., Lowenberg B., Sanders M.A., Hugens W., Uitterlinden A.G., Erpelinck C.A., Delwel R., Lowenberg B., Hugens W., Uitterlinden A.G., Erpelinck C.A., Delwel R., Lowenberg B., Uitterlinden A.G., Erpelinck C.A., Delwel R., Lowenberg B., Erpelinck C.A., Delwel R., Lowenberg B., Delwel R., Lowenberg B., Lowenberg B., et al. Mutations in nucleophosmin (NPM1) in acute myeloid leukemia (AML): Association with other gene abnormalities and previously established gene expression signatures and their favorable prognostic significance. Blood. 2005;106:3747–3754. doi: 10.1182/blood-2005-05-2168. [DOI] [PubMed] [Google Scholar]
- Weckx S., Del-Favero J., Rademakers R., Claes L., Cruts M., De Jonghe P., Van Broeckhoven C., De Rijk P., Del-Favero J., Rademakers R., Claes L., Cruts M., De Jonghe P., Van Broeckhoven C., De Rijk P., Rademakers R., Claes L., Cruts M., De Jonghe P., Van Broeckhoven C., De Rijk P., Claes L., Cruts M., De Jonghe P., Van Broeckhoven C., De Rijk P., Cruts M., De Jonghe P., Van Broeckhoven C., De Rijk P., De Jonghe P., Van Broeckhoven C., De Rijk P., Van Broeckhoven C., De Rijk P., De Rijk P. novoSNP, a novel computational tool for sequence variation discovery. Genome Res. 2005;15:436–442. doi: 10.1101/gr.2754005. [DOI] [PMC free article] [PubMed] [Google Scholar]
- Zhang J., Wheeler D.A., Yakub I., Wei S., Sood R., Rowe W., Liu P.P., Gibbs R.A., Buetow K.H., Wheeler D.A., Yakub I., Wei S., Sood R., Rowe W., Liu P.P., Gibbs R.A., Buetow K.H., Yakub I., Wei S., Sood R., Rowe W., Liu P.P., Gibbs R.A., Buetow K.H., Wei S., Sood R., Rowe W., Liu P.P., Gibbs R.A., Buetow K.H., Sood R., Rowe W., Liu P.P., Gibbs R.A., Buetow K.H., Rowe W., Liu P.P., Gibbs R.A., Buetow K.H., Liu P.P., Gibbs R.A., Buetow K.H., Gibbs R.A., Buetow K.H., Buetow K.H. SNPdetector: A software tool for sensitive and accurate SNP detection. PLoS Comput. Biol. 2005;1:e53. doi: 10.1371/journal.pcbi.0010053. [DOI] [PMC free article] [PubMed] [Google Scholar]