Abstract
The need for an accurate, practical, low-cost 3D dosimetry system is becoming ever more critical as modern dose delivery techniques increase in complexity and sophistication. A recent report from the Radiological Physics Center (RPC) (1), revealed that 38% of institutions failed the head-and-neck IMRT phantom credentialing test at the first attempt. This was despite generous passing criteria (within 7% dose-difference or 4mm distance-to-agreement) evaluated at a half-dozen points and a single axial plane. The question that arises from this disturbing finding is – what percentage of institutions would have failed if a comprehensive 3D measurement had been feasible, rather than measurements restricted to the central film-plane and TLD points? This question can only be adequately answered by a comprehensive 3D-dosimetry system, which presents a compelling argument for its development as a clinically viable low cost dosimetry solution. Optical-CT dosimetry is perhaps the closest system to providing such a comprehensive solution. In this article, we review the origins and recent developments of optical-CT dosimetry systems. The principle focus is on first generation systems known to have highest accuracy but longer scan times.
1. Introduction
1.1. Origins: Optical-CT polymer-gel dosimetry
In 1996 Gore et al [2] introduced a new method of 3D dosimetry using optical-computed-tomography, or optical-CT, to scan tissue equivalent polymer-gel-dosimeters that exhibited radiation-induced polymerization when exposed to high energy ionizing radiation (figure 1). A dose response amenable to optical measurement was reported, arising from the production of light scattering micro-particles from radiation induced polymerization of acrylic monomers dispersed in the gel. Unirradiated gel was virtually transparent, but irradiated gel became increasingly opaque with dose as the number density of scattering micro-particles increased (figure 2).
Figure 1.
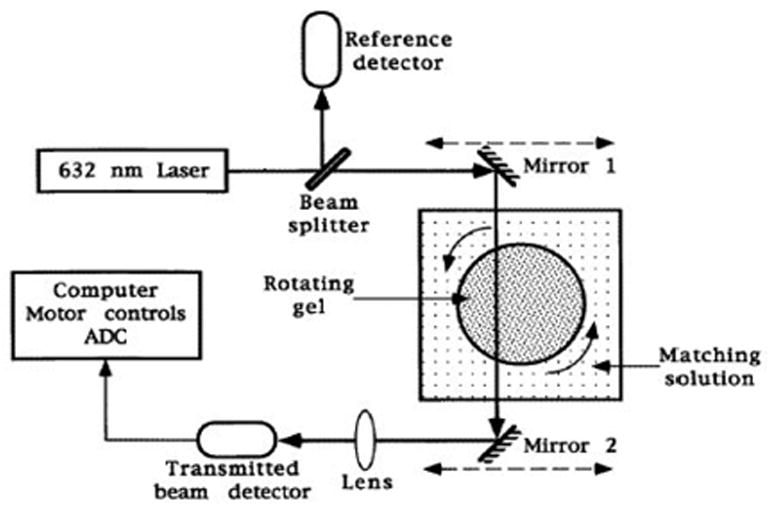
A schematic diagram of a prototype optical-CT scanner. The mirrors translate left to right to obtain projections of the optical attenuation through the gel as described in the text. (From [2]).
Figure 2.
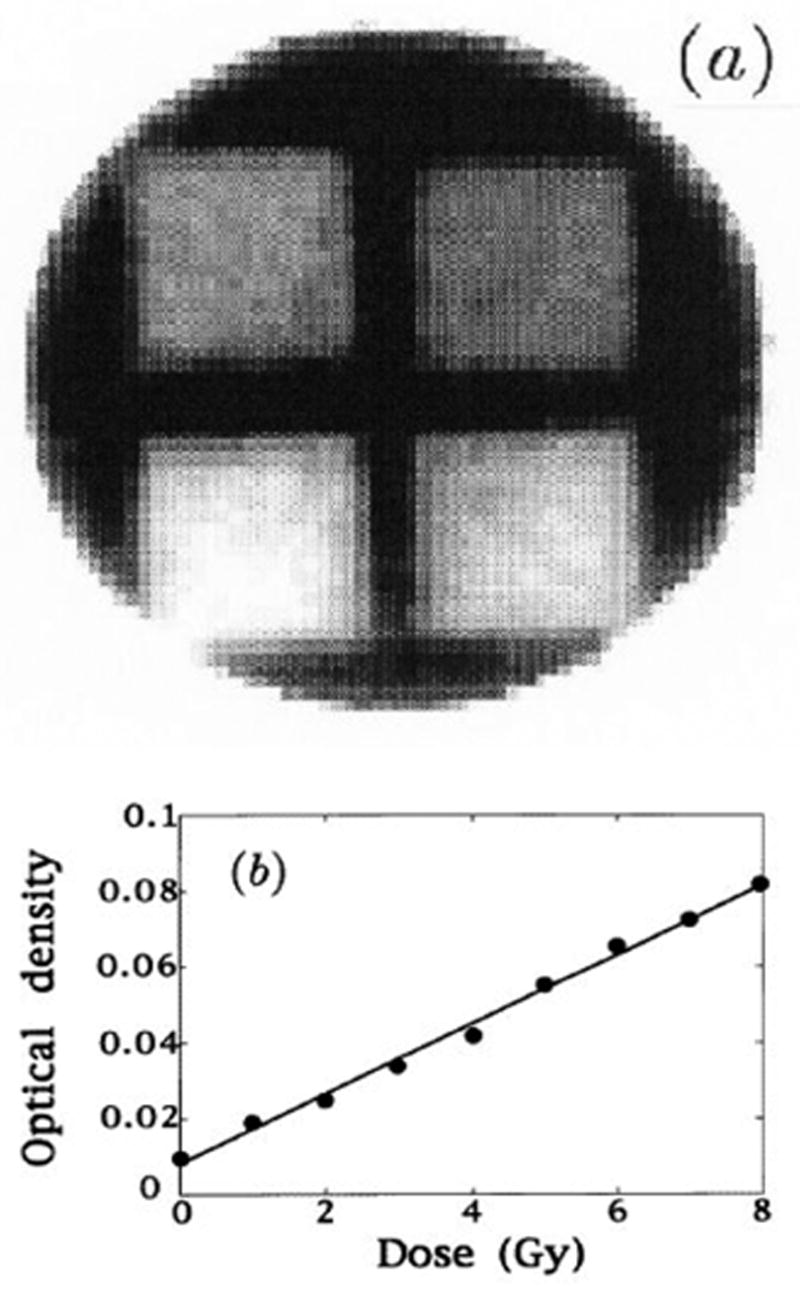
Optically scanned 2D dose distribution of irradiated polymer gels (a) the calculated dose map of a cylindrical sample of radius 10cm in which four rectangular fields of different doses were placed; (b) the relationship of optical attenuation to dose. (From [2]).
The partial transparency of the gel lended itself to optical scanning by optical-CT, a technique analogous to first generation x-ray CT, except that a visible light source is used instead of an x-ray source.
In Figure 1 the radiation sensitive polymer gel is enclosed in a cylindrical transparent flask immersed in an optically matched water bath to minimize refraction effects at the surface of the flask. The 632nm HeNe laser beam is stepped across the flask by means of synchronous moving mirrors to acquire the transmission data for each projection. At each step of the projection the intensity of transmitted laser light was measured by a photodiode detector. The flask was rotated by a small amount between each projection such that projections were acquired for full 360 degree views around the flask. Image data for different slices could in principle be obtained by advancing the flask vertically and re-acquiring a full projection set. 2D maps of optical attenuation coefficients are then obtained using standard CT reconstruction algorithms (e.g. filtered backprojection) as illustrated in figure 2. 3D dosimetry can then be achieved by creating an image stack from scanning multiple slices. An accuracy of within 5% was claimed for doses in the range 0–10Gy, with a spatial resolution of better than 2mm. The minimum detectable dose was estimated as 10cGy with 5cGy std dev. These bold claims and the impressive preliminary images and dose response in figures 1 and 2, inspired considerable interest from radiation dosimetry workers. The papers did not address in detail many aspects of scanner performance (e.g. geometrical distortion, imaging artifacts, and the effect of scatter on measured distributions), and there was no quantitative comparison of optical-CT measured doses with independent dosimeters (e.g. film).
In a companion paper, Maryanski et al [3] presented investigations into the optical properties of BANG polymer gels. Several important observations were made. First the absence of absorption bands in turbidity spectra of gel irradiated to different doses was interpreted as indicating the gel is a predominantly light-scattering medium, with negligible light-absorption. Second, measurement of the refractive index of samples of gel irradiated to different doses revealed a correlation of increasing refractive index with increasing dose. Both these effects, light-scatter and light-refraction, represent potential sources of error and artifacts in optical-CT dosimetry, and were flagged as warranting in-depth study (see below). The authors were also able to estimate the maximum particle sizes of the polymer micro-particles in gels irradiated to different doses. The method involved taking the difference in turbidity spectra for gel samples irradiated to different doses and fitting the resulting difference curves using Mie theory for monodispersive spherical scattering particles. Maximum micro-particle sizes in the range 440–680nm were reported.
1.1.1. Optical-CT or MRI scanning?
The Gore and Maryanski papers stimulated interest in the potential and feasibility of high resolution 3D dosimetry by optical-CT scanning of polymer gels. Prior to these works MR imaging of polymer gels was the only available method for imaging the dose distribution recorded in polymer gels [4,5]. A fundamental question arose as to what were the relative merits of these two imaging methods. Oldham et al [6] investigated this question by applying both imaging methods to the same polymer gel samples that had been irradiated by spatially separated radiosurgery beams to various doses. Optical-CT was performed with an in house scanner. Figure 3 shows comparison dose maps of the same slice through the same gel dosimeter obtained by MRI and optical-CT imaging. To attempt a meaningful comparison a requirement was that both imaging techniques should meet as closely as possible an RTAP criteria (Resolution, Time, Accuracy, and Precision). In practice this meant dose maps should be produced with 1 x 1 mm2 spatial resolution within 1 hour of imaging time (standard MR time slot) and with accuracy within 3% and noise within 1%. A caveat to this work is that while the in-plane resolution is high for optical-CT, the slice-spacing was necessarily course to bring the scanning time close to the RTAP limit. As the acquisition of each slice takes typically ~5 minutes, only 12 slices were feasible yielding a slice spacing of ~0.75 mm for this dosimeter, with the prototype optical-CT system used.
Figure 3.
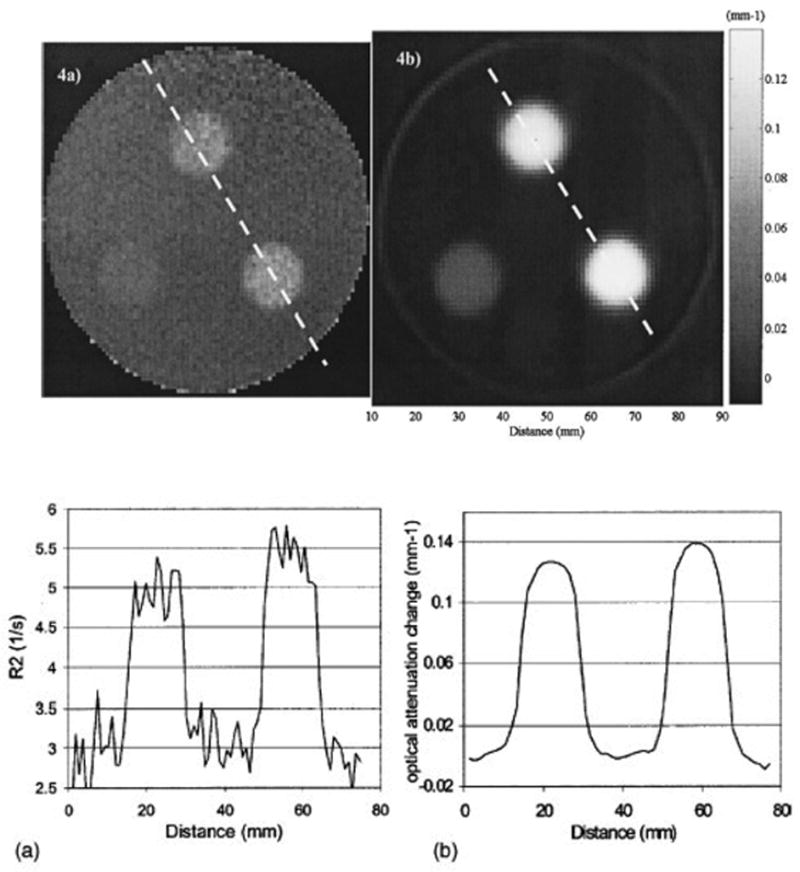
Axial images through the same plane of the same cylindrical polymer gel-dosimeter irradiated with 3 circular radiosurgery beams. (a) MRI image of the R2 distribution, (b) optical-CT image of the districution of optical attenuation coefficients. The corresponding profiles along the dashed lines are shown in (c) and (d) respectively. (From [6]).
Figure 3 illustrates the primary advantages of the optical-CT technique in that high spatial resolution and low noise can be achieved because of the exquisite sensitivity of photodiode light detection technology. Optical-CT can provide a low cost and attractive alternative to MRI scanning of polymer gels for many applications. It is noted that MRI gel-dosimetry retains unique abilities in that it can image both arbitrary shaped gel-phantoms and phantoms containing opaque features. Irregular phantoms may cause significant optical artifacts through reflection, refractions and absorbance.
1.1.2. The problem of light-scattering
The source of radiation induced optical contrast in polymer-gel dosimeters is light-scattering, and the challenge of performing accurate optical-CT dosimetry in the presence of scatter was immediately acknowledged [2]. The presence of scattered radiation is also a well known problem in x-ray-CT [7], where it is traditionally reduced by narrowing the x-ray beam to a thin fan, and incorporating sophisticated corrections in the reconstruction [8]. Scatter related artifacts are more severe than beam-hardening artifacts, and include cupping, streaking and inaccurate reconstructed attenuation coefficients [7]. Very little is known however of the specifics of how scattered light might perturb 3D dose maps obtained from optical-CT. Xu et al [9] and Islam et al [10] both noted a cross shaped artifact that appeared in optical-CT images of a high-dose square field irradiations (figure 4). The cross shaped depression of reconstructed attenuation values was observed at higher optical-density values of the gel. The magnitude of these scatter artifacts can be reduced by reducing the number-density of scattering sources, which translates to reducing the dose delivered to the gel. An uncomfortable trade-off thus occurs for any optical-CT dosimeter where scattering is the primary source of contrast, as decreasing the dose also decreases the contrast and signal needed for accurate dosimetry.
Figure 4.
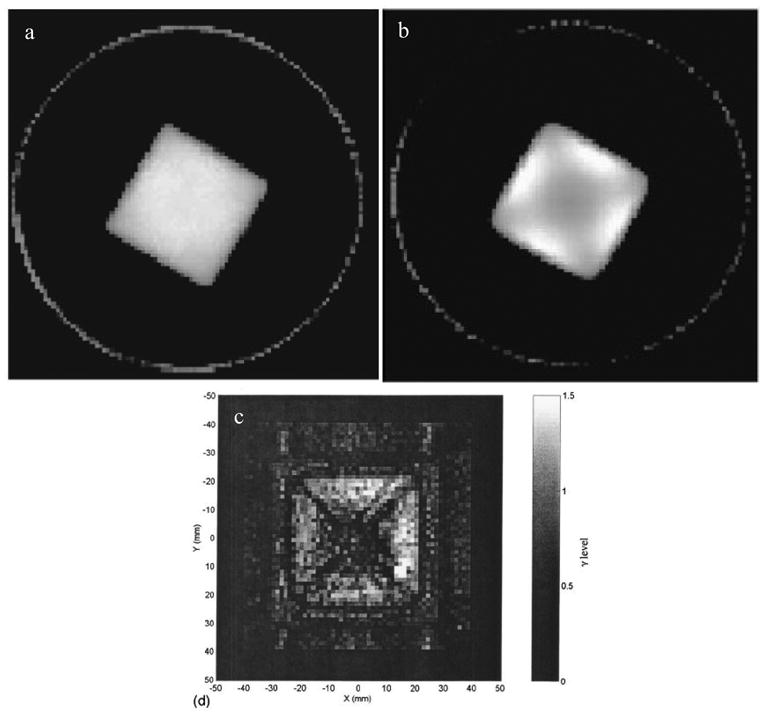
a, b reconstructed optical-CT images from Xu et al [9] for 6 x 6 cm2 square field irradiation. The cross artifact is not readily apparent at low doses (a) but is clearly present at higher doses (b). (c) the same artifact was observed in this gamma map plot from Islam et al. [10], comparing optical-CT with Gafchromic film measurement for a similar irradiation.
The cross artifact in a square field has the hallmark of a scatter artifact, and this was proved using optical-CT Monte Carlo simulations in Oldham et al [11]. The simulations were performed both with and without light-scattering modeled as standard Mie scattering with monodispersive particles of radius 475 nm (see [3,12] for further details). Selected results are shown in figure 5, and illustrate that when optical-contrast is by absorbtion only (figure 5b) the cross-shaped artifact is not observed. However, when Mie light scattering was activated (figure 5c) a cupping artifact appeared which was more pronounced on the diagonals consistent with the cross artifact reported in figure 4.
Figure 5.
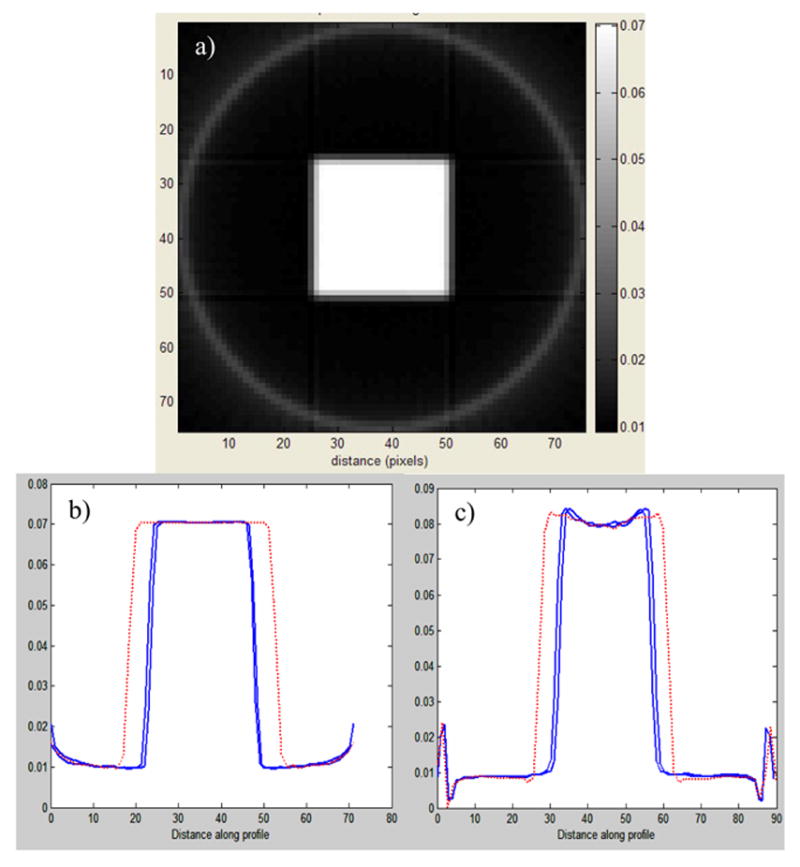
a) optical-CT Monte Carlo simulation of the square field irradiation of the polymer gel of fig 4. b and c are profiles along the lines indicated in a) for simulations where light-scattering was switched off (b) and switched on (c). (Adapted from [11])
Scatter artifacts have also been shown to systematically influence the magnitude of reconstructed attenuation coefficients. Oldham et al [13] obtained optical-CT images of a series of identical BANG gel samples uniformly irradiated to different doses. Each sample was imaged multiple times under conditions of varying scatter-rejection achieved by varying the diameter of a scatter-rejecting collimator positioned close to the photodiode detector. A plot of reconstructed attenuation coefficients determined with the collimator fully open to 2 cm diameter and closed to 3mm revealed a consistent 13% difference (figure 6). This study illustrates how scatter can cause significant global depression (>10%) on reconstructed attenuation coefficients in uniform samples.
Figure 6.
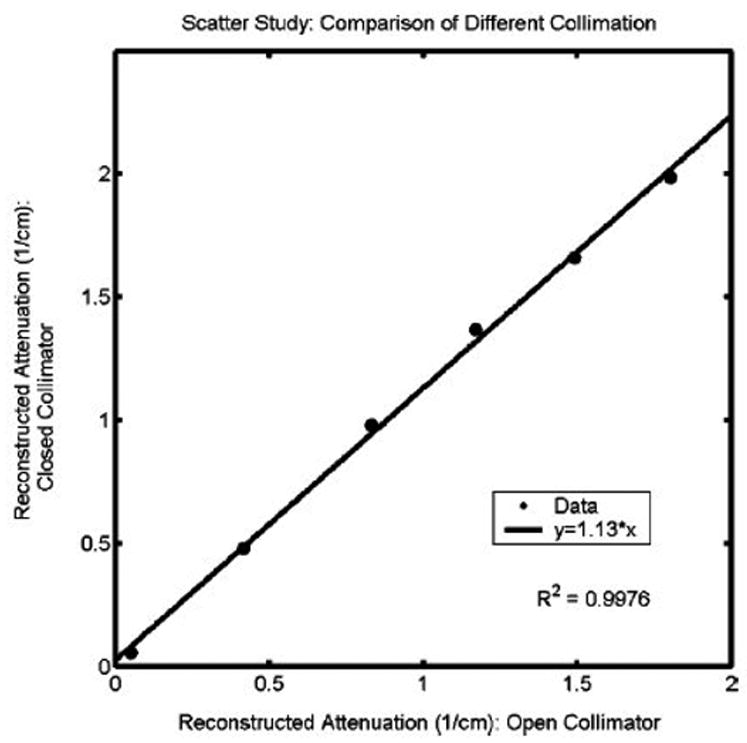
Influence of scatter on reconstructed attenuation coefficients of test tubes of BANG3 gel. The plot shows optical-CT reconstructed attenuation coefficients acquired with the scatter-rejection collimator fully open (20 mm diameter), and with the collimator closed to 3 mm diameter. Error is on the order of the data marker size. From Oldham et al [12].
The influence of scatter has been demonstrated in several scenarios above, where known simple geometries were created. The major challenge for polymer optical-CT dosimetry is to determine the effect of scatter on the reconstructed dose in non-uniformly irradiated gel samples. Such effects are very difficult to correct without knowing the geometry apriori. This difficulty is highlighted in figure 7.
Figure 7.
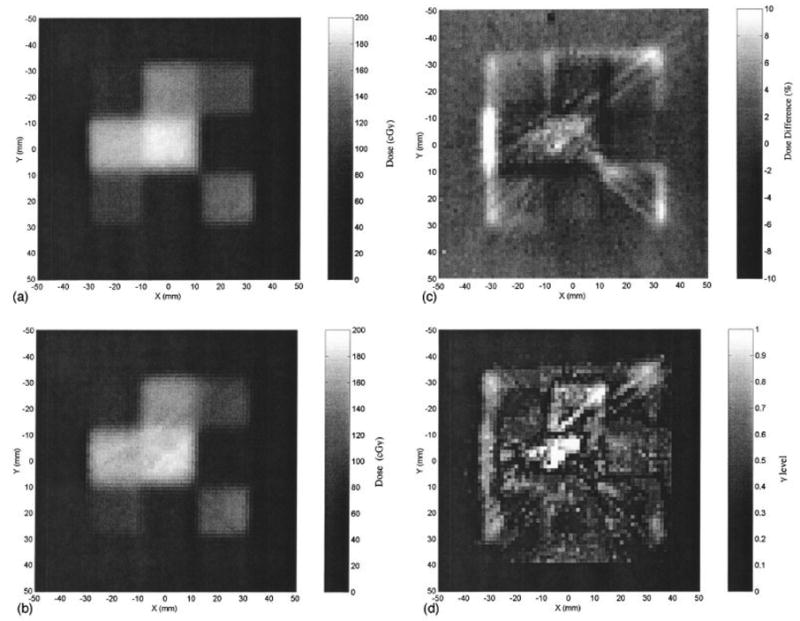
A radiochromic measurement of a simple IMRT field (a) is compared against an optical-CT image of the same plane (b). The percent dose difference between radiochromic film and gel measured dose-maps is shown in (c), the corresponding gamma maps (1.5mm and 5% dose criteria) in (d). Significant streak and cupping artifacts are visible in the optical images. From Islam et al [10].
Despite the obvious issues surrounding optical-CT polymer gel dosimetry, several groups have reported some success with 3D dosimetry verifications [14–16].
2. Optical-CT of non-scattering gels
A 3D dosimetry material that exhibits optical-contrast through light-absorbance rather than light-scattering would have a clear advantage as it would negate the scattering artifacts illustrated above. The first optical-CT dosimetry of a non-scattering gel was proposed by Kelly et al [17]. An FBX gel (a gelatin based gel doped with Ferrous–Benzoic-Xylenol) exhibited a radiochromic color change which was scanned with a first generation in-house optical-CT scanner. Promising performance (figure 8) was reported with the single limitation that the radiochromic distribution gradually diffused through the gel placing strict restrictions on the time available for imaging.
Figure 8.
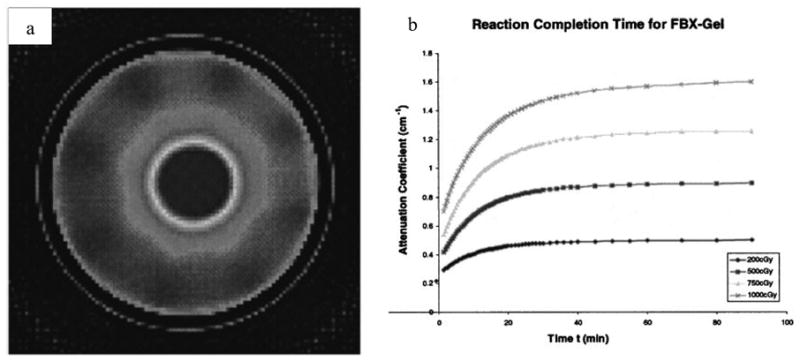
(a) optical-CT scan of an FBX gel irradiated with a radiosurgery treatment. (b) plot of the reaction time of the radiochromic FBX response. The FBX dosimeter can only be imaged after ~90 minutes, and at that time there is a concern over image degradation due to diffusion. (Adapted from Kelly et al [17]).
Since the introduction of the non-scattering FBX gel-dosimeter, other absorbing gels have been reported [18], but none has so far fully solved the issue of radiochromic diffusion. The radiochromic diffusion problem has been solved however with the introduction of the PRESAGE™ dosimeter [19–21]. PRESAGE™ is not a gel-dosimeter, but a polyurethane material doped with leuco dyes which undergo a peak radiochromic response at 630 nm. A number of potential advantages accrue over other 3D dosimeters including in-sensitivity to oxygen and diffusion; radiation induced light absorption rather than scattering, and a solid texture amenable to machining to a variety of shapes and sizes without the requirement of an external container. Detailed analysis of the radiochromic response of PRESAGE has confirmed exceptional potential for 3D dosimetry [21,22]. PRESAGE™ formulations have been created with great variety of sensitivity, temporal stability, and CT number. Recent results from careful cross validation of PRESAGE dosimetry on large 17 cm diameter samples is shown in figure 9.
Figure 9.
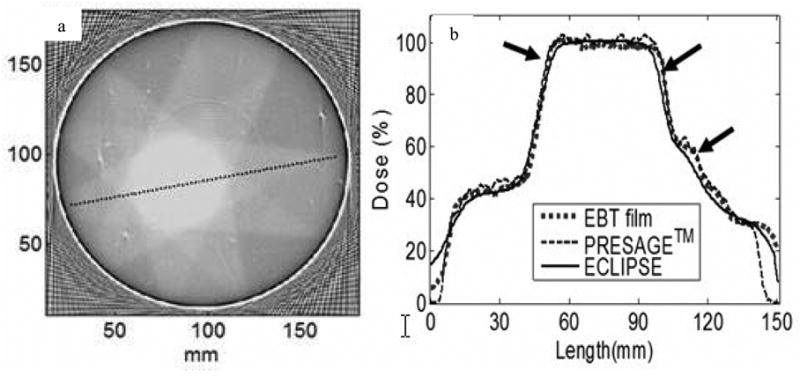
(a) Optical-CT scan of a 17 cm diameter PRESAGE™ dosimeter 24h after irradiation with a simple 9 field conformal plan. (b) profile comparison showing excellent agreement of the PRESAGE distribution with corresponding EBT and planning system distributions. From Guo et al [22].
It is interesting to compare the size of the wall artifact in figures 8 and 9. A substantially smaller artifact is observed in the PRESAGE™ dosimeter due to the lack of an external container. Gel-dosimeters (like the FBX figure 8) require an external container, and hence the refraction matching at the wall is complicated by the dual interior-exterior interface. PRESAGE in contrast, has just the one interface, leading to more effective index matching at the periphery and accurate reading close to the walls of the vessel.
3. Characterizing Optical-CT performance
Several groups have reported investigations to characterize and investigate the accuracy and limitations of the technique of optical-CT (12,13,17,23), and yet this effort is not nearly enough. For optical-CT dosimetry to reach its full potential, in-depth and independent characterization and optimization of the performance of optical-CT scanning system and the optical properties of the dosimeters is required. A treatise on the properties of dosimeters is outside the scope of this review, but key characteristics of optical-CT scanning technique will be discussed below.
3.1. Geometrical distortion
Experiments to characterize the performance of an in-house optical-CT scanner were recently reported (12,13). A series of phantoms were designed to generate known baseline conditions that could be used to verify the performance of the scanner. ‘Needle phantoms’ were developed to investigate potential geometrical distortion. A needle phantom consists of a gelatin gel in an optically transparent flask rigidly supporting a geometrical pattern of optically opaque steel needles. True needle positions were determined by x-ray CT scanning. Distortion in optical-CT images was then determined by registration and superposition of the x-ray CT and optical-CT images. Negligible distortion of needle positions was observed, for first generation optical-CT systems, when the water-bath was well matched to the refractive index of the gel. When the water bath was poorly matched, a radial compression distortion (figure 10) was observed the magnitude of which was linear with increasing refractive index of the water bath.
Figure 10.
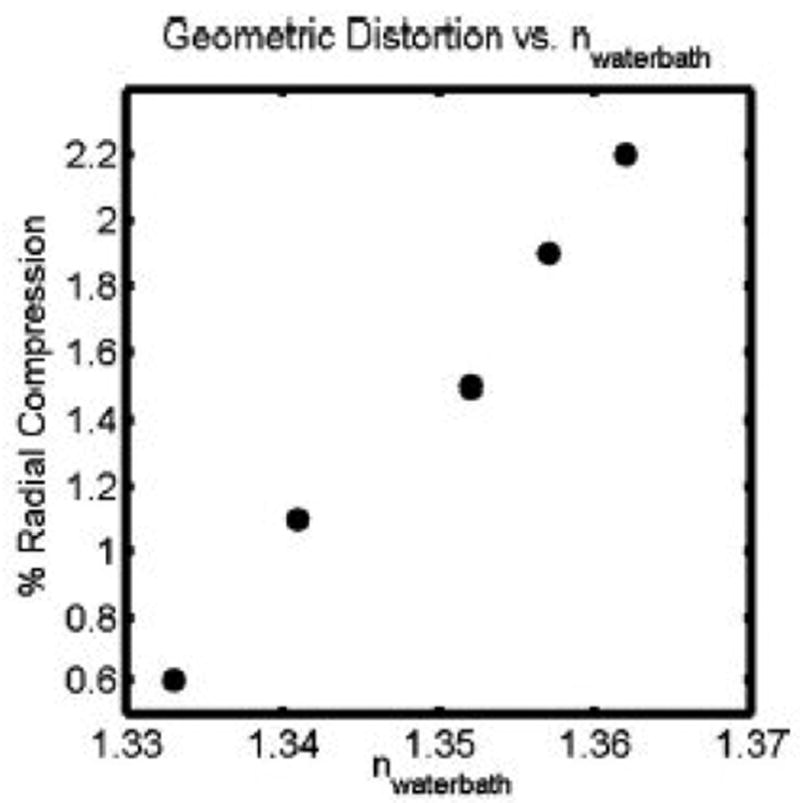
This figure shows the radial distortion that occurs in optical-CT of polymer gels, as the refractive index of the matching fluid in the water-bath is varied. The radial distortion was found to be linear with radial distance for any particular refractive index. This plot therefore shows the radial compression as a fixed percentage for each refractive index value of the fluid in the water-bath. Adapted from [13].
In addition to x-rayCT/optical-CT comparisons, polymer-gel radiation sensitive needle phantoms were constructed and imaged by optical-CT both pre and post irradiation. A comparison of needle positions in the pre and post images then enabled a determination of distortion associated with radiation induced refractive and scattering changes in the gel. Two extreme irradiation geometries were investigated in an attempt to determine worst case radiation induced geometrical distortion (figure 11). The overlay pre and post-irradiation optical-CT images in figure 11 illustrates good matching of the pre and post irradiation needle positions. The agreement within .3 mm demonstrates negligible distortion within this phantom of 5.5 cm diameter and doses of ~4 Gy when optical-CT scanning is performed with a 1st generation scanning laser system. Should this phantom be scanned with an area system, more significant distortion is entirely possible.
Figure 11.
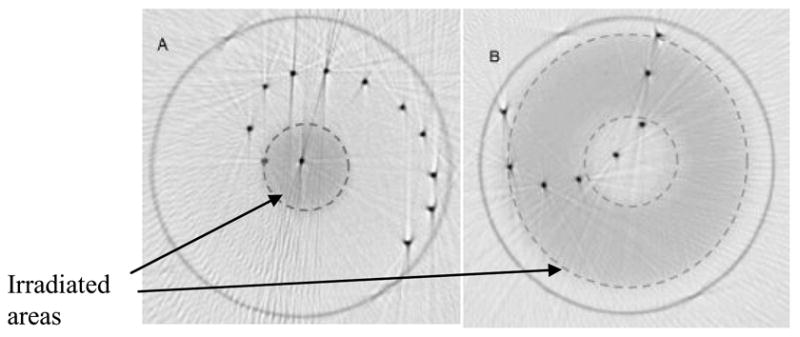
Superposition of pre and post-irradiation optical-CT images of two polymer gel needle phantoms. (A) a high dose was delivered by a circular 1.5 cm diameter field of 6MV photons axially through the flask. (B) a rind of dose was delivered by a 5 cm circular field with a 2 cm central lead block. Irradiated regions appear lightly attenuating because the image is windowed to show needle positions. In reality the irradiated gel was highly attenuating. Irradiated regions are highlighted with dashed line. Adapted from [13].
3.2. Accuracy of reconstruction and dependence on scanning parameters
Kelly et al [17] examined the accuracy of optical-CT in the absence of scatter, and found excellent agreement with independent measurement (figure 12). The accuracy of optical-CT reconstruction, and the influence of varying reconstruction parameters were investigated using finger phantoms in [12]. Finger phantoms contain gel ‘finger’ regions of known attenuation or scattering power within an otherwise transparent gel. The finger phantoms were optically-CT scanned and comparisons were then made between the reconstructed and known parameters of the fingers. Comparison of optical attenuation measured by the optical-CT scanner and a spectrophotometer showed good linearity and absolute agreement to within 3–4%. A wide range of reconstruction and imaging parameters were also evaluated with respect to their effect on image quality, including optical laser step size, number of projections, projection angular increment, and number of ADC readings to average. A nominal set of operating conditions was identified consisting of laser-step-size = 1 mm, 120 projections at 1.5 degree intervals, and each point on a projection was the average of 50 ADC readings.
Figure 12.
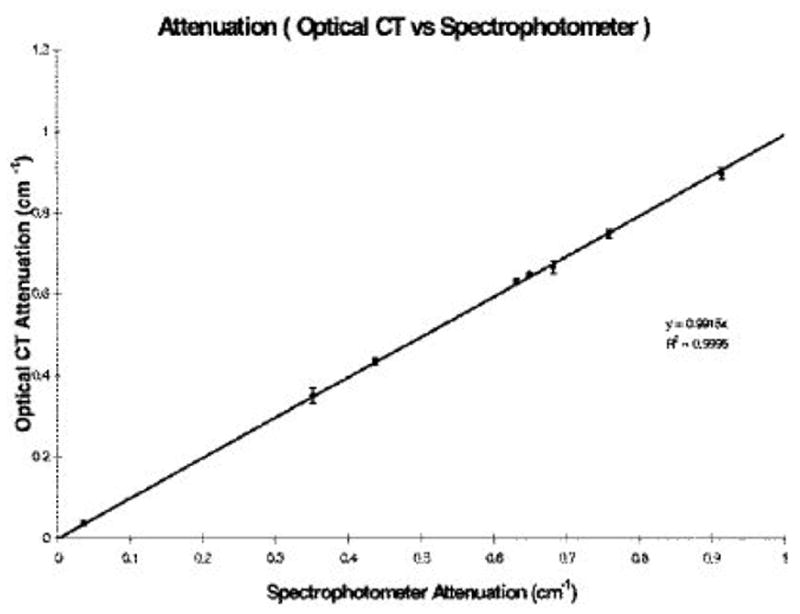
Optical-CT reconstructed attenuation coefficients for absorbing solutions (i.e. no light scatter) were found to have excellent agreement (within 1%) to independent measurement with a spectro-photometer. This figure illustrates the inherent potential for accurate optical-CT for light absorbing dosimeters. (From Kelly et al [17]).
3.3. Artifacts due to reflection and refraction
Two of the most significant sources of artifacts in optical-CT imaging arise from reflection and refraction of light at the walls of the dosimeter. Early attempts to minimize these effects were suggested by Gore et al, which involved limiting the range of projection data to exclude regions close to the edges of the flask. This method can give useful results if the radiation does not extend beyond about 90% of the diameter of the flask. For many radiation deliveries this is not the case as beams impinge on the flask in an axial manner. Several correction techniques to minimize refractive wall artifacts have since been proposed [13,17,24]. One method involves forming subtraction images of post and pre-irradiation optical-CT images of the same gel phantom, to subtract out common artifacts (e.g. wall artifacts, and any bubble or spec artifacts). As many of the same refraction and reflection artifacts are present in both scans, the difference image reveals maps of the changes in optical attenuation that were induced by the radiation. This method can also yield useful results but is limited in the amount of information that can be retrieved close to the walls of the flask. In depth discussions of these artifacts is discussed in Kelly et al [17] and Oldham et al [13]. An illustration of how corrections can be applied, and there relative impact is given in figure 13.
Figure 13.
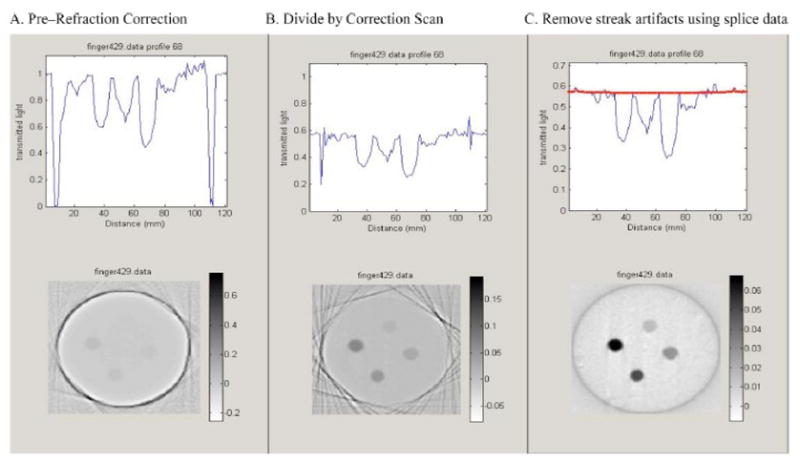
Upper figures illustrate an arbitrary projection, at different stages of correction, and the lower figures are the corresponding reconstructed slice. (A) uncorrected data, (B) after division by the ‘pre-scan’ projection data acquired before irradiation, and (C) final result after further correction for edge artifacts caused by small positional errors between pre and post projections.
4. Commercial Optical-CT scanners
The field of 3D gel dosimetry by optical-CT has recently become more accessible through the introduction of the first commercially available OCTOPUS™ optical-CT scanning system from MGS Research Inc. The scanner is an extension of the design illustrated in figure 1, and is capable of high-resolution 3D dosimetry of flasks of up to 20 cm diameter and 15 cm in height. Two recent publications describe initial experiences commissioning and using the scanning system in combination with BANG polymer gels. Islam et al [10] reported good agreement for simple field arrangements, including a single field IMRT delivery, between BANG™ gel and radiochromic film. Xu et al [14] also reported good agreement between 3D gel measured IMRT distribution and film for isodose lines greater than 30%. Discrepancies were noted at lower isodose lines, close to the walls of the flask where a degree of oxygen contamination may have occurred through the walls of the flask. More recent work has used the OCTOPUS™ scanner in combination with the PRESAGE dosimeter, and cross-correlation with EBT [22]. Results are shown here in figure 9. A recent development is the emergence of an area based optical-CT system from Modus Medical Devices Inc. [25].
5. Improving accuracy in optical-CT dosimetry
Several simple procedures can significantly improve the quality of 3D dosimetry. Significant noise can arise from several sources, including laser output drift [13] interference or low quality walls of the water bath [13], and light-scattering impurities in the matching fluid [3]. Techniques have been developed to address most of these issues (see section 2 and references [2,11–13,17]). Xu et al [9] demonstrated the importance of matching the sensitivity of the dosimeter and the delivered dose to yield optical-density changes in the dosimeter that match the dynamic range of the scanner. This simple technique can increase the signal to noise in the projections and hence in the final reconstructed image.
6. Conclusions
There is a growing body of work characterizing first generation optical-CT scanning systems and compatible 3D dosimeters. The performance of these systems are generally promising with high resolution, high sensitivity and low noise being particularly attractive features of optical-CT. The first generation scanning systems (single stepped laser-photodiode configurations) have been shown to be insensitive to geometrical distortion although refractive and scattering effects have been observed. The presence of scattered light has been shown to introduce artifacts in polymer gel dosimeters where the optical-contrast is achieved through light scattering. These artifacts can be reduced by limiting the dose to the gel, however an uncomfortable trade-off occurs as the signal of interest is also reduced. The problem of light scatter remains a significant challenge for optical-CT polymer gel dosimetry. The magnitude of artifacts in irregular clinical distributions is not well understood, and it remains to be seen what accuracy can be achieved. The recent emergence of stable, radiochromic, non-scattering 3D dosimeters represents a step-forward for the potential for accurate and convenient clinical 3D dosimetry. These new dosimeters are not gels but plastic, and this highlights the fact that the term ‘gel-dosimetry’ is no longer adequate for common association with the full range of 3D dosimetry techniques. The term originated from the early 3D dosimeters which were agarose or gelatin based, creating a water dominated hydro-gel (requiring an external container) with a firm texture which can easily be penetrated with a sharp object. It is suggested that the term ‘3D dosimetry’ should now be used to encompass both these and future advances.
Acknowledgments
This work is supported by NIH grant R01 CA100835-01.
References
- 1.Molineu A, Hernandez N, Alvarez P, Followill D, Ibbott G. IMRT head and neck phantom irradiations: Correlation of results with institution size. Med Phys. 2005;32:1983–1984. [Google Scholar]
- 2.Gore JC, Ranade M, Maryanski MJ, Schulz RJ. Radiation dose distributions in three dimensions from tomographic optical density scanning of polymer gels: I. Development of an optical scanner. Phys Med Biol. 1996;41:2695–2704. doi: 10.1088/0031-9155/41/12/009. [DOI] [PubMed] [Google Scholar]
- 3.Maryanski MJ, Zastavker YZ, Gore JC. Radiation dose distributions in three dimensions from tomographic optical density scanning of polymer gels: II. Optical properties of the BANG polymer gel. Phys Med Biol. 1996;41:2705–2717. doi: 10.1088/0031-9155/41/12/010. [DOI] [PubMed] [Google Scholar]
- 4.Maryanski MJ, Gore JC, Kennan RP, Schulz RJ. NMR relaxation enhancement in gels polymerized and cross-linked by ionizing radiation: a new approach to 3D dosimetry by MRI. Magn Reson Imaging. 1993;11:253–258. doi: 10.1016/0730-725x(93)90030-h. [DOI] [PubMed] [Google Scholar]
- 5.Maryanski MJ, Schulz RJ, Ibbott GS, Gatenby JC, Xie J, Horton D, Gore JC. Magnetic resonance imaging of radiation dose distributions using a polymer-gel dosimeter. Phys Med Biol. 1994;39:1437–1455. doi: 10.1088/0031-9155/39/9/010. [DOI] [PubMed] [Google Scholar]
- 6.Oldham M, Siewerdsen JH, Shetty A, Jaffray DA. High resolution gel-dosimetry by optical-CT and MR scanning. Med Phys. 2001;28:1436–1445. doi: 10.1118/1.1380430. [DOI] [PubMed] [Google Scholar]
- 7.Joseph PM, Spital RD. The effects of scatter in x-ray computed tomography. Med Phys. 1982;9:464–472. doi: 10.1118/1.595111. [DOI] [PubMed] [Google Scholar]
- 8.Siewerdsen JH, Jaffray DA. Cone-beam computed tomography with a flat-panel imager: magnitude and effects of x-ray scatter. Med Phys. 2001;28:220–231. doi: 10.1118/1.1339879. [DOI] [PubMed] [Google Scholar]
- 9.Xu Y, Wuu CS, Maryanski MJ. Determining optimal gel sensitivity in optical CT scanning of gel dosimeters. Med Phys. 2003;30:2257–2263. doi: 10.1118/1.1593837. [DOI] [PubMed] [Google Scholar]
- 10.Islam KT, Dempsey JF, Ranade MK, Maryanski MJ, Low DA. Initial evaluation of commercial optical CT-based 3D gel dosimeter. Med Phys. 2003;30:2159–2168. doi: 10.1118/1.1593636. [DOI] [PubMed] [Google Scholar]
- 11.Oldham M. Optical-CT scanning of polymer gels. J Phys: Conf Ser. 2004;3:122–135. doi: 10.1088/1742-6596/3/1/011. [DOI] [PMC free article] [PubMed] [Google Scholar]
- 12.Oldham M, Siewerdsen JH, Kumar S, Wong J, Jaffray DA. Optical-CT gel-dosimetry I: basic investigations. Med Phys. 2003;30:623–634. doi: 10.1118/1.1559835. [DOI] [PMC free article] [PubMed] [Google Scholar]
- 13.Oldham M, Kim L. Optical-CT gel-dosimetry. II: Optical artifacts and geometrical distortion. Med Phys. 2004;31:1093–1104. doi: 10.1118/1.1655710. [DOI] [PMC free article] [PubMed] [Google Scholar]
- 14.Xu Y, Wuu CS, Maryanski MJ. Performance of a commercial optical CT scanner and polymer gel dosimeters for 3-D dose verification. Med Phys. 2004;31:3024–3033. doi: 10.1118/1.1803674. [DOI] [PubMed] [Google Scholar]
- 15.Oldham M, Kim LH, Hugo G. Optical-CT imaging of complex 3D dose distributions. Medical Imaging 2005: Proc of SPIE. 2005;5745:138–146. doi: 10.1117/12.595525. [DOI] [PMC free article] [PubMed] [Google Scholar]
- 16.Oldham M, Gluckman G, Kim L. 3D verification of a prostate IMRT treatment by polymer gel-dosimetry and optical-CT scanning. J Phys: Conf Ser. 2004;3:293–296. [Google Scholar]
- 17.Kelly RG, Jordan KJ, Battista JJ. Optical CT reconstruction of 3D dose distributions using the ferrous-benzoic-xylenol (FBX) gel dosimeter. Med Phys. 1998;25:1741–1750. doi: 10.1118/1.598356. [DOI] [PubMed] [Google Scholar]
- 18.Guo P, Appleby A, Oldham M. The study of the dosimetric properties of 'RadGell, a new dosimeter for three-dimensional gel dosimetry . Med Phys. 2005;32:2009. [Google Scholar]
- 19.Adamovics J, Maryanski MJ. OCT scanning properties of PRESAGE - A 3D radiochromic solid polymer dosimeter. Med Phys. 2004;31:1906. [Google Scholar]
- 20.Doran SJ, Krstajic N, Adamovics J, Jenneson PM. Optical CT scanning of PRESAGE polyurethane samples with a CCD-based readout system. J Phys: Conf Ser. 2004;3:240–243. [Google Scholar]
- 21.Guo P, Adamovics J, Oldham M. Charaterization of a new radiochromic three-dimensional dosimeter. Med Phys. 2006;33:1338–1345. doi: 10.1118/1.2192888. [DOI] [PMC free article] [PubMed] [Google Scholar]
- 22.Guo P, Adamovics J, Oldham M. A practical three-dimensional dosimetry system for radiation therapy. Med Phys. 2006 doi: 10.1118/1.2349686. In Press. [DOI] [PMC free article] [PubMed] [Google Scholar]
- 23.Krstajic N, Doran SJ. Focusing optics of a parallel beam CCD optical tomography apparatus for 3D radiation gel dosimetry. Phys Med Biol. 2006;51:2055–2075. doi: 10.1088/0031-9155/51/8/007. [DOI] [PubMed] [Google Scholar]
- 24.Doran SJ, Koerkamp KK, Bero MA, Jenneson P, Morton EJ, Gilboy WB. A CCD-based optical CT scanner for high-resolution 3D imaging of radiation dose distributions: equipment specifications, optical simulations and preliminary results. Phys Med Biol. 2001;46:3191–3213. doi: 10.1088/0031-9155/46/12/309. [DOI] [PubMed] [Google Scholar]
- 25.Miller J, Adamovics J, Dietrich J. Cone beam optical CT scanner for 3D dosimetry. Med Phys. 2005;32:2138. [Google Scholar]


