

Abstract
Treatment with the protein kinase C activator 12-O tetradecanoylphorbol 12-acetate (TPA) enables radiation-resistant LNCaP human prostate cancer cells to undergo radiation-induced apoptosis, mediated via activation of the enzyme ceramide synthase (CS) and de novo synthesis of the sphingolipid ceramide (Garzotto, M., Haimovitz-Friedman, A., Liao, W. C., White-Jones, M., Huryk, R., Heston, D. W. W., Cardon-Cardo, C., Kolesnick, R., and Fuks, Z. (1999) Cancer Res. 59, 5194-5201). Here, we show that TPA functions to decrease the cellular level of the ATM (ataxia telangiectasia mutated) protein, known to repress CS activation (Liao, W.-C., Haimovitz-Friedman, A., Persaud, R., McLoughlin, M., Ehleiter, D., Zhang, N., Gatei, M., Lavin, M., Kolesnick, R., and Fuks, Z. (1999) J. Biol. Chem. 274, 17908-17917). Gel shift analysis in LNCaP and CWR22-Rv1 cells demonstrated a significant reduction in DNA binding of the Sp1 transcription factor to the ATM promoter, and quantitative reverse transcription-PCR showed a 50% reduction of ATM mRNA between 8 and 16 h of TPA treatment, indicating that TPA inhibits ATM transcription. Furthermore, treatment of LNCaP, CWR22-Rv1, PC-3, and DU-145 human prostate cells with antisense-ATM oligonucleotides, which markedly reduced cellular ATM levels, significantly enhanced radiation-induced CS activation and apoptosis, leading to apoptosis at doses as a low as 1 gray. These data suggest that the CS pathway initiates a generic mode of radiation-induced apoptosis in human prostate cancer cells, regulated by a suppressive function of ATM, and that ATM might represent a potential target for pharmacologic inactivation with potential clinical applications in human prostate cancer.
Prostate cancer is regarded as relatively resistant to the lethal effects of radiation (3, 4). Consistent with this notion, the androgen-responsive LNCaP human prostate cancer cells manifest resistance to both radiation-induced apoptosis (5, 6) and reproductive (postmitotic) cell death (7, 8). Our previous studies showed that the apoptotic resistance of LNCaP cells to radiation can be reversed by pretreatment with the phorbol ester 12-O-tetradecanoylphorbol 12-acetate (TPA)1 (1). TPA commonly signals protection against apoptotic cell death (9), such as induced by tumor necrosis factor α (10, 11), chemotherapy (12), growth factor withdrawal (13), and radiation (14). However, in a few cell types including Epstein-Barr virus-infected Burkitt lymphoma cells (15), immature thymocytes (16), salivary gland acinar cells (17), human MCF-7 breast cancer cells (18), and LNCaP cells (19), TPA was reported to induce and/or enhance the apoptotic response rather than signal antiapoptosis. The apoptotic response to TPA is mediated via protein kinase C (PKC) activation, substituting for endogenous diacylglycerol (20). When PKC activity was compared in TPA-sensitive (LNCaP) and-insensitive (PC-3, DU-145) prostate cancer cell lines, it was found that PKC activation was markedly enhanced and prolonged in LNCaP cells (21).
Garzotto et al. (19) defined a mechanism for the proapoptotic effect of TPA, reporting that treatment of LNCaP cells with TPA at maximally effective doses induces a weak apoptotic response via activation of the regulatory enzyme ceramide synthase (CS) and de novo synthesis of the sphingolipid ceramide. Ceramide is an established second messenger in signaling pathways of apoptosis induced by cytokines (i.e. Fas or tumor necrosis factor), and environmental stresses (e.g. heat shock (22), serum starvation (23), and radiation (14)). CS catalyzes the condensation of the sphingoid base sphinganine and fatty acyl-CoA to form dihydroceramide, which is rapidly oxidized to form ceramide (24). Consistent with CS conferring an apoptotic response in LNCaP cells, Garzotto et al. (19) showed that TPA-mediated generation of ceramide and apoptosis were abrogated by fumonisin B1 (FB1), a specific natural inhibitor of CS activation. Subsequent studies by Garzotto et al. (1) showed that TPA also converted the radiation resistance of LNCaP cells, conferring radiosensitivity. The mechanism by which TPA enables CS activation remains unknown. Studies by Liao et al. showed that radiation-induced DNA double strand breaks signaled in bovine aortic endothelial cells post-translational activation of CS, whereas the ataxia telangiectasia mutated (ATM) kinase, also activated by DNA double strand breaks, down-regulated this response (2). These studies suggested that the balance between CS activation and ATM-mediated CS repression may determine the apoptotic outcome.
ATM is a nuclear 350-kDa protein kinase with a carboxylterminal phosphatidylinositol 3-kinase-like kinase domain (25). It functions as a member of a coordinated system that detects DNA breaks; arrests the cells temporarily at G1, S, or G2 checkpoints; and activates DNA repair (26). ATM mutations produce the genetic disorder ataxia telangiectasia (AT), characterized by dysfunction of the immune, nervous, and endocrine systems (27, 28). At the cellular level, the AT phenotype manifests chromosomal instability (29), increased frequency of malignant transformation (30), defective G1, S, and G2/M cell cycle checkpoints (31, 32), and hypersensitivity to ionizing radiation (33). Transfection with full-length ATM cDNA (34) or with cDNA fragments that contain its carboxyl-terminal phosphatidylinositol 3-kinase domain (35) restored normal radiosensitivity and radiation-induced cell cycle checkpoints in AT cells, indicating that the AT radiation hypersensitivity is mediated via its protein kinase activity. Under resting conditions, there is evidence that ATM is a functionally inactive dimer (36). Radiation induces rapid intermolecular autophosphorylation of serine 1981 that leads to dimer dissociation and ATM kinase activation (36). The downstream signaling pathways are only partially known (37), and details of the ATM repressive effect of CS activity are lacking.
The present studies show that TPA-mediated radiosensitization of human prostate cell lines is mediated via suppression of ATM activity. TPA induces a reduction in ATM protein levels due to attenuation of the Sp1 transcription factor binding to the ATM promoter. Reduction of ATM protein enables radiation to increase CS activity, generating ceramide to induce apoptotic cell death. Conclusive evidence for the role of ATM in this response was obtained by the use of antisense ATM ODNs that depleted human prostate cells of ATM. Antisense ATM-ODNs conferred hypersensitivity to radiation-induced apoptosis in LNCaP cells, enabling radiation-induced apoptosis at doses as low as 1 Gy. Thus, the present studies define the mechanism of TPA-mediated radiosensitization in human prostate cell lines, providing further evidence that the balance between CS and ATM activation regulates a generic form of radiation-induced cell death in prostate cancer cells.
EXPERIMENTAL PROCEDURES
Materials
The human prostate cancer cell lines LNCaP, PC-3, and DU-145 were obtained from ATCC. The androgen-sensitive human prostate cancer cell line CWR22-Rv1 was kindly provided by Dr. Jacobberger from Case Western Reserve University (Cleveland, OH) (38). All cell lines were incubated at 37 °C in a humidified 5% CO2 atmosphere. Unless otherwise stated, all cell culture products were obtained through Mediatech (800-Cellgro). The prostate cancer cell lines were cultured in RPMI 1640 supplemented with 10% fetal calf serum (Gemini Bioproducts), 2 mM L-glutamine, 100 units/ml penicillin and 100 μg/ml streptomycin, and 10 mM HEPES (pH 7.2; Cellgro). For experiments, cells were cultured in the same medium, except 0.2% human albumin was substituted for fetal calf serum. TPA (Sigma) was diluted to a concentration of 1 mg/ml in Me2 SO and stored in 30-μl aliquots at -20 °C in the dark until use. Polyclonal anti-Sp1 antibody (Sp1pEp2) was purchased from Santa Cruz Biotechnology, Inc. (Santa Cruz, CA).
Quantification of Apoptosis
Morphologic changes in the nuclear chromatin of cells undergoing apoptosis were detected by staining with the DNA-binding fluorochrome bis-benzimide trihydrochloride (Hoechst-33258), as previously described (19). Cells were scored as apoptotic when they displayed at least 3 apoptotic bodies/nucleus.
CS Assay
CS activity was assessed in microsomal membranes, as described by Bose et al. (39). Briefly, cells were disrupted on ice by sonication in lysis buffer containing 25 mM HEPES, pH 7.4, 5 mM EGTA, 50 mM sodium fluoride, and protease inhibitor mixture (Roche Applied Science). The microsomal fraction was purified by centrifugation at 100,000 × g for 1 h, and the microsomal membrane pellet was resuspended in lysis buffer. A total of 75 μg of microsomal membrane fraction was incubated with 1 ml of reaction buffer containing 2 mM MgCl2,20mM HEPES (pH 7.4), 20 μM defatted bovine serum albumin, 70 μM unlabeled palmitoyl coenzyme A, 3.6 μM (0.1 μCi) [1-14C] palmitoyl-coenzyme A, and escalating amounts of dihydrosphingosine (0, 1, 2.5, 5, and 10 μM). This mixture was incubated at 37 °C for 1 h. The lipid fraction was dried under N2 and resuspended in 50 μl of a chloroform/methanol (1:2, v/v) solution containing 1 mg/ml ceramide and diacylglycerol. Lipids were resolved on a silica gel 60 thin layer chromatography plate (Whatman) in a solvent consisting of chloroform, methanol, 3.5 N NH4 OH (85:15:1, v/v/v). The ceramide band was localized by iodine vapor staining based on comigration with commercially available ceramide (Sigma Type III) and quantified using liquid scintillation counting. Under the conditions used, the substrate was not rate-limiting, and the reaction was linear for the time and enzyme concentration. Determination of Km and Vmax was performed using Eadie-Hofstee analysis as described by Bose et al. (39).
Quantitation of Ceramide Levels
Ceramide was quantified using the diacylglycerol kinase assay as previously described (1). Briefly, LNCaP cells were detached from the monolayer by gentle pipetting. The cells were pelleted by centrifugation (500 × g for 5 min), washed with ice-cold phosphate-buffered saline, and extracted with 1 ml of ice-cold methanol. Further extraction was performed with 600 μl of buffered saline solution (135 mM NaCl, 1.5 mM CaCl2, 0.5 mM MgCl2, 5.6 mM glucose, and 10 mM HEPES (pH 7.2)) with 10 mM EDTA. Lipids in the organic phase extract were dried under N2 and subjected to mild alkaline hydrolysis (0.1 N methanolic KOH for 1h at 37 °C) to remove glycerophospholipids. Samples were re-extracted, and the organic phase was dried under N2. Ceramide was quantified by the DG kinase assay as described (1).
Analysis of ATM Protein Expression
Cells were lysed in radioimmune precipitation buffer and centrifuged at 18,000 × g for 15 min to remove membranes and nuclear DNA. The concentration of protein in the samples was determined using the BCA technique, purchased from Pierce, and performed as per the manufacturer’s instructions. Samples were then boiled in 4× denaturing Laemmli sample buffer and stored at -80 °C. ATM was resolved using a 5% low cross-linked SDS gel. Monoclonal anti-ATM antibody MAT3 was kindly given by Prof. Y Shiloh (Tel-Aviv University, Tel-Aviv, Israel), whereas the anti-mouse horseradish peroxidase secondary antibody was purchased from Santa Cruz Biotechnology and used at a 1:1000 dilution. The bands were revealed using Western Lightning chemiluminescence reagent (PerkinElmer Life Sciences) as per the manufacturer’s instructions. For the loading controls, the membranes were first stripped using 100 mM Tris-HCl, pH 6.8, 100 mM β-mercaptoethanol, and 2% SDS for 1h at 50 °C,and then the membranes were washed three times in TBS with 0.1% Tween 20. The membrane was reprobed using an anti-DNA-PKcs monoclonal antibody (Neomarkers) at a 1:200 dilution, and the bands were revealed using the same protocol as used for anti-ATM. For densitometry, the bands corresponding to ATM were scanned and analyzed using ImageJ version 1.29 image analysis software.
mRNA Analysis
Levels of mRNA were analyzed by quantitative PCR as described (40). Briefly, during the PCR process, known amounts of 402-bp DNA fragments corresponding to a mutation of ATM lacking exon 38 were used in 2-fold dilutions as a competitor for the amplification of the same region in normal ATM, which gave a 544-bp fragment. A DNA fragment (402 bp) corresponding to an ATM mutation (G5319A) lacking exon 38 was employed as a competitor of ATM cDNA amplification (nucleotides 5122-5665, 544 bp in size) in a series of 2-fold dilutions from LNCaP cells. When the amplified bands showed the same intensity, this provided the concentration of ATM mRNA.
Electrophoretic Mobility Shift Assay
Binding of Sp1 to its consensus sequence was determined by a modification of a method described previously (40). Briefly, 6 × 10⁶ cells were washed in ice-cold phosphate-buffered saline before resuspension in 10 mM HEPES, pH 7.9, buffer containing 10 mM KCl, 0.1 mM EDTA, 0.1 mM EGTA, 1 mM dithiothreitol, and 0.2 mM phenylmethylsulfonyl fluoride. After a 15 min incubation on ice, 25 μl of 10% Nonidet P-40 was added, then the sample was vortexed for 10 s before centrifugation at 18,000 × g for 1 min. The pellet was resuspended in 40 μl of 20mM HEPES, pH 7.9, containing 400 mM KCl, 1 mM EDTA, 1 mM EGTA, 10% glycerol, 1 mM dithiothreitol, and 0.2 mM phenylmethylsulfonyl fluoride and rotated for 30 min at 4 °C to elute the nuclear proteins. After further centrifugation at 18,000 × g for 5 min, the supernatant was flash-frozen in liquid nitrogen in 15-μl aliquots and stored at -70 °C. Approximately 35 fmol of 32P-labeled (using T4 polynucleotide kinase) double-stranded Sp1 consensus sequence (5′-ATTCGATCGGGGCGGGGCGAGC-3′) was added to 10 μg of nuclear extract in the presence of 1 μg of herring sperm DNA, 10 μg of bovine serum albumin, and binding buffer consisting of 10 mM HEPES pH 7.9, 50 mM KCl, 0.5 mM EDTA, 10% glycerol, 0.1% Nonidet P-40, 5 mM dithiothreitol, and 0.2 mM phenylmethylsulfonyl fluoride. Binding was at room temperature for 25 min, and then the bands were resolved using a native 5% polyacrylamide gel.
Transfection Studies
FLAG-tagged wild type and kinase-dead ATM, which has a deletion of 200 bp in the 3′ region in the pcDNA3vector, were kindly provided by Dr. Michael Kastan (St. Jude Children’s Research Hospital, Memphis, TN) and have been previously described (41). The plasmids were transfected into the cells using Lipofectamine PLUS (Invitrogen) as per the manufacturer’s instructions. 24 h following transfection, cells were selected in normal medium containing 200 μg/ml of G418 (Invitrogen), and G418-resistant colonies were expanded. Cells expressing the highest level of transfected ATM (WT8.4) by Western blot were selected for experiments. Small interfering RNA (siRNA) targeted against Sp1 and the control sequence were derived from sequences previously published (42). A 100 nM concentration of either siRNA against Sp1 or control was transfected into LNCaP using Oligofectamine (Invitrogen) as per the manufacturer’s instructions. The efficacy of the siRNA was determined by Western blot against Sp1 protein, which showed significant reduction in Sp1 protein levels 24 h after treatment.
Antisense Inactivation of ATM
For antisense experiments, morpholino oligonucleotides (ODNs) purchased from Gene Tools LLC (Philomath, OR) were used. Morpholino ODNs have the advantage of being more stable and more resistant to endonucleases and have a better sequence specificity than phosphorothioate ODNs (43, 44). For targeting of ATM mRNA, the first 25 bases of the mRNA sequence (ACTA-GACTCATGGTTCACAATTTCA) were used as recommended by the manufacturer (Gene Tools LLC). Morpholino ODNs were delivered to the cell using the “Special Delivery” system (Gene Tools LLC), which is a method for coupling the nonionic morpholino to complementary DNA bound electrostatically to a partially ionized, weakly basic ethoxylated polyethyleneimine. A total of 3 μmol of morpholino ODN was used, and after 3 h of treatment with the morpholino/ethoxylated polyethyleneimine mixture, the supernatant was removed and replaced with normal medium. The cells were subsequently left in culture for either 4 days for LNCaP cells or 3 days for CWR22-Rv1, PC-3, and DU-145 cells before use, which represented the time of maximal reduction in ATM protein level when analyzed by Western blot. Studies using fluorescein isothiocyanate-conjugated ODNs showed the efficiency of transfection to be at least 65%.
Cell Cycle Studies
To determine the cell cycle distribution of the preconfluent LNCaP cultures used in the present studies, a modification of the protocol published by Pozarowski and Darzynkiewicz (45) was used. Cells were incubated in 0.2% human albumin-containing medium 16 h before irradiation, at which time TPA was added at 10 ng/ml. Cells were exposed to 20 Gy and collected every 12 h for 48 h. At the different time points, cell were trypsinized and fixed in ice-cold 70% ethanol and then stored at -20 °C. 1 h before fluorescein isothiocyanate analysis, the cells were centrifuged, and the ethanol solution was replaced with a 3.8 mM sodium citrate (Sigma) solution containing 50 μg/ml propidium iodide (Sigma) and 100 units/ml RNase. The DNA content of the nuclei was measured using FACScalibur, with 10,000 gated events counted, and data were analyzed using Flowjo version 6.1.1.
To determine the duration of cell traversal through the different cell cycle phases, cells were blocked at the G1/S border using aphidicolin (50 μg/ml) and washed out 24 h later. The cells were left to cycle for 2 h before being pulse-labeled with bromodeoxyuridine (10 μM) for 45 min as per the manufacturer’s instructions (BD Pharmingen Flow Kit, San Diego, CA). Cells were irradiated, and samples were taken every 4 h over a period of 28 h and then fixed in 70% cold ethanol. LNCaP cells were then incubated with anti-bromodeoxyuridine fluorescein isothiocyanate antibody, and total DNA was stained using 7-amino-actinomycin D, as per the manufacturer’s instructions. Fluorescein isothiocyanate fluorescence was examined along with total DNA fluorescence using flow cytometry (FACScalibur). 10,000 gated events were counted, and the data were analyzed with Flowjo version 6.1.1.
Colony-forming Assay
LNCaP cells were either untreated or treated with sense or antisense ATM ODNs as described above. LNCaP cells were then irradiated with 0, 1, 2, and 3 Gy, trypsinized, and replated in triplicate at various cell concentrations for colony formation. Colonies were cultured for 2 weeks at 37 °C in a humidified 5% CO2 atmosphere in complete medium to allow for at least six cell divisions. The surviving colonies were fixed and stained with 1% crystal violet in 0.2 M citric acid. Colonies with at least 50 cells were scored, and the results were analyzed by the CellFit version 2.5 program (46).
RESULTS
To exclude the possibility that the effect of TPA represents a LNCaP cell-specific phenomenon, we carried out experiments with another androgen-responsive prostate cancer cell line, CWR22-Rv1. TPA induced a time- and dose-dependent apoptotic response in these cells (Fig. 1A), although induction of apoptosis was slower than that reported in LNCaP cells (1). At 10 ng/ml, apoptosis became detectable by 32 h and peaked at 35-40% by 66 h (p = 0.005). As little as 300 pg/ml TPA was effective, and a maximal effect was achieved with 10-50 ng/ml (data not shown). Pretreatment with a 40 μM concentration of the CS inhibitor FB1 markedly attenuated apoptosis to 12 ± 0.55% at 72 h from 30.1 ± 1.15% observed with 10 ng/ml TPA alone (Fig. 1B). These studies indicated that, similar to LNCaP, CWR22-Rv1 cells respond to phorbol ester stimulation with CS-mediated apoptosis. A kinetic analysis of CS activity disclosed maximal activation from 26 to 32 h post-TPA treatment (Fig. 1C), which corresponded to the time when ceramide levels were rising significantly (Fig. 1D). Eadee-Hofstee transformation of the data revealed that the maximal reaction velocity increased from a basal level of 19.57 pmol/min/mg to 34.79 pmol/min/mg after TPA (p < 0.01, stratified rank sum) without a significant change in the Km. Consistent with this pattern, a full-time analysis of ceramide levels in CWR22-Rv1 cells stimulated by 10 ng/ml TPA (Fig. 1D) showed that ceramide levels increased by 32 h from a base line of 103 ± 17 pmol/106 cells to 225 ± 45 pmol/106 cells (p < 0.01, Wilcoxon rank sum) and remained elevated until 66 h post-treatment (Fig. 1D). Furthermore, similar to the effects of TPA plus radiation in LNCaP cells (1), subtoxic levels of TPA (300 pg/ml), which were insufficient for induction of significant apoptosis in CWR22-Rv1 cells (7.5 ± 1.2% apoptosis, p = 0.5), conferred radiation sensitivity to apoptotic response after 20 Gy (Fig. 1E, p < 0.01, stratified rank sum). Taken together, these data indicate that TPA induction of CS-mediated apoptosis is not a LNCaP-specific phenomenon, since it is also activated in another human prostate cancer cell line.
FIG.1.

TPA-mediated apoptosis in prostate cancer cell line CWR22-Rv1. A, time course for TPA-mediated apoptosis induction. Apoptosis was measured by bis-benzimide staining at the indicated times. B, FB1 inhibits TPA-mediated apoptosis. Cells were pretreated with 40 μM FB1 for 3 h before 10 ng/ml TPA was added. Apoptotic nuclei were counted after 48- and 72-h incubation by bis-benzimide staining. C, ceramide synthase in TPA-treated CWR22-Rv1 cells. CS activity was measured after incubating the cells with 10 ng/ml TPA for the indicated time. D, ceramide levels following incubation with 10 ng/ml TPA. Samples of TPA-treated cells were taken at the time points shown. Ceramide levels were measured by the diacylglycerol kinase assay, and the bars represent S.D. values. E, effect of radiation on TPA-mediated apoptosis. Cells were incubated with 300 pg/ml TPA for 16 h before irradiation at 20 Gy. Apoptotic nuclei were counted using bis-benzimide staining 72 h after irradiation. This dose of TPA that alone was insufficient to induce significant apoptosis conferred radiation sensitivity (p < 0.01; stratified rank sum) in CWR22-Rv1 cells. The bars represent S.D. values. All studies were repeated at least twice.
Because ATM was reported to suppress radiation-induced CS activation in some cell types (2), experiments were carried out to assess the possibility that the proapoptotic effect of TPA is mediated via the reduction of ATM function. LNCaP cells were treated with TPA (10 ng/ml) for 16 h, conditions optimal for TPA-induced CS activation in these cells (1), and ATM levels were examined by Western blot analysis. Fig. 2A shows that there was a 65% reduction in ATM protein levels by pretreatment with 10 ng/ml TPA. Radiation alone (20 Gy) had no significant effect on ATM; nor did radiation have any additional effect on the ATM levels when combined with TPA treatment.
FIG.2.

TPA down-regulates ATM protein levels in LNCaP and CWR22-Rv1 cells. A, Western blot analysis of ATM expression in LNCaP. LNCaP cells were treated either with 20 Gy, with 10 ng/ml TPA, or with TPA for 16 h followed by 20 Gy. B, gel shift assay of Sp1 binding following TPA incubation in LNCaP. LNCaP cells were incubated with 10 ng/ml TPA for the indicated times and compared with nonstimulated samples (NS). The first lane shows supershifted Sp1 caused by incubating the sample with anti-Sp1 antibody. C, Western blot analysis of ATM expression in CWR22-Rv1. CWR22-Rv1 cells were treated either with 20 Gy, with 10 ng/ml TPA, or with TPA for 16 h followed by 20 Gy. The intensity of the band compared with the nonstimulated control is also shown. Equal loading was ensured by reblotting filters with anti-DNA-PKcs antibody. D, gel shift assay of Sp1 binding following TPA incubation in CWR22-Rv1. CWR22-Rv1 cells were incubated with 10 ng/ml TPA for the indicated times and compared with NS samples. The first lane shows supershifted Sp1 caused by incubating the sample with anti-Sp1 antibody. E, competitive reverse transcriptase-PCR analysis of ATM mRNA. Samples from TPA-treated LNCaP cells were taken after 8, 12, and 16 h of incubation. The arrows show the equivalence point denoting where the levels of PCR product are the same. F, Western blot analysis of the effect of Sp1 siRNA on TPA-induced ATM down-regulation. LNCaP cells transfected 24 h previously with a 100 nM concentration of control or Sp1 siRNA were subsequently treated with different concentrations of TPA for 16 h before ATM levels were analyzed. Densitometry of the ATM Western blots is also shown, with protein levels compared with the non-TPA-treated cells. Loading controls are included. The boxed area shows the effect of either nontreated (NT), control unrelated siRNA-treated (Ctl), and Sp1 siRNA-treated (Sp-1) LNCaP 24 h after transfection on Sp1 protein levels. Densitometry shows the level of inhibition as compared with the control, and loading controls (DNA-PKcs) are also shown. All of the studies were repeated at least twice.
Since it was previously reported that inhibition of Sp1 binding can lead to a decrease in ATM mRNA and protein levels in response to epidermal growth factor in C3ABR lymphoblastoid cells (47), Sp1 binding to its consensus oligonucleotide was measured in TPA-treated LNCaP cells. Gel shift analysis showed a significant reduction in the amount of Sp1 binding to its consensus sequence in extracts from LNCaP cells as early as 4 h post-TPA treatment, peaking at 16 h (Fig. 2B). Anti-Sp1 antibodies, which produced a supershift of the retarded band (Fig. 2B, first lane), confirmed the specificity of this interaction.
Consistent with TPA-mediated transcriptional regulation of ATM expression in LNCaP, reduced expression of ATM protein was also detected in CWR22-Rv1 cells after a 16-h incubation with 10 ng/ml TPA (Fig. 2C). ATM protein levels were reduced to 38% of the control after 16 h and remained low for as long as 48 h (Fig. 2C and data not shown). Reduced DNA binding of Sp1 was also detected in CWR22-Rv1 cells as early as 8 h after incubation with TPA and remained low for at least 16 h (Fig. 2D). Exposure to 20 Gy had no significant effect on ATM protein levels (Fig. 2C) or on Sp1 binding (not shown). These data are consistent with TPA-induced down-regulation at the transcriptional level as causative in the reduction in ATM protein levels and radiation hypersensitivity in LNCaP and CWR22-Rv1 cells.
To further explore this notion, competitive reverse transcriptase-PCR was employed. A DNA fragment (402 bp) corresponding to an ATM mutation (G5319), which lacks exon 38, was used as a competitor for ATM cDNA amplification (nucleotides 5122-5665, 544 bp in size) in a series of 2-fold dilutions of extracts from LNCaP cells. After 8 h of treatment with TPA, an equivalence point was reached at 0.25 amol/μl of the competitor. Compared with the equivalence point of 0.5 amol/μl for untreated cells, the effect of TPA represents a 2-fold reduction in ATM mRNA in response to TPA (Fig. 2E). The same equivalence point was reached after 12 and 16 h of TPA treatment, representing a significant sustained 2-fold reduction in ATM mRNA (Fig. 2E).
To more specifically assess whether the loss of Sp1 binding yielded a reduction in ATM mRNA abundance, the effect of siRNA against Sp1 was tested. No change in ATM protein levels was detected after Sp1 protein down-regulation (Fig. 2F), consistent with previously published studies showing that the regulation of ATM gene is controlled by several different transcription factors (48). However, when LNCaP were treated with suboptimal doses of TPA (0.6 ng/ml) in conjunction with siRNA against Sp1, ATM protein levels were markedly reduced (47% of control; Fig. 2F, upper right panel), whereas the same concentration of TPA had no effect on ATM levels in cells treated with unrelated siRNA (Fig. 2F, middle right panel). These data suggest that Sp1 inhibition is required for the TPA effect on ATM transcription, although an additional effect of TPA, possibly via another transcription factor of the ATM promoter, is concomitantly required.
To confirm that reduction in ATM is required for TPA-induced apoptosis, full-length ATM was stably transfected into LNCaP cells under control of a cytomegalovirus promoter to compensate for the reduction of ATM in TPA-treated cells. LNCaP cells transfected with wild type ATM showed a significant attenuation of apoptosis at 48 and 72 h post-TPA (from 54.5 ± 1.4% in vector-transfected control cells at 72 h incubation with TPA to 8.7 ± 1.1%, (Fig. 3)). The ATM-transfected cells also showed significant reduction of TPA-mediated radiosensitization, from over 70% apoptosis in vector-transfected control cells after 72 h of 10 ng/ml TPA plus 20 Gy radiation to less than 30% in ATM-transfected cells. The inset shows ATM protein levels in WT8.4 and the control cell line after 16 h of TPA-treatment, indicating that whereas control cells had significantly decreased ATM levels, the ATM-transfected cells expressed high ATM protein levels. These results support the notion that the level of cellular ATM determines the apoptotic response to TPA and TPA plus radiation in human androgen-responsive prostate cells.
FIG.3.

Reduction in ATM protein is required for TPA-mediated apoptosis. Apoptotic analysis of wild type ATM-transfected LN-CaP (WT8.4) compared with empty vector-transfected LNCaP (Control). TPA-treated cells were first preincubated for 16 h before irradiation at 20 Gy and then incubated for 48 or 72 h before apoptosis was quantified by bis-benzimide staining. The bars represent S.D. values. The inset shows ATM protein levels in WT8.4 and control cells after 16 h of TPA treatment, along with DNA-PKcs as a loading control. All studies were repeated three times.
To provide genetic evidence for the role of ATM in the apoptotic sensitivity of prostate cancer cells, LNCaP and CWR22Rv1 cells were treated with 3 μmol of ATM sense (S-ATM) or antisense (AS-ATM) ODNs. A reduction in ATM protein levels was detected as early as 48 h (not shown) with a nadir of 25 and 40% of control at 96 and 72 h in AS-ATM-ODN-treated LNCaP and CWR22-Rv1 cells, respectively (Fig. 4, A and B). However, ATM loss of function was not sufficient by itself to elicit an apoptotic response, and an additional stimulus, such as radiation exposure, appeared to be required. Fig. 4, C and D, shows that when ATM was effectively suppressed in both LNCaP and CWR22-Rv1 cells by AS-ATM-ODN, the level of apoptosis was not significantly different from S-ATM-ODN-treated or ODN-untreated cells. However, when exposed to 20 Gy, over 30% of the cells underwent apoptosis, significantly higher than in S-ATM-ODN-treated or ODN-untreated cells. The apoptotic response in AS-ATM-ODN-treated cells was inhibited by FB1 (Fig. 4, C and D), confirming that ATM down-regulation enables CS-mediated apoptosis after radiation exposure.
FIG.4.
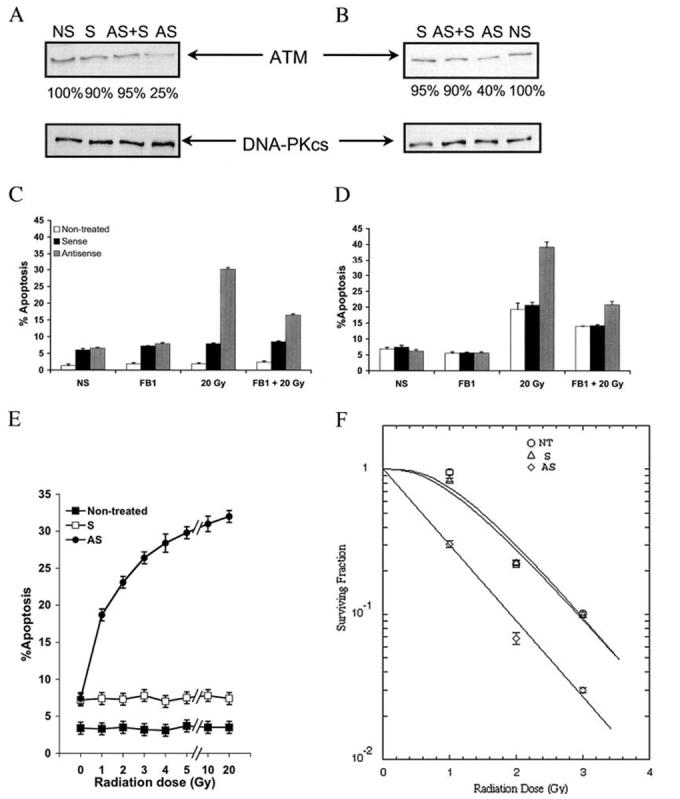
ATM antisense ODNs mimic the radiosensitizing effects of TPA. Analysis of ATM protein levels in LNCaP (A) and CWR22-Rv1 (B) cells following treatment with 3 μmol of sense (S) or antisense (AS) or equal amounts of antisense and sense (AS + S) morpholino ODNs. A nontransfected control is also shown (NS). Band intensity is shown as a percentage of the nontransfected control band. Below are the protein loading controls. Shown is quantification of apoptosis following radiation treatment of transfected LNCaP cells (C) or CWR22-Rv1 cells (D). 40 μM FB1 was administered where indicated 3 h before 20 Gy. Cells were harvested after 24 h for C and 48 h for D. Apoptosis was quantified by counting bis-benzimide-stained nuclei. The bars represent S.D. values. E, cells were either untransfected (Control) or transfected with either sense (S) or antisense (AS) morpholino ATM 96 h before irradiation. The cells underwent medium change to 0.2% human albumin RPMI and were irradiated at the indicated doses. Apoptosis was measured after a 48-h incubation at 37 °C using the bis-benzimide method. Data shown are mean ± S.D. from two independent experiments. F, LNCaP cells were either nontransfected or transfected with either sense or antisense ATM-ODNs, and after 96 h, they were irradiated at various doses. The cells were subsequently replated at known concentrations before culture for 2 weeks. The curves were fit to the data using the single-hit, multiple target (SHMT) model of radiation sensitivity. Each data point represents the mean average of six separate determinations, with S.D. values shown.
To establish the level of radiosensitization conferred by ATM loss of function, LNCaP cells were either untreated or treated with S-ATM or AS-ATM ODNs before exposure to escalating doses of radiation. Apoptosis was quantified 24 and 48 h after irradiation. Fig. 4E shows that AS-ATM-ODN sensitized LN-CaP cells to doses as low as 1 Gy at 48 h postirradiation (18.7 ± 0.6% apoptosis, compared with 7.4 ± 0.54% for S-ATM-ODN and only 3.4 ± 0.2% for ODN-untreated cells, p = 0.0003), and a maximal level of apoptosis was achieved at 20 Gy (32 ± 0.73%, compared with 7.4 ± 0.59% in S-ATM-ODN-treated cells and 3.5 ± 0.46% in ODN-untreated cells; p = 0.0003). At the clinically relevant dose of 2 Gy, the level of apoptosis attained with AS-ATM-ODN (23.1 ± 0.41%) was already at 72% of the maximum effect observed with 20 Gy. The radio-sensitizing effect of AS-ATM-ODN at 2 Gy was observed as early as at 24 h postirradiation (16.1 ± 0.39%, compared with 6.9 ± 0.4% for S-ATM-ODN and only 2.4 ± 0.3% for ODN-untreated cells; p = 0.0016; data not shown). We also assessed the effects of AS-ATM-ODN on LNCaP cell survival after irradiation using the colony-forming assay. Fig. 4F shows that S-ATM-ODN has no significant effect on cell survival when compared with ODN-untreated cells. However, pretreatment with AS-ATM-ODN resulted in significant radiosensitization, with a decrease of the Dq (ODN-untreated = 1.135 Gy, S-ATM-ODN = 1.021 Gy and 0.00 for AS-ATM-ODN) and a shift of the survival curve to the low dose range, without a significant change in the D0 (ODN-untreated = 0.802 Gy, S-ATM-ODN = 0.837 Gy, and 0.830 Gy for AS-ATM-ODN). At the clinically relevant dose range, the SF2 (the survival fraction at 2 Gy) was 0.24 for ODN-untreated and S-ATM-ODN-treated and 0.07 (p = 0.05) for AS-ATM-ODN-treated cells (Fig. 4F).
To confirm that the FB1-inhibitable radiation-induced apoptosis conferred through AS-ATM ODN is through CS, CS activity was measured. Since CS activation in TPA-treated LNCaP occurs faster or at a higher level than in CWR22-Rv1 (1, 19) (Fig. 1, C and D), LNCaP cells were harvested after 3 h of irradiation, whereas CWR22-Rv1 cells were harvested 16 h after irradiation. Fig. 5A shows that in LNCaP cells exposed to 20 Gy, CS activity increased significantly only in cells treated with AS-ATM-ODN (p < 0.01, stratified rank sum). Eadee-Hofstee analysis of the kinetic data revealed that the Vmax increased from a base line of 119.9 pmol/min/mg protein to 257.3 pmol/min/mg protein, without a significant change in theKm. Fig. 5B demonstrates that, similarly, pretreatment with AS-ATM-ODN significantly increased CS activity in CWR22-Rv1 cells at 16 h after 20 Gy (Fig. 5B), increasing the Vmax from 0.66 pmol/min/mg protein in nontransfected or in S-ATM-ODN-transfected cells to 16.62 pmol/min/mg protein in AS-ATM-ODN-transfected cells (p < 0.01, stratified rank sum). For both cell lines, FB1 inhibited the AS-ATM-ODN-mediated CS activation after irradiation (Fig. 5).
FIG.5.

Reduction in ATM protein levels enables radiation activation of CS. LNCaP cells were transfected 96 h before irradiation, and CWR22-Rv1 cells were transfected 72 h before irradiation. Cells were preincubated with 40 μM FB1 where indicated for 3 h prior to irradiation. CS activation was quantified in LNCaP cells 3 h postirradiation (A) and in CWR22-Rv1 cells 16 h postirradiation (B). Shown are nontransfected cells (NT), sense-treated cells (S), and antisense-treated cells (AS). The graphs are representative of one of at least three separate experiments.
Subsequent to CS activation, there was also a rise in cellular ceramide. Because of the difference in the kinetics of CS activation, LNCaP cells were collected for measurement of ceramide levels at 12 h after irradiation, whereas CWR22-Rv1 cells were collected at 24 h after irradiation. Fig. 6, A and B, shows that both cell types treated with AS-ATM-ODN exhibited a significant increase in ceramide levels when exposed to 20 Gy as compared with base-line levels observed in ODN-untreated cells and in S-ATM-ODN-treated cells (p < 0.01, Wilcoxon rank sum), which were inhibited by FB1. Fig. 6C shows the generation of ceramide after exposure to escalating doses of radiation in AS-ATM-ODN-treated cells. Exposure to as low a dose as 1 Gy resulted in a rise in ceramide (499.5 pmol/106 cells, compared with 448 pmol/106 cells for S-ATM-ODN-treated or ODN-untreated cells), reaching a maximum plateau at 20 Gy. Taken together, these studies provide conclusive evidence that reduction of ATM is required to confer CS-mediated apoptotic radio-sensitization of LNCaP and CWR22-Rv1 cells. Reduction of ATM alone is not sufficient, and a second stimulus, such as provided by as low a dose of radiation as 1 Gy is required to activate CS-mediated synthesis of ceramide and apoptosis.
FIG.6.
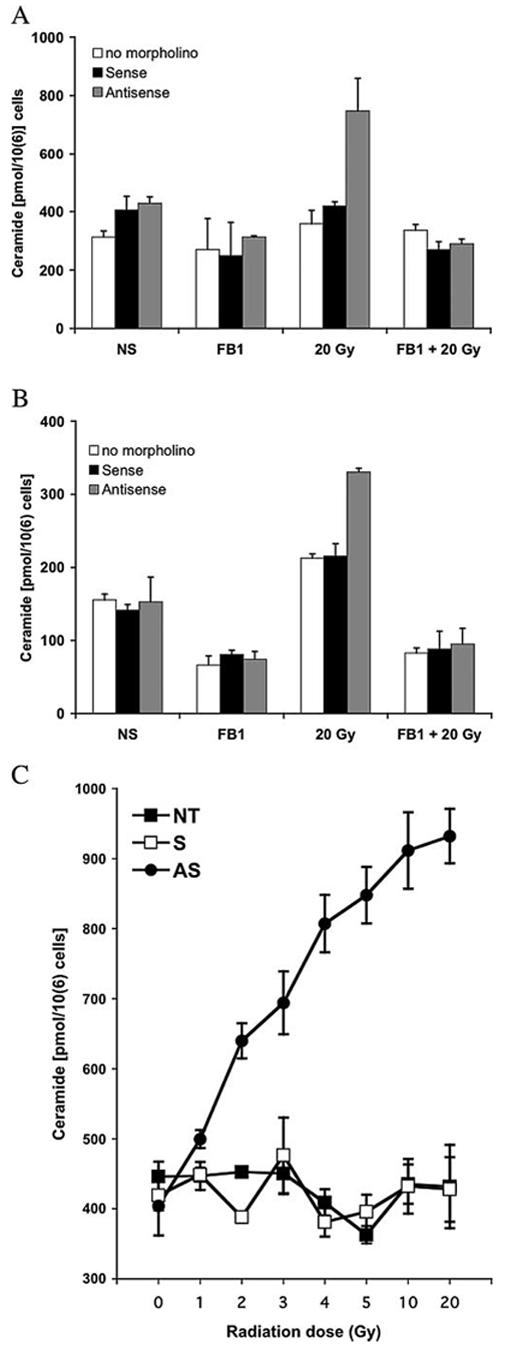
AS-ATM-ODN-treated cells generate ceramide in response to 20-Gy radiation. LNCaP cells were transfected 96 h before irradiation, and CWR22-Rv1 were transfected 72 h before irradiation. Cells were incubated with 40 μM FB1 where indicated for 3 h followed by 20 Gy. Ceramide analysis was performed as in Fig. 1D. A, LNCaP cells were examined 12 h postirradiation. B, CWR22-Rv1 were examined 24 h postirradiation. Data shown are mean ± S.D. from two independent experiments. C, LNCaP cells were either nontreated (NT) or treated with either sense (S) or antisense (AS) ATM ODNs before being exposed to increasing doses of radiation. Ceramide levels were measured 12 h postirradiation. Data shown are mean ± S.D. from three independent experiments.
Whereas previous publications have indicated that ATM inhibition affects progression through the G2/M checkpoint (32, 49) and that progression through this cell cycle checkpoint affects radiation sensitivity (50-52), we tested the effects of TPA or AS-ATM-ODN on G2/M in our LNCaP cells. The distribution of control LNCaP cells by cell cycle phase immediately prior to radiation (69.5% in G1, 4.7% in S phase, and 21.8% in G2/M) was not significantly different from published values for this cell type (53). Furthermore, as published in the literature (53), exposure to 10 Gy did not result in a significant increase of LNCaP cells in G2/M, (20.7 ± 1.6% at 24 h and 24.5 ± 1.8% at 48 h) regardless of pretreatment with TPA (10 ng/ml), S-ATM-ODN, or AS-ATM-ODN. There were also no significant differences in the duration of cells traversing through G2/M, regardless of TPA, S-ATM-ODN, or AS-ATM-ODN treatment with or without radiation (7.8 ± 0.45 h) as measured by flow cytometry of LNCaP cells using anti-bromodeoxyuridine fluorescein isothiocyanate staining of DNA. These data indicate that the radiosensitization conferred by reduction of cellular ATM in LNCaP cells did not result from alterations of radiation-induced G2/M arrest.
We also tested whether decreasing ATM levels elicits an apoptotic response to radiation in TPA-resistant human prostate cancer cells PC-3 and DU-145. Cells were either untreated or transfected with sense or antisense ATM ODNs. ATM protein down-regulation was confirmed by Western blotting and showed to be at 38% of the nontransfected level for PC-3 and at 32% for DU-145 (data not shown). Ceramide levels in PC-3 and DU-145 cells measured 24 h after 20-Gy irradiation (Table I) exhibited increases that mirrored those observed in LNCaP and CWR22-Rv1. Whereas nontransfected and sense-transfected cells showed no significant increase in ceramide after 20-Gy irradiation, AS-ATM ODN transfected cells showed significantly higher levels of ceramide. FB1 was able to inhibit the ceramide increase by 75.4% for PC-3 and 100% for DU-145, indicating that the ceramide elevations conferred by AS-ATM-ODNs reflected CS activation in all prostate cancer cell lines examined in this study. Apoptosis was quantified 48 h after irradiation using the same protocol as for LNCaP and CWR22-Rv1 cells (Table I). Whereas the nontransfected and sense ATM ODN-transfected cells did not undergo significant apoptosis after 20 Gy (3.5 ± 0.1% for PC-3 and 6.3 ± 2.9% for DU-145), AS-ATM-ODN-treated cells were radiosensitive, albeit with different efficiencies (14.8 ± 1.0% PC-3, 27.5 ± 3.3% for DU-145). The radiation-induced apoptosis in AS-ATM-ODN-transfected cells was significantly inhibited with FB1 (76.1% inhibition for PC-3 cells, 57.5% inhibition for DU-145), strongly indicating that the mechanism of apoptotic induction in all of the cell lines tested is CS-mediated.
TABLE I.
Effect of AS-ATM ODNs on ceramide levels and apoptosis Cells were either nontransfected (NT), or transfected with either sense (S) or AS-ATM (AS) ODNs as described under “Experimental Procedures.” LNCaP cells were incubated for 4 days before, whereas the CWR22-Rv1, PC-3, and DU-145 cells were incubated for 3 days before 20-Gy irradiation (the time of maximal reduction in ATM protein level). Ceramide levels were measured 24 h postirradiation using the diacylglycerol kinase assay, and apoptosis was measured 48 h postirradiation using the bisbenzimide trihydrochloride (Hoechst-33258) method as described under “Experimental Procedures. ” Cells were preincubated with 40 μM FB1 for 3 h prior to irradiation. The percentage of inhibition with FB1 was calculated by comparison with NT values. Results are the mean averages of duplicate samples in at least two separate experiments with S.D. shown.
| Cell line | Treatment | Ceramide level | Inhibition of ceramide levels with FB1 | Apoptosis | Inhibition of apoptosis with FB1 |
|---|---|---|---|---|---|
| pmol/106 cells | % | % | % | ||
| LNCaP | NT | 357.1 ± 1.6 | 2.4 ± 0.7 | ||
| S | 388.2 ± 1.3 | 9.8 ± 2.1 | |||
| AS | 745.9 ± 1.8a | 31.2 ± 2.4a | |||
| AS + FB1 | 288.4 ± 1.4a | 100 | 15.0 ± 2.1b | 56.2 | |
| CWR22-Rv1 | NT | 211.5 ± 1.6 | 23.1 ± 5.4 | ||
| S | 205.1 ± 14.8 | 24.0 ± 4.8 | |||
| AS | 326.8 ± 5.0b | 41.4 ± 3.0b | |||
| AS + FB1 | 112.6 ± 24.8b | 100 | 22.2 ± 1.9b | 100 | |
| PC-3 | NT | 231.8 ± 6.1 | 3.5 ± 0.1 | ||
| S | 309.4 ± 55.2 | 5.1 ± 1.4 | |||
| AS | 491.0 ± 68.4b | 14.8 ± 1.0b | |||
| AS + FB1 | 295.4 ± 38.4b | 75.4 | 6.2 ± 1.8b | 76.1 | |
| DU-145 | NT | 395.4 ± 66.6 | 6.3 ± 2.9 | ||
| S | 410.5 ± 33.7 | 10.1 ± 1.0 | |||
| AS | 684.8 ± 44.3b | 27.5 ± 3.3b | |||
| AS + FB1 | 309.6 ± 69.4b | 100 | 15.3 ± 2.1b | 57.5 |
p < 0.001, unpaired t test.
p < 0.01, unpaired t test.
DISCUSSION
The present studies show that TPA decreases ATM protein levels in androgen-sensitive human prostate cancer cells, an event crucial for TPA-induced apoptosis and TPA-mediated radiosensitization of these cells. The alteration in ATM protein levels appeared to be due to inhibition of ATM transcription via decreased binding of Sp1 to the ATM promoter, although the Sp1 siRNA experiments indicated that decreased Sp1 binding was required but not sufficient for down-regulation of ATM transcription. The additional TPA-mediated effector in downregulating ATM transcription remains unknown; nor is there information on the precise mechanism by which TPA effects Sp1 function. Sp1 can be phosphorylated (54, 55), which has been implicated in altering its interaction with Sp1 cognate DNA binding sites and transcriptional activation and can also be O-glycosylated, thus affecting the protein stability and its interaction with other factors (56). Furthermore, specific interaction of ATM with Sp1 suggests that Sp1 may be a substrate for ATM kinase (48). Substantive additional investigation into the biochemical mechanism of ATM regulation appears warranted.
TPA-mediated activation of PKCα may also be involved in this process. Our recent studies using LNCaP cells showed that, similar to the TPA effect, PKCα activation by its specific activator, the branched diacylglycerol-lactone (previously named HK-654), results in reduction of cellular ATM levels and apoptosis (57). The catalytic domain of activated PKCα is required for this event, since LNCaP cells transfected with a kinase-dead dominant-negative mutant of PKCα showed no decrease in ATM protein. Treatment of LNCaP cells with branched diacylglycerol-lactone also resulted in ceramide generation and apoptosis, both inhibitable by FB1, consistent with CS activation occurring secondary to PKCα-mediated ATM reduction. Whether Sp1 is a direct target for activated PKCα remains unknown. Our recent unpublished experiments2 showed that TPA also activates PKCδ in LNCaP cells, which translocates to the mitochondria and is inhibitable by FB1. Recent evidence also indicates that PKCδ, similar to other atypical and novel PKC isoforms, may be activated by ceramide via the C1b domain (58). Relevant to this observation are studies indicating that in addition to the endoplasmic reticulum, CS-mediated de novo synthesis of ceramide also localizes to the mitochondria (59, 60) and that ceramide is involved, or even likely to be required, for mitochondrial apoptosis in some cells (61). Hence, activated PKCδ may function downstream of CS activation in the TPA-mediated apoptotic pathway, although its involvement in down-regulation of ATM transcription as well cannot be excluded.
The enabling of CS-mediated apoptosis in both androgen-sensitive and -insensitive prostate cancer cells via reduction of ATM indicates that the interaction between ATM kinase and CS may represent a generic mode of regulation of radiation-induced death in these cells. Whereas ATM kinase normally represses CS activity, a reduction in ATM protein by TPA or AS-ATM-ODN treatment attenuates CS repression, enabling ceramide synthesis and a proapoptotic state. However, the experiments with AS-ATM-ODN indicated that ATM reduction by itself is not sufficient to induce CS activation and that a second signal, such as that provided by radiation, is required. Consistent with this observation, TPA mimicked radiation in inducing apoptosis in AS-ATM-ODN-treated LNCaP cells (not shown). ATM inactivation by AS-ATM-ODN conferred extreme radiation hypersensitivity, since the level of apoptosis attained in AS-ATM-ODN-treated LNCaP exposed to 2 Gy was already at 72% of the maximum effect observed with 20 Gy (32 ± 0.73%), both significantly higher than the 3.4 ± 0.2% observed after 20-Gy exposure of ODN-untreated cells (Fig. 4E). These data suggest that efficient depletion of ATM may represent a highly attractive target for radiosensitization associated with DNA damage via CS activation.
The mechanism by which ATM kinase regulates CS remains unknown. Whereas ATM inhibition has been shown to affect progression through the G2/M checkpoint in some cell types (32, 49), our studies indicate that deregulation G2/M is not the mechanism of prostate cancer cell radiosensitization. Mammalian CS genes represent homologs of the yeast lag1 and lac1 genes (62) that either harbor CS catalytic activity or play some other essential role in the CS reaction. The first human homolog of lag1 identified is uog1 (63, 64), also known as LASS1. There are six human homologs designated HLASS1 to -6. Riebeling et al. (63) have recently characterized mouse homologs of LASS4 and LASS5 by overexpressing these genes in human embryonic kidney 293T cells. They showed that LASS4-over-expressing cells are preferentially enriched in C18- and C20-ceramide, whereas the synthesis of C16-ceramide is increased in LASS5-overexpressing cells. It should be emphasized that pure enzyme has not yet been made, and hence identification of these genes as legitimate synthases has not yet been confirmed. Nevertheless, screening of the amino acid sequences of the six putative CS genes showed the SQ or TQ motif required for direct interaction with ATM (65) in five of the sequences (HLASS2 to -5). Hence, it is possible that ATM might directly impact CS activity.
The present studies indicate that whereas the proapoptotic effect conferred by TPA is too weak for clinical application (<50% LNCaP cell kill at 20 Gy), AS-ATM-ODN treatment may represent an effective approach to increase radiation-induced apoptosis in TPA-sensitive (LNCaP, CWR22-Rv1) and TPA-resistant (PC-3, DU-145) prostate cancer cells via the CS pathway. The significant apoptotic response observed at doses as low as 1 and 2 Gy in AS-ATM-ODN-treated cells suggests ATM as a potential molecular target for clinical application. Further development of AS reagents or small molecules aimed at ATM inactivation would appear warranted in the treatment of prostate cancer.
Acknowledgments
We thank Drs. Yosef Shiloh and Nechama Smorodinsky for the use of the MAT3 anti-ATM monoclonal antibody, Dr. Michael Kastan for the donation of the wild type ATM-containing pcDNA3 vector, and Desiree Ehleiter for technical help.
Footnotes
This work was supported by NCI, National Institutes of Health, Prostate Spore Grant CA92629-01 and awards from the Prostate Cancer Foundation (previously CaPCURE) (to A. H.-F.) and by a grant from the Flinn Foundation (to Z. F.). The costs of publication of this article were defrayed in part by the payment of page charges. This article must therefore be hereby marked “advertisement” in accordance with 18 U.S.C. Section 1734 solely to indicate this fact.
- TPA
- 12-O-tetradecanoylphorbol 12-acetate
- PKC
- protein kinase C
- CS
- ceramide synthase
- FB1
- fumonisin B1
- ATM
- ataxia telangiectasia mutated
- AT
- ataxia telangiectasia
- siRNA
- small interfering RNA
- S-ATM ODN
- sense sequence to ATM mRNA
- AS-ATM ODN
- antisense sequence to ATM mRNA
- Gy
- gray(s)
- DNA-PKcs
- DNA-dependent protein kinase catalytic subunit
J.-P. Truman, N. Gueven, M. Lavin, S. Leibel, R. Kolesnick, Z. Fuks, and A. Haimovitz-Friedman, unpublished results.
REFERENCES
- 1.Garzotto M, Haimovitz-Friedman A, Liao WC, White-Jones M, Huryk R, Heston DWW, Cardon-Cardo C, Kolesnick R, Fuks Z. Cancer Res. 1999;59:5194–5201. [PubMed] [Google Scholar]
- 2.Liao W-C, Haimovitz-Friedman A, Persaud R, McLoughlin M, Ehleiter D, Zhang N, Gatei M, Lavin M, Kolesnick R, Fuks Z. J. Biol. Chem. 1999;274:17908–17917. doi: 10.1074/jbc.274.25.17908. [DOI] [PubMed] [Google Scholar]
- 3.Crook JM, Perry GA, Robertson S, Esche BA. Urology. 1995;45:624–631. doi: 10.1016/S0090-4295(99)80054-5. [DOI] [PubMed] [Google Scholar]
- 4.Forman JD, Oppenheim T, Liu H, Montie J, McLaughlin P, Porter AT. Prostate. 1993;23:235–243. doi: 10.1002/pros.2990230306. [DOI] [PubMed] [Google Scholar]
- 5.Algan O, Stobbe CC, Helt AM, Hanks GE, Chapman JD. Radiat. Res. 1996;146:267–275. [PubMed] [Google Scholar]
- 6.Li WX, Franklin WA. Radiat. Res. 1998;150:190–194. [PubMed] [Google Scholar]
- 7.DeWeese TL, Shipman JM, Dillehay LE, Nelson WG. J. Urol. 1998;159:591–598. doi: 10.1016/s0022-5347(01)63990-9. [DOI] [PubMed] [Google Scholar]
- 8.Leith JT. Prostate. 1994;24:119–124. doi: 10.1002/pros.2990240304. [DOI] [PubMed] [Google Scholar]
- 9.Blobe GC, Obeid LM, Hannun YA. Cancer Metastasis Rev. 1994;13:411–431. doi: 10.1007/BF00666107. [DOI] [PubMed] [Google Scholar]
- 10.Jarvis WD, Kolesnick RN, Fornari FA, Traylor RS, Gewirtz DA, Grant S. Proc. Natl. Acad. Sci. U. S. A. 1994;91:73–77. doi: 10.1073/pnas.91.1.73. [DOI] [PMC free article] [PubMed] [Google Scholar]
- 11.Obeid LM, Linardic CM, Karolak LA, Hannun YA. Science. 1993;259:1769–1771. doi: 10.1126/science.8456305. [DOI] [PubMed] [Google Scholar]
- 12.Grant S, Jarvis W, Swerdlow P, Turner A, Traylor R, Wallace H, Lin P, Pettit G, Gerwitz D. Cancer Res. 1992;52:6270–6278. [PubMed] [Google Scholar]
- 13.Lotem J, Cragoe EJ, Sachs L. Blood. 1991;78:953–960. [PubMed] [Google Scholar]
- 14.Haimovitz-Friedman A, Balaban NA, McLoughlin M, Ehleiter D, Michaeli J, Vlodavsky I, Fuks Z. Cancer Res. 1994;54:2591–2597. [PubMed] [Google Scholar]
- 15.Ishii H, Gobe G. Biochem. Biophys. Res. Commun. 1993;192:1415–1423. doi: 10.1006/bbrc.1993.1574. [DOI] [PubMed] [Google Scholar]
- 16.Kizaki H, Tadakuma T, Okada C, Maramatsu J, Ishimura Y. J. Immunol. 1989;143:1790–1794. [PubMed] [Google Scholar]
- 17.Reyland ME, Barzen KA, Anderson SM, Quisseli DO, Matassa AA. Cell Death Differ. 2000;7:1200–1209. doi: 10.1038/sj.cdd.4400744. [DOI] [PubMed] [Google Scholar]
- 18.Li Y, Bhuiyan M, Mohammad RM, Sarkar FH. Oncogene. 1998;17:2915–2920. doi: 10.1038/sj.onc.1202218. [DOI] [PubMed] [Google Scholar]
- 19.Garzotto M, White-Jones M, Jiang Y, Ehleiter D, Liao WC, HaimovitzFriedman A, Fuks Z, Kolesnick R. Cancer Res. 1998;58:2260–2264. [PubMed] [Google Scholar]
- 20.Dempsey EC, Newton AC, Mochly-Rosen D, Fields AP, Reyland ME, Insel PA, Messing RO. Am. J. Physiol. 2000;279:L429–L438. doi: 10.1152/ajplung.2000.279.3.L429. [DOI] [PubMed] [Google Scholar]
- 21.Henttu P, Vihko P. Biochem. Biophys. Res. Comm. 1998;244:167–171. doi: 10.1006/bbrc.1998.8238. [DOI] [PubMed] [Google Scholar]
- 22.Schutze S, Machleidt T, Kronke M. J. Leukocyte Biol. 1994;56:533–541. doi: 10.1002/jlb.56.5.533. [DOI] [PubMed] [Google Scholar]
- 23.Puranam KL, Guo WX, Qian WH, Nikbakht K, Boustany RM. Mol. Genet. Metab. 1999;66:294–308. doi: 10.1006/mgme.1999.2834. [DOI] [PubMed] [Google Scholar]
- 24.Spiegel S, Foster D, Kolesnick R. Curr. Opin. Cell Biol. 1996;8:159–167. doi: 10.1016/s0955-0674(96)80061-5. [DOI] [PubMed] [Google Scholar]
- 25.Shiloh Y. Biochem. Soc. Trans. 2001;29:661–666. doi: 10.1042/0300-5127:0290661. [DOI] [PubMed] [Google Scholar]
- 26.Sommer SS, Jiang Z, Feng J, Buzin CH, Zheng J, Longmate J, Jung M, Moulds J, Dritschilo A. Cancer Genet. Cytogenet. 2003;145:115–120. doi: 10.1016/s0165-4608(03)00119-5. [DOI] [PubMed] [Google Scholar]
- 27.Sedgwick RP, Boder E. In: Hereditary Neuropathies and Spinoc-erbellar Atrophies. Vianney De Jong JMB, editor. Elsevier; Amsterdam: 1991. pp. 347–423. [Google Scholar]
- 28.Lavin MF, Shiloh Y. Annu. Rev. Immunol. 1997;15:177–202. doi: 10.1146/annurev.immunol.15.1.177. [DOI] [PubMed] [Google Scholar]
- 29.Aurias A, Dutrillaux B, Buriot D, Lejeune J. Mutat. Res. 1980;69:369–374. doi: 10.1016/0027-5107(80)90101-3. [DOI] [PubMed] [Google Scholar]
- 30.Xu Y, Ashley T, Brainerd EE, Bronson RT, Meyn MS, D. B. Genes Dev. 1996;10:2411–2422. doi: 10.1101/gad.10.19.2411. [DOI] [PubMed] [Google Scholar]
- 31.Beamish H, Williams R, Chen P, Lavin M. J. Biol. Chem. 1996;271:20486–20493. doi: 10.1074/jbc.271.34.20486. [DOI] [PubMed] [Google Scholar]
- 32.Kastan MB, Zhan Q, el-Deiry WS, Carrier F, Jacks T, Walsh WV, Plunkett BS, Vogelstein B, Fornace AJ., Jr. Cell. 1992;71:587–597. doi: 10.1016/0092-8674(92)90593-2. [DOI] [PubMed] [Google Scholar]
- 33.Chen CY, Lavin M, Kidson C, Moss D. Nature. 1978;274:484–486. doi: 10.1038/274484a0. [DOI] [PubMed] [Google Scholar]
- 34.Zhang N, Chien P, Khanna KK, Scott S, Gatei M, Kozlov S, Watters D, Spring K, Yen T, Lavin MF. Proc. Natl. Acad. Sci. U. S. A. 1997;94:8021–8026. doi: 10.1073/pnas.94.15.8021. [DOI] [PMC free article] [PubMed] [Google Scholar]
- 35.Morgan SE, Lovly C, Pandita TK, Shiloh Y, Kastan MB. Mol. Cell. Biol. 1997;17:2020–2029. doi: 10.1128/mcb.17.4.2020. [DOI] [PMC free article] [PubMed] [Google Scholar]
- 36.Bakkenist CJ, Kastan MB. Nature. 2003;421:499–506. doi: 10.1038/nature01368. [DOI] [PubMed] [Google Scholar]
- 37.Kastan MB, Lim DS. Nat. Rev. Mol. Cell. Biol. 2000;1:179–186. doi: 10.1038/35043058. [DOI] [PubMed] [Google Scholar]
- 38.Sramkoski RM, Pretlow TG, II, Giaconia JM, Pretlow TP, Schwartz S, Sy MS, Marengo SR, Rhim JS, Zhang D, Jacobberger JW. In Vitro Cell Dev. Biol. Anim. 1999;35:403–409. doi: 10.1007/s11626-999-0115-4. [DOI] [PubMed] [Google Scholar]
- 39.Bose R, Verheij M, Haimovitz-Friedman A, Scotto K, Fuks Z, Kole-snick R. Cell. 1995;82:405–414. doi: 10.1016/0092-8674(95)90429-8. [DOI] [PubMed] [Google Scholar]
- 40.Keating KE, Gueven N, Watters D, Rodemann HP, Lavin MF. Oncogene. 2001;20:4281–4290. doi: 10.1038/sj.onc.1204527. [DOI] [PubMed] [Google Scholar]
- 41.Canman CE, Lim DS, Cimprich KA, Taya Y, Tamai K, Sakaguchi K, Appella E, Kastan MB, Siliciano JD. Science. 1998;281:1677–1679. doi: 10.1126/science.281.5383.1677. [DOI] [PubMed] [Google Scholar]
- 42.Li T, Chen Y, Liu T, Jia J, Hampson S, Shan Y, Kibler D, Wang P. Circ. Res. 2003;93:1202–1209. doi: 10.1161/01.RES.0000104085.76261.02. [DOI] [PubMed] [Google Scholar]
- 43.Taylor MF, Paulauskis JD, Weller DD, Kobzik L. Cytokine. 1997;9:672–681. doi: 10.1006/cyto.1997.0212. [DOI] [PubMed] [Google Scholar]
- 44.Summerton J, Stein D, Huang SB, Matthews P, Weller D, Par-tridge M. Antisense Nucleic Acid Drug Dev. 1997;7:63–70. doi: 10.1089/oli.1.1997.7.63. [DOI] [PubMed] [Google Scholar]
- 45.Pozarowski P, Darzynkiewicz Z. Methods Mol. Biol. 2004;281:301–311. doi: 10.1385/1-59259-811-0:301. [DOI] [PubMed] [Google Scholar]
- 46.Albright N. Radiat. Res. 1987;112:331–340. [PubMed] [Google Scholar]
- 47.Gueven N, Keating KE, Chen P, Toshiyuki F, Khanna KK, Watters D, Rodemann HP, Lavin MF. J. Biol. Chem. 2001;276:8884–8891. doi: 10.1074/jbc.M006190200. [DOI] [PubMed] [Google Scholar]
- 48.Gueven N, Keating KE, Fukao T, Loeffler H, Kondo N, Rodemann HP, Lavin M. Genes Chromosomes Cancer. 2003;38:157–167. doi: 10.1002/gcc.10261. [DOI] [PubMed] [Google Scholar]
- 49.Beamish H, Lavin MF. Int. J. Radiat. Biol. 1994;65:175–184. doi: 10.1080/09553009414550211. [DOI] [PubMed] [Google Scholar]
- 50.Withers H, Mason K, Reid B, Dubravsky N, Barkley H, Jr., Brown B, Smathers J. Cancer. 1974;34:39–47. doi: 10.1002/1097-0142(197407)34:1<39::aid-cncr2820340107>3.0.co;2-z. [DOI] [PubMed] [Google Scholar]
- 51.Terasima T, Tolmach L. Biophys. J. 1963;3:11–33. doi: 10.1016/s0006-3495(63)86801-0. [DOI] [PMC free article] [PubMed] [Google Scholar]
- 52.Sinclair W, Morton R. Radiat. Res. 1966;29:450–474. [PubMed] [Google Scholar]
- 53.Scott SL, Gumerlock PH, Beckett L, Li Y, Goldberg Z. Int. J. Radiat. Oncol. Biol. Phys. 2004;59:219–227. doi: 10.1016/j.ijrobp.2004.01.027. [DOI] [PubMed] [Google Scholar]
- 54.Daniel S, Zhang S, DePaoli-Roach AA, Kim KH. J. Biol. Chem. 1996;271:14692–14697. doi: 10.1074/jbc.271.25.14692. [DOI] [PubMed] [Google Scholar]
- 55.Armstrong SA, Barry DA, Leggett RW, Mueller CR. J. Biol. Chem. 1997;272:13489–13495. doi: 10.1074/jbc.272.21.13489. [DOI] [PubMed] [Google Scholar]
- 56.Han I, Kudlow JE. Mol. Cell. Biol. 1997;17:2550–2558. doi: 10.1128/mcb.17.5.2550. [DOI] [PMC free article] [PubMed] [Google Scholar]
- 57.Truman J, Liao W-C, Ehleiter D, Kolesnick R, Lavin M, Leibel SA, Fuks Z, Haimovitz-Friedman A. Proc. Am. Assoc. Cancer Res. 2004;45:318. Abstract. [Google Scholar]
- 58.Kashiwagi K, Shirai Y, Kuriyama M, Sakai N, Saito N. J. Biol. Chem. 2002;277:18037–18045. doi: 10.1074/jbc.M111761200. [DOI] [PubMed] [Google Scholar]
- 59.Shimeno H, Soeda S, Sakamoto M, Kouchi T, Kowakame T, Kihara T. Lipids. 1998;33:601–605. doi: 10.1007/s11745-998-0246-2. [DOI] [PubMed] [Google Scholar]
- 60.Hirschberg K, Rodger J, Futerman AH. Biochem. J. 1993;290:751–757. doi: 10.1042/bj2900751. [DOI] [PMC free article] [PubMed] [Google Scholar]
- 61.Birbes H, Bawab S, Obeid L, Hannun Y. Adv. Enzyme Regul. 2002;42:113–129. doi: 10.1016/s0065-2571(01)00026-7. [DOI] [PubMed] [Google Scholar]
- 62.Jiang JC, Kirchman PA, Zagulski M, Hunt J, Jazwinski SM. Genome. Res. 1998;8:1259–1272. doi: 10.1101/gr.8.12.1259. [DOI] [PubMed] [Google Scholar]
- 63.Riebeling C, Allegood JC, Wang E, Merrill AHJ, Futerman AH. J. Biol. Chem. 2003;278:43452–43459. doi: 10.1074/jbc.M307104200. [DOI] [PubMed] [Google Scholar]
- 64.Lee S. Proc. Natl. Acad. Sci. U. S. A. 1991;88:4250–4254. doi: 10.1073/pnas.88.10.4250. [DOI] [PMC free article] [PubMed] [Google Scholar]
- 65.Kim ST, Lim DS, Canman CE, Kastan MB. J. Biol. Chem. 1999;274:37538–37543. doi: 10.1074/jbc.274.53.37538. [DOI] [PubMed] [Google Scholar]