

Abstract
Purpose
A strong association between surgeon, hospital volume and postoperative morbidity of radical prostatectomy has been demonstrated. While better outcomes are associated with high volume surgeons, the degree of variation in outcomes among surgeons has not been fully examined.
Materials and Methods
Using a linked database from Surveillance, Epidemiology and End Results registries and federal Medicare claims data, we analyzed outcomes of consecutive patients treated with radical prostatectomy between 1992 and 1996. We focused on variations in several measures of morbidity (perioperative complications, late urinary complications and long-term incontinence) among patients of high volume surgeons, defined as those with 20 or more patients in the study period. After adjusting for hospital, surgeon volume and case mix, we examined the extent to which variations in the rates of adverse outcomes differed among surgeons for all 3 end points.
Results
Of the 999 surgeons 16% (159) performed 48.7% (5,238) of the 10,737 radical prostatectomies during the study. The 30-day mortality rate was 0.5%, the major postoperative complication rate was 28.6%, late urinary complications 25.2% (major events 16%) and long-term incontinence 6.7%. For all 3 morbidity outcomes the variation among surgeons in the rate of complications was significantly greater than that expected by chance (p =0.001 for each) after adjustment of covariates. Furthermore, surgeons with better (or worse) than average results with regard to 1 outcome were likely to have better (or worse, respectively) results with regard to the other2 outcome measures.
Conclusions
Morbidity end points that directly affect quality of life showed significant variability among high volume providers. Surgeons who performed well in 1 area (eg postoperative complications) performed well in others. These results further suggest that variations in surgical technique and postoperative care lead to variations in outcomes after radical prostatectomy, indicating that outcomes of this operation are sensitive to small differences in performance.
Keywords: outcome and process assessment, prostatectomy, complications, urinary incontinence, workload
The recent literature contains many studies of associations between outcomes of surgical procedures and the volume of such procedures performed at a given hospital. Mortality and complications from esophageal, lung, pancreatic and vascular surgery are reportedly lower in high volume centers.1,2 Long-term cancer control after surgery for colon cancer is better, controlling for stage, grade and patient characteristics, in high volume centers.3 For some such procedures the Leapfrog coalition of health care purchasers has instituted a volume standard for hospital referrals.2 Some studies also suggest that the volume of cases performed by individual surgeons may also be associated with outcomes.4 When properly performed studies show a relationship between volumes and outcomes, the implication is that there are variations in the quality of care. Reduction in these variations is likely to lead to improved care. In an era of cost containment measures, outcomes research focused on the quality and improvement of delivery of health care is important.
Currently about a third of patients newly diagnosed with prostate cancer are treated with radical prostatectomy (RP),5,6 an operation that has a low risk of mortality but may have a profound impact on quality of life. We previously examined volume-outcome associations from the Medicare population in 11,552 men treated with radical prostatectomy between 1992 and 1996.7 Hospital and surgeon volume were significant predictors of major postoperative and late urinary complications.7 In this study we examined the extent of variation in outcomes among high volume surgeons to assess the degree to which volume-outcome associations were attributable to relatively widespread practice patterns or, alternatively, to variations in surgical care even among experienced providers.
METHODS
Patient cohort
We used the linkage of Medicare claims data with the Surveillance, Epidemiology and End Results (SEER) cancer registries built from 6 metropolitan areas and 5 states, covering about 14% of the United States population. Details of the original cohort of 11,522 patients have been described.7 The age limitation of the dataset could skew the classification of surgeon volume because of the considerable numbers of procedures in younger men that were not included. We sought validation using 2 data sources. First we identified all prostatectomies performed in New York state during 1994 to 1996 from the state discharge registry, and calculated the hospital volume in 2 ways, using all patients and using only patients 65 years of age or older. The Spearman rank correlation was 0.96. We evaluated surgeon volume in the same manner and obtained a correlation of 0.91. For this analysis high volume surgeons consisted of those physicians who had performed more than 20 radical prostatectomies in the study population during the study period (1992 to 1996), since reliable analysis of surgeon specific variation in outcomes is increasingly degraded as the sample size per surgeon is reduced.
Outcome measures
The 3 major end points of this analysis were postoperative and late urinary complications, and longterm incontinence. The events for the end points were compiled from outpatient and inpatient medical claims registered by 1998 following International Classification of Diseases (ICD)-9 or Health Care Finance Administration Current Procedural Coding System (HCPCS) codes as shown in table 1. Serious life threatening events (vascular thrombosis or embolism, cardiac arrest, respiratory failure, hemorrhagic shock and renal failure, among others) registered within 30 days of surgery accounted for postoperative complications. Late urinary complications consisted of procedures for urethral or ureteral stricture, bladder neck obstruction, fistulas or abscess in the pelvis, or treatment for incontinence after the first month but within the first year of surgery. Events on diagnosis code for incontinence or a procedure code (urodynamics, collagen injection or artificial sphincter placement) for urinary incontinence after the first year defined long-term incontinence.
TABLE 1.
Codes for defining morbidity end points7
| Complications | Diagnosis Codes (ICD-9) | Procedure Codes (ICD-9 or HCPCS) |
|---|---|---|
| Periop (0-30 days after RP): | ||
| Cardiac (13.5) | 410.x, 402.01, 402.11, 402.91, 428.x, 427.5, 997.1 | |
| Respiratory (26.9) | 518.0, 514, 518.4, 466.x, 480.x, 481, 482.x, 483.x, 485, 486, 518.5, 518.81, 581.82, 799.1, 997.3 | |
| Vascular(11.5) | 415.1, 451.1x, 451.2, 451.81, 451.9, 453.8, 453.9, 997.2, 999.2, 444.22, 444.81, 433.x, 434.x, 436, 437.x | |
| Wound/bleeding (6.4) | 567.x, 998.3, 998.5x, 998.6 | ICD-9: 54.61, 54.91, 54.0, 54.19, 59.19 |
| HCPCS: 26990, 45020, 49060, 51080 | ||
| Genitourinary (6.9) | 595.89, 590.1x, 590.2, 590.8x, 590.9, 591, 997.5, 596.1, 596.2, 596.6, 593.3, 593.4, 593.5, 593.81, 593.82 | ICD-9: 55.02, 55.03, 55.12, 55.93, 55.94, 59.93, 97.61, 97.62, 56.1, 56.41, 56.74, 56.75, 56.81, 56.84, 56.86, 56.89, 56.91 HCPCS: 50040, 50120, 50125, 50395, 50398, 50605, 52290, 52332, 52334, 50600, 50700, 50715, 50760, 50770, 50780, 50782, 50783, 50785, 50800, 50810, 50815, 50820, 50825, 50840, 50900, 50940 |
| Miscellaneous-medical (18.6) | 584.x, 586, 785.5x, 995.0, 995.4, 998.0, 999.4, 999.5, 999.6, 999.7, 999.8, 457.8, 560.1, 560.8x, 560.9, 997.4, 353.0, 354.2, 723.4, 955.1, 955.3, 955.7, 955.8, 955.9, 593.4, 531.1, 531.2, 531.3, 531.4, 531.5, 531.6, 531.9, 532.1, 532.2, 532.3, 532.4, 532.5, 532.6, 532.9, 533.1, 533.2, 533.3, 533.4, 533.5, 533.6, 533.9, 782.4, 573.8 | |
| Miscellaneous-surgical (16.2) | 599.1, 596.1, 596.2, 596.6, 565.1, 569.3, 569.83, 569.4, 569.4x, 998.1x, 998.83, 998.9, 998.2, 998.4, 998.7, 604.0, E870.0, E870.4, E870.7, E870.8, E870.9, E871.0, E873.0, E876.0, 956.0, 956.1, 956.4, 956.5, 956.8, 956.9, 902.50, 902.51, 902.52, 902.53, 902.54, 902.59 | ICD-9: 46.03, 46.04, 46.10, 46.11, 46.14, 48.4x, 48.5, 48.6x, 48.7x, 48.9x |
| Late urinary (31-365 days afterRP): | ||
| Bladderneck obstruction/ urethral stricture (84.5) | 788.62, 788.2x, 596.0, 599.6, 598.00, 598.1, 598.2, 598.8, 598.9 | ICD-9: 57.0, 57.1x (all majorexcept 57.11), 57.2x, 57.82, 57.93, 57.94, 57.95, 59.94, 97.63, 97.64, 97.69, 57.92, 58.6, 97.65, 98.19, 57.4x, 57.85, 57.89, 57.91, 58.0, 58.1, 58.3x, 58.44, 58.46, 58.47, 58.5, 58.99 |
| HCPCS: 51600, 51610, 51010, 51040, 51705, 51880, 52510, 52281, 52283, 53600, 53601, 53605, 53620, 53621, 53640, 51520, 51800, 51820, 52275, 52276, 52310, 52500, 52620, 52640, 53000, 53010, 53020, 53400, 53405, 53410, 53415, 53420, 53425 | ||
| Ureteral stricture, obstruction or fistula (5.2) | ICD-9: 56.31, 59.8, 55.02, 55.03, 55.12, 55.93, 55.94, 59.93, 97.61, 97.62, 56.1, 56.41, 56.74, 56.75, 56.81, 56.84, 56.86, 56.89, 56.91 HCPCS: 50390, 50392, 50393, 50394, 50572, 50951, 50953, 50970, 50972, 52005, 52335, 50040, 50120, 50125, 50395, 50398, 50605, 52290, 52332, 52334, 50600, 50700, 50715, 50760, 50770, 50780, 50782, 50783, 50785, 50800, 50810, 50815, 50820, 50825, 50840, 50900, 50940 | |
| Intestinal orvesical fistula (1.1) | 596.1, 596.2, 599.1, 998.6 | ICD-9: 57.83, 57.84, 58.43 HCPCS: 45800, 45805, 45820, 45825, 50920, 50930, 53520 |
| Lymphocele, pelvic abscess, urinoma (5) | 457.8, 567.2, 567.8, 595.89, 682.2, 998.59 | ICD-9: 54.91, 54.0, 54.19, 59.19 |
| HCPCS: 26990, 54020, 49060, 51080 | ||
| Definitive incontinence repair (4.2) | ICD-9: 59.72, 59.4, 59.5, 59.6, 59.7x, 58.99, 58.93, 59.3 | |
| HCPCS: 51715, 11950, 11951, 11952, 11954, L8603, 51840, 51841, 53440, 53442, 53445, 53447, 53449, 53443 | ||
| Long-term incontinence (more than 365 days after RP): | ||
| Diagnosis codes (64.8) | 788.3x, 599.82 | |
| Definitive incontinence repair (20.1) | ICD-9: 59.72, 59.4, 59.5, 59.6, 59.7x, 58.99, 58.93, 59.3 | |
| HCPCS: 51715, 11950, 11951, 11952, 11954, L8603, 51840, 51841, 53440, 53442, 53445, 53447, 53449, 53443 | ||
| Diagnostic tests (14.7) | ICD-9: 89.22, 89.21, 89.23, 89.25 HCPCS: 51725, 51726, 51772, 51784, 51785, 51792, 51795, 51797 | |
| Othertr eatment or miscellaneous sup plies (0.4) | HCPCS: E0740, A4335, A5149 |
Each category adds 100% for each complication and codes indicating major diagnoses or procedures for late urinary complications are bolded.
Statistical analysis
We used a logistic regression model to estimate the expected rate of events for each surgeon by correcting for patient covariates (age, stage of disease and the Romano-Charlson index8 at the time of surgery), and adjusting for hospital and surgeon volume, both modeled as continuous variables. The binomial distribution based on the preceding expected event rate driven by the number of patients in the surgeon’s profile was used to determine probabilities for each possible observed outcome. Histograms were created to characterize visually the degree of unexplained intersurgeon variation in outcomes as described by Panageas et al.9 A test for extra-binomial variation was used to explore the results of unexplained correlation in outcomes of patients with the same surgeon. This test detects additional surgeon-to-surgeon variation that cannot be explained by factors in the model. The standardized deviations (z scores) of the observed from the expected frequencies for each surgeon were then used to calculate correlation coefficients between the end points. Thus, we could characterize the associations among individual surgeons with exceptionally high or low risk of adverse outcomes. All p values quoted are 2-tailed.
RESULTS
A total of 5,238 patients were operated on by 1 of 159 high volume surgeons. Surgeons performed between 20 and 121 prostatectomies in this population during the study. The mean age was 70 years and 90% were white men. Romano-Charlson comorbidity indexes of 0, 1 and 2 were present in 80%, 17% and 3%, respectively. Death within 30 days of the operation was observed in 1 of 200 patients (0.5%). Major postoperative complications were recorded in 28.6%, late urinary complications in 25.2% (major events 16%), and 6.7% had long-term incontinence requiring a surgical procedure to ameliorate symptoms.
We observed a statistically significant variability in outcomes among high volume surgeons in the rates of postoperative complications, late urinary complications and longterm incontinence after adjusting for covariates (p <0.001 for each outcome). Some high volume surgeons had patients with substantially higher rates (while others had exceptionally lower rates) of adverse events than could be predicted by the model (table 2).
TABLE 2.
| Outcomes | No. Surgeons With Exceptionally Good Outcomes (% below 1st percentile) | No. Surgeons With Exceptionally Poor Outcomes (% above 99th percentile) |
|---|---|---|
| Postop morbidity | 4 (3) | 12 (8) |
| Late urinary complications | 23 (14) | 21 (13) |
| Long-term incontinence | 4 (3) | 15 (9) |
Individual standardized deviations from expected rates were calculated for each surgeon, and these clearly demonstrate that there is a group of surgeons that exhibits substantially worse event rates than can be predicted by case mix and chance variation (due to the limited sample size in the surgeon profile) in that substantially more than 1% of surgeons have rates above the 99th percentile of the predicted distribution of outcomes.
Figure 1 illustrates the variations in postoperative compilation rates among surgeons. A total of 22 surgeons had complication rates of less than 15%. However, this finding was expected for just 8 surgeons. Similarly 10 surgeons had patient profiles with complication rates greater than 50%, a finding expected to occur for just 1 surgeon. For late urinary compilations the discrepancy was more pronounced, with the patients of 19 surgeons having rates less than 5% rather than the expected 1 surgeon (fig. 2). None of the surgeons was expected to have late urinary complication rates greater than 55% but 11 did. Finally late urinary incontinence rates of less than 10% were expected for 19 surgeons but observed in 38 (fig. 3). Incontinence rates greater than 40% were observed in 11 surgeons while none were expected.
FIG. 1.
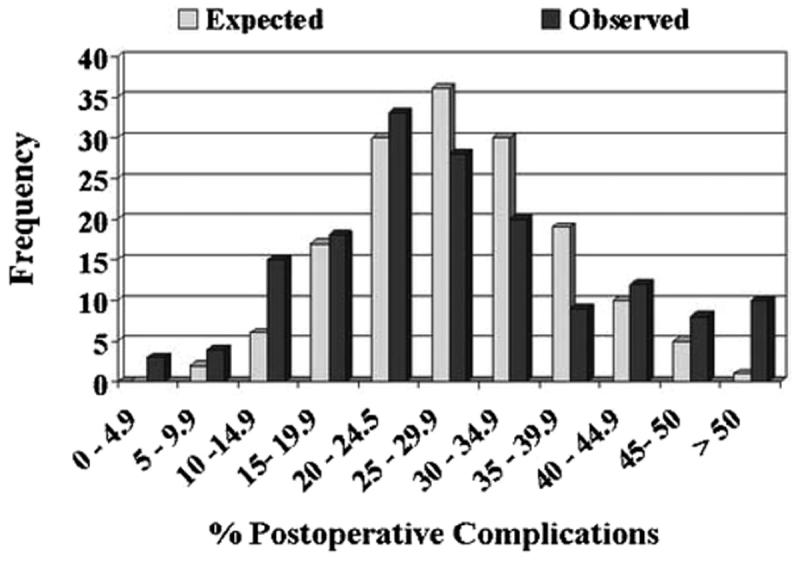
For each grouped postoperative complications rate (by cells of 5%), histograms juxtapose observed and expected number of surgeons (p <0.001). More outliers on right side of histogram in observed vs expected plot highlight providers achieving poor outcomes. Conversely, outliers toward left in observed vs expected plots indicate surgeons achieving more favorable outcomes.
FIG. 2.

For each grouped late urinary complications rate (by cells of 5%), histograms juxtapose observed and expected number of surgeons (p <0.001). More outliers on right side of histogram in observed vs expected plot highlight providers achieving poor outcomes. Conversely, outliers toward left in observed vs expected plots indicate surgeons achieving more favorable outcomes. Modified from Panageas et al.9
FIG. 3.
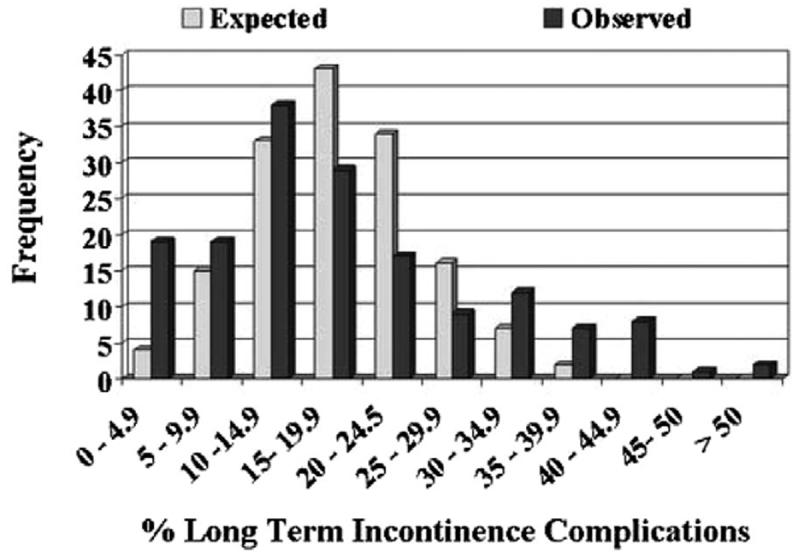
For each grouped long-term incontinence rate (by cells of 5%), histograms juxtapose observed and expected number of surgeons (p <0.001). More outliers on right side of histogram in observed vs expected plot highlight providers achieving poor outcomes. Conversely, outliers toward left in observed vs expected plots indicate surgeons achieving more favorable outcomes.
Furthermore, the differences in the observed and expected rates of outcomes of patients of individual surgeons correlated among all 3 end points. Surgeons who performed poorly with postoperative complications also did so on late urinary complications (r = 0.21, p = 0.001) and incontinence (r = 0.14, p = 0.08). Similarly surgeons with high rates of late urinary complications also had increased rates of incontinence in their patients (r = 0.35, p = 0.001).
DISCUSSION
The importance of understanding the variability in surgical treatments among cancer providers and its effects on outcomes is gaining recognition. High volume hospitals generally have lower mortality rates but the magnitude of the trend varies according to the surgical procedure.2,10-12 For major urological procedures Birkmeyer et al reported that mortality rates after nephrectomy decreased from 2.6% to 2.1% and after cystectomy a 47% reduction was observed in comparing low to high volume hospitals.2 In a separate study of nationwide inpatient data, the same group reported significantly lower perioperative mortality rates after radical prostatectomy in high volume (0.17%) vs low volume (0.3%) hospitals.13 Explanations of these differences include better equipment, fully staffed intensive care units, broader range of specialists and other resources in high volume hospitals that are less often available at smaller centers.1 Other investigators argue that apparent differences are observed because of differences in the overall health of patients or other conditions unrelated to surgical and perioperative care,14 and show the small differences observed among large health systems with homogenous patient populations.15
Controversy surrounds the concept that the individual surgeon is a significant factor in outcomes after surgical procedures. The mortality study of Birkmeyer et al in 474,108 Medicare patients showed an inverse association between hospital volume and operative mortality largely mediated by surgeon volume, suggesting that patients could improve outcomes if they selected high volume procedure specific surgeons in high volume hospitals.4 In a prior study we found identical mortality rates after prostate cancer surgery for high or low volume surgeons or hospitals.7 However, radical prostatectomy has substantial risks of morbidity, notably anesthetic and postoperative complications, urinary complications within the first years (eg urethral strictures) and long-term urinary incontinence. Each of these outcomes has been directly related to surgical technique.7 Hu et al investigated the relation between hospital and surgeon volume for perioperative complications, length of stay and episodes of anastomotic strictures in a cohort of 2,292 contemporary Medicare patients.16 This study confirmed our previous report that high volume hospitals and surgeons had better patient outcomes. But after a detailed analysis of both volume measures they found that surgeon volume rather than hospital volume determined short-term outcome.16 Neither they nor we were able to analyze the effects of volume on cancer control or erectile function although we did show in a separate study that surgeon volume correlated with the rate of positive surgical margins.17
Thus, considerable data support the premise that hospital and surgeon volume affect outcomes of radical prostatectomy.7,13,16 Variation among surgeons in outcomes related to surgical volume, in cohorts of patients properly controlled for age, comorbidity and cancer stage, indicates variation in quality of care probably related to variations in surgical technique. High volume surgeons generally improve techniques by experience.3,18
Nonetheless we explored whether high volume surgeons performed equally well (within a range expected by chance). To our surprise we found substantial variation in outcomes among individual surgeons within the high volume groups (159 of 999 surgeons in this study). Not only did the rates of each category of complications vary among patients of individual surgeons far more than expected by chance (table 1, figs. 1 to 3), but those surgeons who performed poorly (or well) with respect to 1 category of complications performed significantly worse (or better) than expected in the other 2 categories as well.
CONCLUSIONS
Our study has important limitations. The SEER-Medicare database only includes patients 65 years old or older. The variation in outcomes of this population may be greater than in younger men. Outcomes were assessed by Medicare codes and the coding of patients may vary among individual surgeon practices. Since SEER-Medicare data are deidentified to preserve patient confidentiality, it is not possible to confirm the outcomes by direct review of patient medical records. We did not control for changes or adjustments in surgical technique during the 4 years of the study. Nevertheless, our data suggest that even high volume surgeons may need to monitor their procedures by collecting and analyzing data of their results. Examination of their films might improve their technique.19 In addition, using the hospital quality assurance structures should lead to improved outcomes among surgeons. This approach was remarkably effective in decreasing hospital length of stay in the early years of managed care.20
Footnotes
Supported by Grant P50-CA92629 SPORE in Prostate Cancer from the National Cancer Institute, and by the Leon Lowenstein Foundation.
REFERENCES
- 1.Halm EA, Lee C, Chassin MR. Is volume related to outcome in health care? A systematic review and methodologic critique of the literature. Ann Intern Med. 2002;137:511. doi: 10.7326/0003-4819-137-6-200209170-00012. [DOI] [PubMed] [Google Scholar]
- 2.Birkmeyer JD, Siewers AE, Finlayson EV, Stukel TA, Lucas FL, Batista I, et al. Hospital volume and surgical mortality in the United States. N Engl J Med. 2002;346:1128. doi: 10.1056/NEJMsa012337. [DOI] [PubMed] [Google Scholar]
- 3.Holm T, Johansson H, Cedermark B, Ekelund G, Rutqvist LE. Influence of hospital- and surgeon-related factors on outcome after treatment of rectal cancer with or without preoperative radiotherapy. Br J Surg. 1997;84:657. [PubMed] [Google Scholar]
- 4.Birkmeyer JD, Stukel TA, Siewers AE, Goodney PP, Wennberg DE, Lucas FL. Surgeon volume and operative mortality in the United States. N Engl J Med. 2003;349:2117. doi: 10.1056/NEJMsa035205. [DOI] [PubMed] [Google Scholar]
- 5.Jemal A, Murray T, Samuels A, Ghafoor A, Ward E, Thun MJ. Cancerstatistics, 2003. CA Cancer J Clin. 2003;53:5. doi: 10.3322/canjclin.53.1.5. [DOI] [PubMed] [Google Scholar]
- 6.Brandeis J, Pashos CL, Henning JM, Litwin MS. A nationwide charge comparison of the principal treatments for early stage prostate carcinoma. Cancer. 2000;89:1792. [PubMed] [Google Scholar]
- 7.Begg CB, Riedel ER, Bach PB, Kattan MW, Schrag D, Warren JL, et al. Variations in morbidity after radical prostatectomy. N Engl J Med. 2002;346:1138. doi: 10.1056/NEJMsa011788. [DOI] [PubMed] [Google Scholar]
- 8.Romano PS, Roos LL, Jollis JG. Adapting a clinical comorbidity index for use with ICD-9-CM administrative data: differing perspectives. J Clin Epidemiol. 1993;46:1075. doi: 10.1016/0895-4356(93)90103-8. [DOI] [PubMed] [Google Scholar]
- 9.Panageas KS, Schrag D, Riedel E, Bach PB, Begg CB. The effect of clustering of outcomes on the association of procedure volume and surgical outcomes. Ann Intern Med. 2003;139:658. doi: 10.7326/0003-4819-139-8-200310210-00009. [DOI] [PubMed] [Google Scholar]
- 10.Bach PB, Cramer LD, Schrag D, Downey RJ, Gelfand SE, Begg CB. The influence of hospital volume on survival after resection for lung cancer. N Engl J Med. 2001;345:181. doi: 10.1056/NEJM200107193450306. [DOI] [PubMed] [Google Scholar]
- 11.Dimick JB, Cattaneo SM, Lipsett PA, Pronovost PJ, Heitmiller RF. Hospital volume is related to clinical and economic outcomes of esophageal resection in Maryland. Ann Thorac Surg. 2001;72:334. doi: 10.1016/s0003-4975(01)02781-3. [DOI] [PubMed] [Google Scholar]
- 12.Hannan EL, Racz M, Ryan TJ, McCallister BD, Johnson LW, Arani DT, et al. Coronary angioplasty volume-outcome relationships for hospitals and cardiologists. JAMA. 1997;277:892. [PubMed] [Google Scholar]
- 13.Ellison LM, Heaney JA, Birkmeyer JD. The effect of hospital volume on mortality and resource use after radical prostatectomy. J Urol. 2000;163:867. [PubMed] [Google Scholar]
- 14.Meyerhardt JA, Catalano PJ, Schrag D, Ayanian JZ, Haller DG, Mayer RJ, et al. Association of hospital procedure volume and outcomes in patients with colon cancer at high risk for recurrence. Ann Intern Med. 2003;139:649. doi: 10.7326/0003-4819-139-8-200310210-00008. [DOI] [PubMed] [Google Scholar]
- 15.Bates EW, Berki SE, Homan RK, Lindenauer SM. The challenge of benchmarking: surgical volume and operative mortality in Veterans Administration Medical Centers. Best Pract Benchmarking Healthc. 1996;1:34. [PubMed] [Google Scholar]
- 16.Hu JC, Gold KF, Pashos CL, Mehta SS, Litwin MS. Role of surgeon volume in radical prostatectomy outcomes. J Clin Oncol. 2003;21:401. doi: 10.1200/JCO.2003.05.169. [DOI] [PubMed] [Google Scholar]
- 17.Eastham JA, Kattan MW, Riedel E, Begg CB, Wheeler TM, Gerigk C, et al. Variations among individual surgeons in the rate of positive surgical margins in radical prostatectomy specimens. J Urol. 2003;170:2292. doi: 10.1097/01.ju.0000091100.83725.51. [DOI] [PubMed] [Google Scholar]
- 18.Prystowsky JB, Bordage G, Feinglass JM. Patient outcomes for segmental colon resection according to surgeon’s training, certification, and experience. Surgery. 2002;132:663. doi: 10.1067/msy.2002.127550. [DOI] [PubMed] [Google Scholar]
- 19.Begg CB, Scardino PT. Taking stock of volume-outcome studies. J Clin Oncol. 2003;21:393. doi: 10.1200/JCO.2003.11.022. [DOI] [PubMed] [Google Scholar]
- 20.Leibman BD, Dillioglugil O, Abbas F, Tanli S, Kattan MW, Scardino PT. Impact of a clinical pathway for radical retropubic prostatectomy. Urology. 1998;52:94. doi: 10.1016/s0090-4295(98)00130-7. [DOI] [PubMed] [Google Scholar]