

Abstract
A new approach to characterize growing microorganisms in environmental samples based on labeling microbial DNA with H218O is described. To test if sufficient amounts of 18O could be incorporated into DNA to use water as a labeling substrate for stable isotope probing, Escherichia coli DNA was labeled by cultivating bacteria in Luria broth with H218O and labeled DNA was separated from [16O]DNA on a cesium chloride gradient. Soil samples were incubated with H218O for 6, 14, or 21 days, and isopycnic centrifugation of the soil DNA showed the formation of two bands after 6 days and three bands after 14 or 21 days, indicating that 18O can be used in the stable isotope probing of soil samples. DNA extracted from soil incubated for 21 days with H218O was fractionated after isopycnic centrifugation and DNA from 17 subsamples was used in terminal restriction fragment length polymorphism (TRFLP) analysis of bacterial 16S rRNA genes. The TRFLP patterns clustered into three groups that corresponded to the three DNA bands. The fraction of total fluorescence contributed by individual terminal restriction fragments (TRF) to a TRFLP pattern varied across the 17 subsamples so that a TRF was more prominent in only one of the three bands. Labeling soil DNA with H218O allows the identification of newly grown cells. In addition, cells that survive but do not divide during an incubation period can also be characterized with this new technique because their DNA remains without the label.
The identification of growing microbial populations in environmental samples is an important challenge in microbial ecology that may provide insight into the physiology of uncultured microorganisms or elucidate interactions between microorganisms in soil. Previous studies have used bromodeoxyuridine, a thymidine analog, to measure growth rates of specific microbial populations in environmental samples (1, 35). Though thymidine-based methods, such as the bromodeoxyuridine technique, have been widely used to investigate microbial growth (2, 26, 32, 33), many studies also acknowledge the shortcomings of this approach (9, 12, 26). Chief among them is that many microbial taxa do not incorporate exogenous thymidine analogs into their DNA (9, 26, 35).
The growth of microbial populations can be linked to specific metabolic processes through stable isotope probing (SIP) in which microbial DNA is labeled with stable isotopes by feeding microorganisms a labeled substrate (18, 27, 29, 37). The labeled DNA is subsequently separated from unlabeled DNA on a cesium chloride gradient formed in an ultracentrifuge. This method provides an unambiguous identification of the organisms that assimilate the labeled substrate. Substrates used in SIP are commonly small carbon compounds, such as methanol and phenol (6, 22), and only organisms that rapidly assimilate these small carbon compounds will become labeled. In many environmental samples, the majority of organisms obtain their carbon from complex molecules derived from decaying organic matter, and these organisms cannot be labeled with a single carbon source (25).
All microbial organisms are capable of importing water into their cells, and previous experiments have shown that during replication, DNA in Escherichia coli and T2 phage can be labeled with H218O (31). Further evidence for the labeling of microorganisms with H218O is provided by the observation that δ18O values of Bacillus subtilis cells and their endospores are linearly related to the δ18O value of the water used for the preparation of culture media (15). Labeling DNA with H218O instead of organic compounds provides important advantages because water cannot be used as an energy, carbon, or nitrogen source (20). As a consequence, the addition of the label is unlikely to influence microbial growth rates in soil directly and microbial communities can be exposed to the label for long periods of time because they are not exposed to abnormally high substrate concentrations. Finally, unlike pure organic compounds, water is commonly added to environmental samples in the form of precipitation or irrigation.
Though it remains unclear how 18O atoms are incorporated into DNA, one possible route is through 18O exchange between water and inorganic phosphate species or ATP. The exchange of oxygen between water and orthophosphate does not occur spontaneously at room temperature but is facilitated by enzymes such as pyrophosphatases (4). The F1 component of ATPase also can promote the exchange of oxygen from water to inorganic phosphate so that the γ-phosphate group of ATP will contain oxygen derived from water (10, 13). This ATP can catalyze the formation of glucose-6-phosphate from glucose which may serve as a precursor for ribose-5-phosphate and eventually AMP or GMP so that the phosphodiester backbone of DNA would contain oxygen atoms derived from water (30). Water is also used as a substrate in forming phosphoribosyl pyrophosphate from ribose-5-phosphate and in converting nucleoside diphosphate to deoxyribonucleoside triphosphate (24, 30). It is unlikely that the 18O label is associated with DNA through reversible water exchange reactions because when labeled E. coli cells were transferred to nonisotopic medium, the 18O isotope in DNA diluted at a rate similar to that of 32P (31).
If DNA labeled with 18O from water could be separated from unlabeled DNA along a cesium chloride gradient, it would be possible to identify all microorganisms that grow in an environmental sample, including cells that degrade complex carbon substrates and those involved in dissimilatory processes. The purpose of this study was to investigate if a sufficient amount of the label could be incorporated into the DNA of organisms in a forest soil sample so that labeled and unlabeled DNA could be separated on a cesium chloride gradient, thereby demonstrating that H218O can be used in stable isotope probing. Terminal restriction fragment length polymorphism (TRFLP) analysis (16, 34) of bacterial 16S rRNA genes in labeled and unlabeled DNA was performed to determine if the growing bacterial community differed from bacterial cells that did not divide.
MATERIALS AND METHODS
Labeling E. coli DNA with H218O.
E. coli strain DH5α-T1 (Invitrogen Corporation, Carlsbad, CA) was grown in 500 μl of Luria broth (LB) in Eppendorf tubes. Three types of LB were made with various concentrations of 95 atom% H218O (Sigma Aldrich, St. Louis, MO) so that the final concentrations of 18O in the LB were at the natural abundance level, 23.75 atom% H218O or 47.5 atom% H218O. The bacteria were grown overnight in a shaking incubator at 37°C. DNA was extracted the next day by using proteinase K and sodium dodecyl sulfate according to previously described protocols (21).
Labeling microbial DNA in soil with H218O.
The top 5 cm of soil at a sampling site in a Ponderosa pine forest near Flagstaff, AZ, was collected. The mean annual temperature in the forest, which grows at an elevation of approximately 2,300 m, is 10.2°C, and the mean amount of annual precipitation is 660 mm (7). The soil is classified as a Mollic Eutroboralf, contains 1.11% carbon and 0.07% nitrogen, and has a water-holding capacity of approximately 53%, and when the sample was collected it had a moisture content of 8.3%. One gram of the soil was incubated for 6, 14, or 21 days with 0.25 ml of 95 atom% H218O in a 15-ml Falcon tube (Becton Dickinson, Franklin Lakes, NJ). DNA was extracted from the soil samples by using a soil DNA extraction kit according to the instructions of the manufacturer (Mobio Inc., Carlsbad, CA).
Separating labeled DNA from unlabeled DNA on a cesium chloride gradient.
In order to separate labeled DNA from unlabeled DNA, 4.0 ml of cesium chloride (1.9 g/ml), 0.3 ml of gradient buffer (200 mM Tris [pH 8.0], 200 mM KCl, 2 mM EDTA), and 0.5 μl of 10,000× SYBR green I (Invitrogen Corporation, Carlsbad, CA) were added to an OptiSeal ultracentrifuge tube (Beckman Coulter, Fullerton, CA). In experiments with E. coli DNA, 5.6 μg of [16O]DNA was added to a first tube, 5.6 μg of [16O]DNA and 5.6 μg of DNA extracted from E. coli grown in 47.5 atom% H218O were added to a second tube, and 5.6 μg of [16O]DNA and 5.6 μg of DNA extracted from E. coli grown in 23.75 atom% H218O were added to a third ultracentrifuge tube. The tubes were loaded into a TLA-110 rotor and spun in an Optima MAX benchtop ultracentrifuge (Beckman Coulter, Fullerton, CA) at 70,000 rpm (204,000 × g at the average radius [rave]) and 18°C for 72 h. The centrifuge was allowed to come to a stop without the use of the brake. After centrifugation, the tubes were photographed while illuminated with UV light with a wavelength of 312 nm from a transilluminator (Fisher Scientific, Pittsburg, PA).
Soil DNA was separated on a cesium chloride gradient generated by combining 3.6 ml of cesium chloride (1.9 g/ml), 0.3 ml of gradient buffer, 0.5 μl of 10,000× SYBR green I, and the soil DNA extract. These samples were centrifuged at 65,000 rpm (176,000 × g at rave) or 55,000 rpm (126,000 × g at rave) at 18°C for 72 h.
Fractionation and quantification of DNA from ultracentrifuge tubes.
Approximately 4 ml of an ultracentrifuge's content was separated into 70 fractions of 6 drops each (approximately 60 μl) and collected in a 96-well plate by using a fraction recovery system (Beckman Coulter Inc., Palo Alto, CA). One hundred microliters of water was added to each sample together with 10 μg of glycogen and 400 μl of ethanol, and after the sample was stored in a −30°C freezer overnight, the DNA was precipitated by centrifugation at 15,700 × g for 30 min. The precipitate was washed with 70% ethanol and resuspended in 20 μl of water of which 5 μl was used for the quantification of the DNA concentration with a Quant-it PicoGreen double-stranded DNA assay according to the instructions of the manufacturer (Invitrogen Corporation, Carlsbad, CA). Most of the 70 fractions did not contain DNA, and only 20 fractions were used in subsequent analyses.
Terminal restriction fragment length polymorphism analysis of bacterial 16S rRNA genes.
TRFLP patterns of bacterial 16S rRNA genes were generated with PCRs using the following ingredients: 10 μM primer 27F modified with the fluorescent dye 6-carboxyfluorescein (5′-6-carboxyfluorescein-AGAGTTTGATCMTGGCTCAG-3′), 10 μM primer 519R (5′-CCGCGGCKGCTGGCAC-3′), 50 μM deoxynucleoside triphosphates, 1 μl of genomic DNA, 2.5 mM MgCl2, 2 U of Taq polymerase (Invitrogen Inc., Chatsworth, CA), and 1× Taq buffer. The PCR program to produce the patterns consisted of a 2-min hot start at 94°C and 30 cycles of 30 s at 94°C, 30 s at 53°C, and 1 min at 72°C, and the reaction was completed with a 7-min step at 72°C. Nucleotides, primers, salts, and enzymes were removed from the PCR product with a QIAGEN PCR cleanup kit (QIAGEN Inc., Valencia, CA). The purified product was digested with 5 U of MspI incubated at 37°C for 3 h. The digested DNA was precipitated with 2 volumes of ethanol and 10 μg of glycogen, and the precipitate was washed twice with 70% ethanol. Subsequently, the DNA was resuspended in formamide containing a rhodamine derivative-labeled DNA marker (MapMarker 1000; Bioventures Inc., Murfreesboro, TN) and the samples were analyzed on an ABI PRISM 3730XL DNA sequencer (Applied Biosystems, Foster City, CA). All samples were run in duplicate, and fragment peaks that were not present in both patterns were excluded from further analysis. TRFLP patterns that were within 0.6 bp of each other were binned for further statistical analysis.
Statistical analyses.
TRFLP patterns were compared by using relative fragment peak heights. A nonmetric multidimensional scaling analysis of TRFLP patterns was performed with PC-ORD4 software using the Sorensen distance measure (MjM Software, Gleneden Beach, OR). Cluster analysis was conducted with the same software using the Jaccard distance measure and Ward's method for linking groups.
RESULTS
Tubes with a combination of DNA from E. coli grown in broth made with H216O and DNA from E. coli grown in LB made with H218O showed two distinct bands after centrifugation (Fig. 1, tubes B and C), whereas a tube with only DNA from E. coli grown in [16O]LB contained just one band (Fig. 1, tube A). DNA extracted from E. coli grown in 47.5 atom% H218O was separated from [16O]DNA by approximately 0.35 cm, while DNA extracted from E. coli grown in 23.75 atom% H218O was separated from [16O]DNA by approximately 0.15 cm.
FIG. 1.
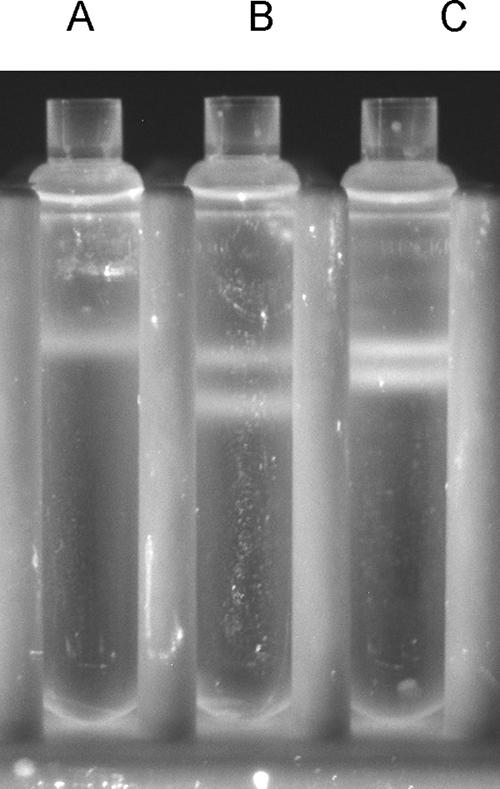
Separation of [18O]DNA from unlabeled DNA on a cesium chloride gradient. Tube A, DNA extracted from E. coli grown in H216O; tube B, DNA extracted from E. coli grown in H216O (top band) and DNA extracted from E. coli grown in 47.5 atom% H218O (bottom band); tube C, DNA extracted from E. coli grown in H216O (top band) and DNA extracted from E. coli grown in 23.75 atom% H218O (bottom band).
In a time series experiment, two bands became clearly visible after the isopycnic centrifugation of DNA extracted from soil that had been incubated with H218O for 6 days (Fig. 2, tubes B). Tubes with DNA extracted from soil incubated for 21 days with H218O showed three separate bands (Fig. 2, tubes C). As a control, soil samples were incubated for 6 days (Fig. 2, tubes D) and 21 days (Fig. 2, tubes E) with H216O. After the centrifugation of DNA extracted from these soil samples, centrifuge tubes contained only one DNA band. Slight variations in centrifuge conditions likely explain why these DNA bands appeared higher in the cesium chloride gradient than the DNA bands in tubes A through C.
FIG. 2.

Time course of 18O labeling of DNA in soil. DNA was extracted from replicate samples of soil incubated with H218O for 0 days (tubes A), 6 days (tubes B), and 21 days (tubes C) and from replicate samples of soil incubated with H216O for 6 days (tubes D) and 21 days (tubes E).
In a second experiment, DNA extracted from soil incubated with H218O for 14 days was separated on a cesium chloride gradient and again three distinct bands appeared (Fig. 3, tubes B) whereas DNA from soil incubated with H216O appeared as one band on a cesium chloride gradient (Fig. 3, tube A). The three bands were separated further when the tubes were spun at 126,000 × g (Fig. 3, tubes D) instead of 176,000 × g; however, the bands also became more diffuse. Therefore, the experimenter can manipulate the g force to obtain either diffuse bands of DNA that are widely separated or tight bands of DNA that are closer together, but it is not possible to obtain tight DNA bands that are spaced far apart.
FIG. 3.

Impact of g force on separation of DNA extracted from soil incubated with H218O. Tube A, DNA extracted from soil incubated with H216O and centrifuged at 176,000 × g; tubes B, DNA extracted from three replicate samples of soil incubated with H218O and centrifuged at 176,000 × g; tube C, DNA extracted from soil incubated with H216O and centrifuged at 126,000 × g; tubes D, DNA extracted from two replicate samples of soil incubated with H218O and centrifuged at 126,000 × g.
After the contents of tubes A and C shown in Fig. 2 were fractionated, the DNA was cleaned up and concentrations were measured by using fluorescence with a PicoGreen dye (Fig. 4). These measurements show that most of the DNA taken from tubes A was concentrated in approximately 7 fractions whereas DNA extracted from tubes C was present in approximately 17 fractions (Fig. 4). Substantial amounts of DNA were present in the first fractions taken from tubes C but not in those from tubes A, indicating that the DNA in these fractions had a higher buoyant density due to the incorporation of 18O.
FIG. 4.

DNA contents in fractions, expressed as the percentage of total DNA taken from an individual centrifuge tube. DNA was extracted from soils incubated with H218O for 0 days (○) or 21 days (•). Fraction 1 was retrieved from the bottom of the tube, while fraction 20 was taken from the top.
A cluster analysis of TRFLP patterns generated from bacterial 16S rRNA genes taken from tubes C showed that the patterns could be separated into three broad clusters (Fig. 5). The first cluster contained TRFLP patterns generated from fractions 1 to 4 from tube C1 and fractions 2 to 5 from tube C2. The second cluster contained patterns from fractions 5 to 12 from tube C1 and fractions 6 to 11 from tube C2. The last cluster contained patterns from fractions 13 to 17 from tube C1 and 12 to 17 from tube C2. Nonmetric multidimensional scaling analysis, which unlike cluster analysis is an ordination technique, showed a similar pattern (Fig. 6). Again samples from the first four fractions clustered together, samples from the middle seven fractions clustered together, and samples from the top six fractions clustered together.
FIG. 5.

Cluster analysis of TRFLP patterns generated from fractions taken from tubes C described in the legend to Fig. 2. The first number in a sample's label describes the fraction, while the second number denotes the replicate. Fraction 1 was taken from the bottom of the tube, while fraction 17 originated from the top.
FIG. 6.

Nonmetric multidimensional scaling analysis of TRFLP patterns generated from subsamples taken from tubes C described in the legend to Fig. 2. □, fractions 1 to 4 from replicate 1 and fractions 2 to 5 from replicate 2; •, fractions 5 to 11 from replicate 1 and fractions 6 to 11 from replicate 2; ○, fractions 12 to 17 from both replicates.
The relative peak height of terminal fragments (TRF) changed gradually from one fraction to the next so that all fragments were most prominent in either the top, middle, or bottom set of fractions (Fig. 7 and 8). For instance, a TRF with a length of 159 bp was more abundant in fractions 12 to 17 than in fractions 1 to 11. In contrast, a fragment that was 146 bp long was more dominant in fractions 6 to 11 than in fractions 1 to 5 or 12 to 17. Another major TRF with a size of 491 bp was more abundant in fractions 2 to 6 than in fractions 7 to 17.
FIG. 7.

Fraction of fluorescence contributed by an individual terminal restriction fragment to the total fluorescence of the entire TRFLP pattern. Terminal fragments had sizes of 146 bp (•), 159 bp (□), and 491 bp (○).
FIG. 8.

Soil bacterial community composition as revealed by TRFLP patterns generated from DNA extracted from soils incubated with H218O for 21 days (tubes C described in the legend to Fig. 2). The average peak size of duplicates of each terminal restriction fragment is expressed as a percentage of the total fluorescence in the entire TRFLP pattern. Fraction 1 was retrieved from the bottom of the tube, while fraction 17 was taken from the top.
DISCUSSION
Sufficient 18O from water was incorporated into the DNA of E. coli or microorganisms in the soil to separate labeled DNA from unlabeled DNA on a cesium chloride gradient (Fig. 1, 2, and 3). Because new DNA was synthesized solely during cell division (20), only DNA of newly formed cells was labeled with 18O so that this new experimental technique allowed the separation of DNA of newly grown cells from that of merely surviving cells.
Oxygen stable isotopes are effective labels to use in stable isotope probing because the incorporation of 18O causes a large increase in the molecular weight and buoyancy of DNA. Five oxygen atoms are present per nucleotide in the sugar backbone, while there are zero, one, one, and two oxygen atoms in adenine, guanine, cytosine, and thymine bases, respectively. Though more carbon and hydrogen atoms are present in DNA, more neutrons can be added to DNA by labeling with 18O than by labeling with the 15N or 13C isotope because 18O contains two extra neutrons while 15N and 13C have only one extra neutron relative to their light stable isotopes (28).
Many important questions regarding the use of H218O in stable isotope probing remain to be answered. These include why three separate DNA bands appeared after soil had been incubated with H218O for long periods of time. It may be that some microorganisms obtained 18O only through water while others incorporated 18O into their DNA through water and their carbon source. Studies of 18O contents in plants and animals show that 18O in biomasses can be derived from both water and the carbon source (3, 5, 14). If this hypothesis is correct, the top band represented organisms that survived the incubation but did not grow. The middle band contained DNA from organisms that fed on unlabeled substrates but did grow, and the bottom band was generated by predators and decomposers. Alternatively, the three bands may be a product of semiconservative DNA replication (23). In this scenario, the top band would consist of [16O]DNA; the middle band would include one strand of [16O]DNA and a second strand of newly synthesized, 18O-containing DNA; and the bottom band would consist of DNA in which both strands were labeled with 18O. In either of the two scenarios, the formation of the middle band should occur before the third band appears. Other important questions remain, including the extent to which environmental DNA can be labeled with H218O, the evenness of the label within DNA, and the impact of metabolic activity on the degree of label incorporation into DNA.
The characterization of bacterial 16S rRNA genes in fractions taken from soil incubated for 21 days with H218O showed that TRFLP patterns could be divided into three clusters, indicating that the three DNA bands were retrieved separately from the centrifuge tube (Fig. 5 and 6). TRFLP analysis also showed that bacterial populations were not equally distributed among the three DNA bands but that populations appeared to be more abundant in one of the three bands (Fig. 7 and 8). This observation does not offer insight into which of the two aforementioned hypotheses is correct. For instance, populations represented by the TRF with a size of 146 bp may have been slow growers so that a majority of the cells divided once and contained only one strand of labeled DNA or these populations may have fed predominantly on unlabeled substrates. Similarly, populations with a TRF of 491 bp may have been fast growers so that both DNA strands were labeled or, alternatively, they may have been organisms that assimilated substrates derived from organisms labeled in the initial stages of the incubation. Further experimentation, including a test to determine whether RNA extracted from soil (19, 22) incubated with H218O can also form three bands after isopycnic centrifugation, will be needed to reject one of the hypotheses.
Unlike most carbon or nitrogen substrates, water does not directly select for organisms with specific metabolic pathways; however, an increase in the moisture content can impact gas fluxes and nutrient diffusion in soil, which may alter microbial community structure (17, 25). One hundred percent fluctuations in moisture content, as would be required to achieve 47.5 atom% H218O in an environmental sample, may prevent the study of some important microbial communities in arid environments that are easily perturbed by changes in moisture. It also unclear how the desiccation of cells impacts H218O uptake and, consequently, the degree to which a cell's DNA becomes labeled. Therefore, the new technique may be best suited to studying the impact of water on microbial growth in soil. Moisture fluctuations commonly occur in soils, such as the one from the Ponderosa pine forest used in this study, during drying and rewetting cycles. The frequency of drying and rewetting cycles is thought to have a strong impact on microbial carbon and nitrogen dynamics (8), and with this new technique it is possible to link the growth of specific microbial populations in soil with nutrient cycling processes. Another important area of research that may be advanced by H218O-based SIP involves the impact of changes in precipitation due to global climate change on microbial communities in soil. Climate change models indicate that global precipitation will increase (36), and by adding H218O to soils it will be possible to determine how increased precipitation will affect growth rates of specific microbial populations in soil.
In summary, this study has shown that it is feasible to label DNA in bacterial cultures and in soil with H218O. The labeled DNA can be separated from unlabeled DNA on a cesium chloride gradient, indicating that H218O can be used in stable isotope probing to characterize newly grown cells and microorganisms that have not grown but have survived during incubation.
Acknowledgments
This research was funded by National Science Foundation grant DEB-0416223 and Department of Energy grant DE-FG02-04ER63883.
The manuscript was substantially improved by the helpful comments of two anonymous reviewers.
Footnotes
Published ahead of print on 23 February 2007.
REFERENCES
- 1.Borneman, J. 1999. Culture-independent identification of microorganisms that respond to specified stimuli. Appl. Environ. Microbiol. 65:3398-3400. [DOI] [PMC free article] [PubMed] [Google Scholar]
- 2.Brock, T. D. 1967. Bacterial growth rate in the sea: direct analysis by thymidine autoradiography. Science 155:81-83. [DOI] [PubMed] [Google Scholar]
- 3.Bryant, J. D., and P. N. Froelich. 1995. A model of oxygen isotope fractionation in body water of large mammals. Geochim. Cosmochim. Acta 59:4523-4537. [Google Scholar]
- 4.Cohn, M., and A. Hu. 1978. Isotopic (18O) shift in 31P nuclear magnetic resonance applied to a study of enzyme-catalyzed phosphate-phosphate exchange and phosphate (oxygen)-water exchange reactions. Proc. Natl. Acad. Sci. USA 75:200-203. [DOI] [PMC free article] [PubMed] [Google Scholar]
- 5.Cooper, L. W., and M. J. DeNiro. 1989. Oxygen-18 content of atmospheric oxygen does not affect the oxygen isotope relationship between environmental water and cellulose in a submerged aquatic plant, Egeria densa Planch. Plant Physiol. 91:536-541. [DOI] [PMC free article] [PubMed] [Google Scholar]
- 6.DeRito, C. M., G. M. Pumphrey, and E. L. Madsen. 2005. Use of field-based stable isotope probing to identify adapted populations and track carbon flow through a phenol-degrading soil microbial community. Appl. Environ. Microbiol. 71:7858-7865. [DOI] [PMC free article] [PubMed] [Google Scholar]
- 7.Dijkstra, P., O. Menyailo, E. Schwartz, S. C. Hart, and B. A. Hungate. 2006. 13C and 15N natural abundance of the soil microbial biomass. Soil Biol. Biochem. 38:3257-3266. [Google Scholar]
- 8.Fierer, N., and J. Schimel. 2002. Effect of drying-rewetting frequency on soil carbon and nitrogen transformations. Soil Biol. Biochem. 34:777-787. [Google Scholar]
- 9.Findlay, S. E. G., J. L. Meyer, and R. T. Edwards. 1984. Measuring bacterial production via rate of incorporation of [3H]thymidine into DNA. J. Microbiol. Methods 2:57-72. [Google Scholar]
- 10.Hackney, D. D., G. Rosen, and P. D. Boyer. 1979. Subunit interaction during catalysis: alternating site cooperativity in photophosphorylation shown by substrate modulation of [18O]ATP species formation. Proc. Natl. Acad. Sci. USA 76:3646-3650. [DOI] [PMC free article] [PubMed] [Google Scholar]
- 11.Reference deleted.
- 12.Jeffrey, W. H., and J. H. Paul. 1990. Thymidine uptake, thymidine incorporation, and thymidine kinase activity in marine bacterium isolates. Appl. Environ. Microbiol. 56:1367-1372. [DOI] [PMC free article] [PubMed] [Google Scholar]
- 13.Kasho, V. N., and P. D. Boyer. 1989. Vacuolar ATPases, like F1, F0-ATPases show a strong dependence of the reaction velocity on the binding of more than one ATP per enzyme. Proc. Natl. Acad. Sci. USA 86:8708-8711. [DOI] [PMC free article] [PubMed] [Google Scholar]
- 14.Kohn, M. J. 1996. Predicting animal δ18O: accounting for diet and physiological adaptation. Geochim. Cosmochim. Acta 60:4811-4829. [Google Scholar]
- 15.Kreuzer-Martin, H. W., M. J. Lott, J. Dorigan, and J. R. Ehleringer. 2003. Microbe forensics: oxygen and hydrogen stable isotope ratios in Bacillus subtilis cells and spores. Proc. Natl. Acad. Sci. USA 100:815-819. [DOI] [PMC free article] [PubMed] [Google Scholar]
- 16.Liu, W.-T., T. L. Marsh, H. Cheng, and L. J. Forney. 1997. Characterization of microbial diversity by determining terminal restriction fragment length polymorphisms of genes encoding 16S rRNA. Appl. Environ. Microbiol. 63:4516-4522. [DOI] [PMC free article] [PubMed] [Google Scholar]
- 17.Lüdemann, H., I. Arth, and W. Liesack. 2000. Spatial changes in the bacterial community structure along a vertical oxygen gradient in flooded paddy soil cores. Appl. Environ. Microbiol. 66:754-762. [DOI] [PMC free article] [PubMed] [Google Scholar]
- 18.Lueders, T., B. Pommerenke, and M. W. Friedrich. 2004. Stable-isotope probing of microorganisms thriving at thermodynamic limits: syntrophic proprionate oxidation in flooded soil. Appl. Environ. Microbiol. 70:5778-5786. [DOI] [PMC free article] [PubMed] [Google Scholar]
- 19.MacGregor, B. J., V. Brüchert, S. Fleischer, and R. Amann. 2002. Isolation of small-subunit rRNA for stable isotopic characterization. Environ. Microbiol. 4:451-464. [DOI] [PubMed] [Google Scholar]
- 20.Madigan, M. T., J. M. Martinko, and J. Parker. 2005. Brock biology of microorganisms, 11th ed. Prentice Hall, Inc., Upper Saddle River, NJ.
- 21.Maloy, S. R. 1990. Experimental techniques in bacterial genetics. Jones and Bartlet, Boston, MA.
- 22.Manefield, M., A. S. Whiteley, R. I. Griffiths, and M. J. Bailey. 2002. RNA stable isotope probing, a novel means of linking microbial community function to phylogeny. Appl. Environ. Microbiol. 68:5367-5373. [DOI] [PMC free article] [PubMed] [Google Scholar]
- 23.Meselson, M., and F. W. Stahl. 1958. The replication of DNA in Escherichia coli. Proc. Natl. Acad. Sci. USA 44:671-682. [DOI] [PMC free article] [PubMed] [Google Scholar]
- 24.Neese, R. A., S. Q. Siler, D. Cesar, F. Antelo, D. Lee, L. Misell, K. Patel, S. Tehrani, P. Shah, and M. K. Hellerstein. 2001. Advances in the stable isotope-mass spectrometric measurement of DNA synthesis and cell proliferation. Anal. Biochem. 298:189-195. [DOI] [PubMed] [Google Scholar]
- 25.Paul, E. A., and F. E. Clark. 1996. Soil microbiology and biochemistry. Academic Press, San Diego, CA.
- 26.Pollard, P. C., and D. J. W. Moriarty. 1984. Validity of the tritiated thymidine method for estimating bacterial growth rates: measurement of isotope dilution during DNA synthesis. Appl. Environ. Microbiol. 48:1076-1083. [DOI] [PMC free article] [PubMed] [Google Scholar]
- 27.Radajewski, S., P. Ineson, N. R. Parkeh, and J. C. Murrell. 2000. Stable-isotope probing as a tool in microbial ecology. Nature 403:646-649. [DOI] [PubMed] [Google Scholar]
- 28.Radajewski, S., I. R. McDonald, and J. C. Murrell. 2003. Stable-isotope probing of nucleic acids: a window to the function of uncultured microorganisms. Curr. Opin. Cell Biol. 14:296-302. [DOI] [PubMed] [Google Scholar]
- 29.Rangel-Castro, J. I., K. Killham, N. Ostle, G. W. Nicol, I. C. Anderson, C. M. Scrimgeour, P. Ineson, A. Meharg, and J. I. Prosser. 2005. Stable isotope probing analysis of the influence of liming on root exudate utilization by soil microorganisms. Environ. Microbiol. 7:828-838. [DOI] [PubMed] [Google Scholar]
- 30.Rawn, D. J. 1989. Biochemistry, 1st ed. Neil Patterson Publishers, Burlington, NC.
- 31.Richards, O. C., and P. D. Boyer. 1966. 18O labeling of deoxyribonucleic acid during synthesis and stability of label during replication. J. Mol. Biol. 19:109-119. [DOI] [PubMed] [Google Scholar]
- 32.Thomas, D. R., J. A. Richardson, and R. J. Dicker. 1974. The incorporation of tritiated thymidine into DNA as a measure of the activity of soil microorganisms. Soil Biol. Biochem. 6:293-296. [Google Scholar]
- 33.Thorn, P. M., and R. M. Ventullo. 1988. Measurement of bacterial growth rates in subsurface sediments using the incorporation of tritiated thymidine into DNA. Microb. Ecol. 16:3-16. [DOI] [PubMed] [Google Scholar]
- 34.Tokunaga, T. K., J. M. Wan, T. C. Hazen, E. Schwartz, M. K. Firestone, S. R. Sutton, M. Newville, K. R. Olson, A. Lanzirotti, and W. Rao. 2003. Distribution of chromium contamination and microbial activity in soil aggregates. J. Environ. Qual. 32:541-549. [DOI] [PubMed] [Google Scholar]
- 35.Urbach, E., K. L. Vergin, and S. J. Giovannoni. 1999. Immunochemical detection and isolation of DNA from metabolically active bacteria. Appl. Environ. Microbiol. 65:1207-1213. [DOI] [PMC free article] [PubMed] [Google Scholar]
- 36.Watson, R. T., and the Core Writing Team (ed.). 2001. Climate change 2001: synthesis report, stand-alone ed., p. 184. IPCC, Geneva, Switzerland.
- 37.Whitby, C., M. Bailey, A. Whiteley, J. C. Murrell, K. Killham, J. Prosser, and H. Lappin-Scott. 2005. Stable isotope probing links taxonomy with function in microbial communities. ASM News 71:169-173. [Google Scholar]