

Abstract
Two amoebae were presented with six bacterial prey at a range of concentrations, and the growth parameters of the amoebae were deduced. All but one bacterium (Synechococcus) resulted in a positive growth response, but the gram-positive bacterium Staphylococcus aureus proved to be difficult to digest and the heavily pigmented bacterium Klebsiella ozaenae induced unusual amoebic behavior prior to ingestion.
Protozoa are the major predators in microbial food webs (2), but the effects of different groups vary depending on the specific habitat. In biofilms, amoebae are considered more important than flagellates and ciliates due to their obligatory surface-associated lifestyle (20), but quantitative studies of amoeba-bacterium interactions are rare. Although in some studies workers have obtained amoebic growth parameters (3, 7, 17), in very few studies have workers examined the effect of bacterial prey type (28) or concentration (4) on amoebic growth. In this study we addressed this paucity of information by examining the interaction between two amoebae and six bacterial prey at different concentrations.
MATERIALS AND METHODS
Suspensions of two 6-day-old amoebae, Acanthamoeba castellanii strain CCAP 1501/1A and Hartmannella vermiformis strain CCAP 1534/7A (Culture Collection of Algae and Protozoa [CCAP]), were prepared as described by Pickup et al. (21). Escherichia coli K-12 strain No 10214 (CCAP, United Kingdom), Pseudomonas aeruginosa SG 81 (H.-C. Fleming, Gerhard Mercator University, Germany), Klebsiella aerogenes NCTC 9528 (National Collection of Type Cultures), Klebsiella ozaenae (J. English, University, Lancaster, United Kingdom), and Staphylococcus aureus NCTC 6571 were grown on nutrient agar (Lab M; International Diagnostics Group, Bury, United Kingdom) at 25°C for 1 day and then suspended in Amoeba Saline (AS; CCAP) (19a). Synechococcus sp. strain No 8 (K. Harper, Lancaster University, Lancaster, United Kingdom) was grown in BG11 (27) for 14 days at 23°C with a daily cycle consisting of 16 h of light and 8 h of darkness and then centrifuged at 2,504 × g for 10 min. Prey suspensions were sonicated for 10 min before use, and cell concentrations were determined by 4′,6′-diamidino-2-phenylindole (DAPI) staining and epifluorescence microscopy (22).
AS agarose plates (1.5%, wt/vol) were prepared as described by Pickup et al. (21). Each amoeba was presented with six bacteria on the agar surface at the following concentrations: S. aureus, 0, 1 × 10³, 1 × 10⁴, 5 × 10⁴, 1 × 10⁵, and 5 × 10⁵ cells cm−2; and other bacteria, 0, 1 × 10⁵, 1 × 10⁶, 5 × 10⁶, 1 × 10⁷, and 5 × 10⁷ cells cm−2. For each combination, the amoeba and the bacterium were coinoculated into 2 ml AS and then poured onto the agar surface. Once the preparations were dry, three 1-cm2 areas having a confluent bacterial lawn and five amoeba cells were excised and placed onto 10 μl of sterile distilled water in a Sedgwick Rafter counting chamber. Triplicate controls consisting of each bacterium alone at each concentration and each amoeba alone were prepared. The chambers were incubated at 20°C. Agar cubes were examined daily by light microscopy to determine the concentration of amoebae (cells cm−2). At the beginning and end of the experiment, the agar surfaces of test and bacterial control cubes were fixed in glutaraldehyde (final concentration, 0.4% [vol/vol]). Surfaces were scraped to remove adherent cells and place them in suspension. Bacterial concentrations (cells cm−2) were determined by epifluorescence microscopy.
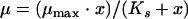
Analyses were performed using SPSS statistics (SPSS Inc., Illinois), SigmaPlot version 5 (SPSS Inc., Illinois), or Excel (Microsoft, Redmond, WA). Amoeba specific growth rates at each prey concentration were determined by linear regression analysis of ln(amoeba cells cm−2) against time (h). The responses of each amoeba to the prey concentrations were fitted to a hyperbolic function (equation 1) (19):
 |
(1) |
where μ is the specific growth rate (h−1), x is the initial bacterial concentration (cells cm−2), μmax is the maximum specific growth rate (h−1), and Ks is the half-saturation constant (cells cm−2). In the case of nonzero intercepts the equation was modified to include negative growth rates (equation 2) (14):
 |
(2) |
where x′ is the threshold concentration (cells cm−2) at which the specific growth rate is 0 and K = Ks + x′ (5). The parameters μmax and Ks were compared to determine significant differences (t tests with Bonferroni's correction), using means and standard errors provided by Sigmaplot and a pooled standard error (the square root of the sum of the standard errors arising from the nonlinear curve fit) (26). The yield of amoebae (number of amoebae per prey cell) was determined by dividing the concentration of amoebae produced by the concentration of bacteria consumed. The maximum ingestion rate (number of prey cells per amoeba cell per h) was determined by dividing μmax by 0.5Y, where Y is the yield (10−3 amoeba per prey cell) as described by Fenchel (9).
RESULTS AND DISCUSSION
The sizes of both amoeba populations increased in the presence of five of the six bacterial strains. All concentrations of Synechococcus sp. induced encystment of the amoebae even though prey cells were clearly visible within the food vacuoles. Previous studies showed that protozoa ingest Synechococcus (8) but digest this bacterium inefficiently (6), possibly because the cell wall is two to five times thicker than the cell walls of other gram-negative bacteria (10), a feature which influences digestibility (11).
For the five remaining prey species, the highest μmax values were recorded with K. aerogenes and E. coli K-12 (Fig. 1), consistent with the results of Weekers et al. (28). Both amoebae exhibited significantly lower affinity for K. aerogenes (P < 0.025) (Table 1), which may have been due to the extracellular polysaccharide capsule of Klebsiella species in general, which enhances resistance to phagocytosis and/or digestion in mammalian white blood cells (1). Our data do not suggest that K. aerogenes resisted ingestion but do suggest that the efficiencies of digestion of this prey by the two amoebae were different; the yield of H. vermiformis was highest with this bacterium (Table 1).
FIG. 1.

Responses of the specific growth rates to the initial bacterial concentrations for H. vermiformis and A. castellanii feeding on E. coli (a and b), K. aerogenes (c and d), P. aeruginosa (e and f), S. aureus (g and h), and K. ozaenae (i and j) at 20°C on AS agar surfaces.
TABLE 1.
μmax, Ks, yield, and calculated maximum uptake rate for H. vermiformis and A. castellanii feeding on five species of bacteria on AS agar at 20°C
| Bacterial prey |
H. vermiformis
|
A. castellanii
|
||||||
|---|---|---|---|---|---|---|---|---|
| μmax (h−1) | Ks (106 bacteria cm−2) | Yield (10−3 amoeba cell prey cell−1) | Maximum uptake rate (prey cells amoeba cell−1 h−1) | μmax (h−1) | Ks (106 bacteria cm−2) | Yield (10−3 amoeba cell prey cell−1) | Maximum uptake rate (prey cells amoeba cell−1 h−1) | |
| E. coli K-12 | 0.064 (0.004)a | 0.989 (0.297) | 0.230 (0.216) | 554 | 0.0626 (0.005) | 0.8631 (0.356) | 0.413 (0.391) | 30 |
| K. aerogenes | 0.069 (0.003) | 3.238 (0.489) | 0.520 (0.030) | 265 | 0.0633 (0.004) | 2.921 (0.547) | 0.022 (0.017) | 575 |
| P. aeruginosa | 0.056 (0.004) | 0.494 (0.194) | 0.035 (0.015) | 318 | 0.0509 (0.003) | 0.253 (0.761) | 0.033 (0.011) | 308 |
| S. aureus | 0.038 (0.003) | 0.023 (0.009) | 0.006 (0.002) | 1,532 | 0.0389 (0.003) | 0.026 (0.009) | 0.007 (0.004) | 1,060 |
| K. ozaenae | 0.037 (0.003) | 3.290 (0.259) | 0.008 (0.004) | 925 | 0.0259 (0.002) | 5.999 (1.920) | 0.005 (0.003) | 1,036 |
The values in parentheses are standard errors of the means.
The μmax values with P. aeruginosa were significantly lower than the μmax values with E. coli or K. aerogenes (P < 0.05) (Table 1), but both amoebae exhibited a higher affinity for P. aeruginosa (Table 1). In some studies, amoebae have fed effectively on P. aeruginosa (24, 29), but in other studies this species has proved to be toxic (12, 23, 25). In the present study, P. aeruginosa, although not toxic, did restrict the movement of amoebae after 52 h, when the bacterial population formed microcolonies, an antigrazing response (13, 16, 29) which slows the ingestion process.
The μmax values with S. aureus were significantly lower than those with E. coli, K. aerogenes, and P. aeruginosa (P < 0.01), and the Ks values were nearly 2 orders of magnitude lower (Table 1). The high affinity for S. aureus (Table 1) could have been due to its smaller size, which facilitates easier ingestion, but the lower yield may have been due to the fact that gram-positive bacteria are generally more difficult to digest (11) or the fact that carotenoids protect this bacterium from oxidation (15). Fecal pellets containing intact S. aureus cells were evident in amoeba trails, suggesting that some cells avoided digestion.
K. ozaenae yielded the lowest μmax values and highest Ks values of the five palatable bacteria. Both amoebae required a threshold density of ca. 1 × 10⁶ K. ozaenae cells cm−2, below which the specific growth rates were negative. Also, instead of forming characteristic cysts, trophozoites lysed or exhibited unusual behavior. H. vermiformis remained stationary until 26 h into the experiment, after which trophozoites began to move and feed normally. The response of A. castellanii was more dramatic. At a low prey concentration the trophozoites moved off the lawn, while at higher concentrations they either moved in erratic circles or attempted to burrow into the agar. However, after an initial lag period of 30 h, this amoeba consumed the K. ozaenae cells and had positive specific growth rates. The reason why K. ozaenae induced such amoebic behavior is currently unclear. There have been no reports that K. ozaenae is toxic to amoebae, but in another study the workers found that the pigmented bacterium Serratia marcescens was “toxic” to H. vermiformis for 3 days, after which the bacterium was ingested (12).
In conclusion, the two species of amoebae exhibited similar growth trends with the six bacterial prey, even though individual parameter values differed. Both species exhibited μmax values with the palatable prey at concentrations greater than 1 × 10⁷ prey cells cm−2, which are concentrations common in natural biofilms (18), suggesting that amoebae are significant grazers of bacteria in these communities.
Acknowledgments
We thank Dave Montagnes for his advice regarding the statistical analysis of the data and anonymous reviewers for their useful comments on the manuscript.
Footnotes
Published ahead of print on 9 February 2007.
REFERENCES
- 1.Allen, P. M., D. Fisher, J. R. Saunders, and C. A. Hart. 1987. The role of capsular polysaccharide K21b of Klebsiella and of the structurally related colanic-acid polysaccharide of Escherichia coli in resistance to phagocytosis and serum killing. J. Med. Microbiol. 24:363-370. [DOI] [PubMed] [Google Scholar]
- 2.Azam, F., T. Fenchel, J. G. Field, J. S. Gray, L. A. Meyer-Reil, and F. Thingstad. 1983. The ecological role of water-column microbes in the sea. Mar. Ecol. Prog. Ser. 10:257-263. [Google Scholar]
- 3.Baldock, B. M., and J. H. Baker. 1980. The occurrence and growth rates of Polychaos fasciculatum, a re-discovered amoeba. Protistology 16:79-83. [Google Scholar]
- 4.Baldock, B. M., J. H. Baker, and M. A. Sleigh. 1980. Laboratory growth rates of six species of freshwater Gymnamoeba. Oecologia 47:156-159. [DOI] [PubMed] [Google Scholar]
- 5.Berges, J. A., D. J. S. Montagnes, C. L. Hurd, and P. J. Harrison. 1994. Fitting ecological and physiological data to rectangular hyperbolae: a comparison of methods using Monte Carlo simulations. Mar. Ecol. Prog. Ser. 114:175-183. [Google Scholar]
- 6.Boenigk, J., C. Matz, K. Jürgens, and H. Arndt. 2001. The influence of preculture conditions and food quality on the ingestion and digestion process of three species of heterotrophic nanoflagellates. Microb. Ecol. 42:168-176. [DOI] [PubMed] [Google Scholar]
- 7.Butler, H., and A. Rogerson. 1996. Growth potential, production efficiency and annual production of marine benthic naked amoebae (Gymnamoeba) inhabiting the Clyde Sea area, Scotland. Aquat. Microb. Ecol. 10:123-129. [Google Scholar]
- 8.Callieri, C., S. M. Karjalainen, and S. Passoni. 2002. Grazing by ciliates and heterotrophic nanoflagellates on picocyanobacteria in Lago Maggiore, Italy. J. Plankton Res. 24:785-796. [Google Scholar]
- 9.Fenchel, T. 1982. Ecology of heterotrophic microflagellates. II. Bioenergetics and growth. Mar. Ecol. Prog. Ser. 8:225-231. [Google Scholar]
- 10.Golecki, J. R. 1977. Studies on ultrastructure and composition of cell walls of the cyanobacterium Anacystis nidulans. Arch. Microbiol. 114:35-41. [DOI] [PubMed] [Google Scholar]
- 11.González, J. M., J. Iriberri, L. Egea, and I. Barcina. 1990. Differential rates of digestion of bacteria by freshwater and marine phagotrophic protozoa. Appl. Environ. Microbiol. 56:1851-1857. [DOI] [PMC free article] [PubMed] [Google Scholar]
- 12.Groscop, J. A., and M. M. Brent. 1964. The effects of selected strains of pigmented microorganisms on small free-living amoebae. Can. J. Microbiol. 10:584-597. [DOI] [PubMed] [Google Scholar]
- 13.Hahn, M. W., E. R. B. Moore, and M. G. Höfle. 2000. Role of microcolony formation in the protistan grazing defence of the aquatic bacterium Pseudomonas sp. MWH1. Microb. Ecol. 39:175-185. [DOI] [PubMed] [Google Scholar]
- 14.Kimmance, S., D. Atkinson, and D. J. S. Montagnes. 2006. Do temperature-food interactions matter? Responses of production and its components in the model heterotrophic flagellate Oxyrrhis marina. Aquat. Microb. Ecol. 42:63-73. [Google Scholar]
- 15.Liu, G. Y., A. Essex, J. T. Buchanan, V. Datta, H. M. Hoffman, J. F. Bastian, J. Fierer, and V. Nizet. 2005. Staphylococcus aureus golden pigment impairs neutrophil killing and promotes virulence through its antioxidant activity. J. Exp. Med. 202:209-215. [DOI] [PMC free article] [PubMed] [Google Scholar]
- 16.Matz, C., T. Bergfeld, S. A. Rice, and S. Kjelleberg. 2004. Microcolonies, quorum sensing and cytotoxicity determine the survival of Pseudomonas aeruginosa biofilms exposed to protozoan grazing. Environ. Microbiol. 6:218-226. [DOI] [PubMed] [Google Scholar]
- 17.Mayes, D. F., A. Rogerson, H. Marchant, and J. Laybourn-Parry. 1997. Growth and consumption rates of bactivorous Antarctic naked marine amoebae. Mar. Ecol. Prog. Ser. 160:101-108. [Google Scholar]
- 18.McBain, A. J., R. G. Bartolo, C. E. Catrenich, D. Charbonneau, R. G. Ledder, A. H. Rickard, S. A. Symmons, and P. Gilbert. 2003. Microbial characterization of biofilms in domestic drains and the establishment of stable biofilm microcosms. Appl. Environ. Microbiol. 69:177-185. [DOI] [PMC free article] [PubMed] [Google Scholar]
- 19.Monod, J. 1950. La technique de culture continue, théorie et application. Ann. Inst. Pasteur 79:390-410. [Google Scholar]
- 19a.Page, F. C. 1988. A new key to freshwater and soil gymnamoebae, with instructions for culture, p. 63, 95-96. Freshwater Biological Association, Ambleside, United Kingdom.
- 20.Parry, J. D. 2004. Protozoan grazing of freshwater biofilms. Adv. Appl. Microbiol. 54:167-196. [DOI] [PubMed] [Google Scholar]
- 21.Pickup, Z. L., R. Pickup, and J. D. Parry. 2007. A comparison of the growth and starvation responses of Acanthamoeba castellanii and Hartmannella vermiformis in the presence of suspended and attached Escherichia coli K12. FEMS Microbiol. Ecol. 59:556-563. [DOI] [PubMed] [Google Scholar]
- 22.Porter, K. G., and Y. S. Feig. 1980. The use of DAPI for identifying and counting aquatic microflora. Limnol. Oceanogr. 25:943-948. [Google Scholar]
- 23.Qureshi, M. N., A. A. Perez, R. M. Madayag, and E. J. Bottone. 1993. Inhibition of Acanthamoeba species by Pseudomonas aeruginosa: rationale for their selective exclusion in corneal ulcers and contact lens care systems. J. Clin. Microbiol. 31:1908-1910. [DOI] [PMC free article] [PubMed] [Google Scholar]
- 24.Rogerson, A., and J. Berger. 1981. Effect of crude oil and petroleum-degrading micro-organisms on the growth of freshwater and soil protozoa. J. Gen. Microbiol. 124:53-59. [Google Scholar]
- 25.Singh, R. N. 1945. The selection of bacterial food by soil amoebae and the toxic effects of bacterial pigments and other products on soil protozoa. Br. J. Exp. Pathol. 26:316-325. [Google Scholar]
- 26.Sokal, R. R., and F. J. Rohlf. 1995. Biometry, 3rd ed. W. H. Freeman and Company, New York, NY.
- 27.Stanier, R. Y., R. Kunisawa, M. Mandal, and G. Cohen-Bazire. 1971. Purification and properties of unicellular blue-green algae (order Chroococcales). Bacterial. Rev. 35:171-205. [DOI] [PMC free article] [PubMed] [Google Scholar]
- 28.Weekers, P. H. H., P. L. E. Bodelier, J. P. H. Wijen, and G. D. Vogels. 1993. Effects of grazing by the free-living soil amoebae Acanthamoeba castellanii, Acanthamoeba polyphaga, and Hartmannella vermiformis on various bacteria. Appl. Environ. Microbiol. 59:2317-2319. [DOI] [PMC free article] [PubMed] [Google Scholar]
- 29.Weitere, M., T. Bergfeld, S. A. Scott, C. Matz, and S. Kjelleberg. 2005. Grazing resistance of Pseudomonas aeruginosa biofilms depends on type of protective mechanism, developmental stage and protozoan feeding mode. Environ. Microbiol. 7:1593-1601. [DOI] [PubMed] [Google Scholar]