Abstract
Intact yeast cells loaded with 5- and-6-carboxyfluorescein were used to assess water transport. The results were similar to those previously reported for protoplasts assessed by using either fluorescence or light scattering, and the activation energies were 8.0 and 15.1 kcal mol−1 (33.4 and 63.2 kJ mol−1) for a strain overexpressing AQY1 aquaporin and a parental strain, respectively.
The physiological role of aquaporins in yeasts is still being debated and remains unclear (3, 7). The discovery that aquaporins enhance cellular tolerance for rapid freezing in Saccharomyces cerevisiae suggests their ecological and physiological relevance, which is reinforced by their observed conservation during evolution, since aquaporin genes have been found in 67% of the 33 species of eukaryotic microbes whose genomes have been sequenced (7). The aquaporin-encoding genes in S. cerevisiae (AQY1 and AQY2) contain inactivating mutations in most laboratory strains, and only AQY1 encodes a functional water channel in most natural isolates and industrial strains (2, 3). In strains with altered expression of these genes, a significant role for yeast aquaporins restricted to low temperatures has been found (5).
Determining the role of aquaporins in yeasts is a challenge, since their activity may affect important biotechnological functions though not essential for basic cellular processes. The success of such studies may depend on the introduction of new, simpler, noninvasive methodologies that respect the physiological state of the cells.
Light scattering stopped-flow methodologies have been used to measure osmotic water permeability (Pf) in several systems, including yeast protoplasts and vesicles (4, 5, 8, 10), but they were not successful when they were used with intact yeast cells (data not shown). With protoplasts, equivalent Pf values were obtained using two different stopped-flow techniques, light scattering and fluorescence (5).
In this work, we used the fluorescence self-quenching methodology with intact cells of strains with different levels of expression of AQY1 and assessed the parameters of water transport. The strains used were 10560-6B (MATα leu2::hisG trp1::hisG his3::hisG ura3-52), 10560-6B/pYX012 (KanMX) (= ANT29) (referred to below as the parental strain), and 10560-6B/pYX012 (KanMX AQY1-1) (= ANT27) (referred to below as the strain overexpressing AQY1) (6). Cells were grown in YPD medium (1% [wt/vol] peptone, 0.5% [wt/vol] yeast extract, 2% [wt/vol] glucose) with orbital shaking at 28°C, centrifuged, and resuspended in 1.2 M sorbitol.
For loading of the fluorophore we used the protocol described previously (5). Briefly, immediately before an osmotic challenge, nonenergized cells were preloaded for 10 min at 30°C with the membrane-permeable nonfluorescent precursor 5- and 6-carboxyfluorescein diacetate (CFDA) (concentration in isosmotic solution, 1 mM) that is cleaved intracellularly by nonspecific esterases and generates the impermeable fluorescent form. As the cells shrink or swell in response to osmotic changes, the concentration of the entrapped fluorophore increases or decreases, and there is a change in the fluorescence output (1); the concentration-dependent self-quenching properties of the fluorophore enable cell volume changes to be recorded as changes in fluorescence.
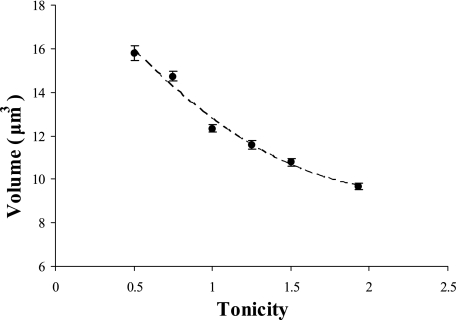
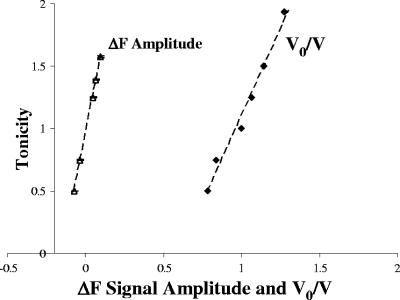
The relationship between fluorescence and cell volume was determined by evaluating the equilibrium volumes of cells loaded with CFDA using an epifluorescence microscope (Olympus BX51) equipped with a digital camera (Fig. 1). Cells were assumed to be spherical, and the diameter was calculated by determining the average of the maximum and minimum dimensions of each cell. Cells were exposed to different osmotic shocks on a microscope slide, and an average of six pictures with four to six cells in each picture were taken within 10 to 40 s. The osmotic shock experiments were performed in triplicate, resulting in a total of 90 measurements. A linear relationship between the inverse of the relative cell volume (initial volume [V0]/final volume [V∞]) and the tonicity of the osmotic shock (Λ) (defined as the ratio of the final osmolarity [(osmout)∞] to the initial osmolarity [(osmout)0] of the outside medium [Λ = (osmout)∞/(osmout)0] was obtained (Fig. 2).
FIG. 1.
Equilibrium volumes of intact cells loaded with CFDA and subjected to hypo- and hyperosmotic shocks, based on a spherical cell shape. The average diameter was calculated by using the maximum and minimum dimensions of each cell (n = 90 for each data point observed by epifluorescence).
FIG. 2.
Linear relationships between Λ and ΔF and between Λ and the inverse of the relative cell volume (V0/V). These relationships were used to calibrate the stopped-flow signals.
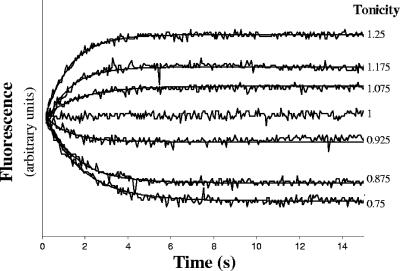
In the stopped-flow analysis (Hi-Tech Scientific PQ/SF-53) the cell suspensions were rapidly mixed with hypo- or hyperosmotic solutions to obtain different outwardly or inwardly directed gradients of solute. The time-dependent changes in fluorescence and the corresponding single exponential fits for the overexpressing AQY1 strain are shown in Fig. 3, and the linear dependence of Λ on the total signal fluorescence amplitude (ΔF) (ΔF = F∞ − F0, where F∞ the final signal fluorescence and is F0 is the initial signal fluorescence) is shown in Fig. 2. The rate constants (k) were used to estimate the Pf (Table 1) based on the linear relationship between Pf and k (9), as follows: Pf = k(V0/A)[1/Vw(osmout)∞], where Vw is the molar volume of water, V0/A is the initial volume-to-area ratio and (osmout)∞ is the final medium osmolarity. We observed that all the estimated Pf values at 23°C (296 K) are consistent with a mean ± standard deviation of 1.38 × 10⁻³ ± 0.18 × 10⁻³ cm s−1.
FIG. 3.
Fluorescence signals and the corresponding single exponential fits obtained for the overexpressing AQY1 strain loaded with CFDA subjected to hypo-, iso-, and hyperosmotic shocks at 23°C (296 K).
TABLE 1.
Pf values calculated from the rate constants obtained from the traces in Fig. 3
| Λ | Pf (mean ± SD) (103 cm s−1) |
|---|---|
| 0.75 | 1.48 ± 0.05 |
| 0.825 | 1.52 ± 0.11 |
| 0.925 | 1.39 ± 0.28 |
| 1.075 | 1.20 ± 0.19 |
| 1.175 | 1.40 ± 0.10 |
| 1.25 | 1.27 ± 0.10 |
| Mean | 1.38 ± 0.18 |
The traces in Fig. 3 were converted into relative volume changes using the following linear relationship: V0/V = m(F − F0) + 1, where V is the volume and m is (V0/V∞ − 1)/ΔF and was calculated from the linear relationships Λ versus V0/V and Λ versus ΔF shown in Fig. 2. The Pf values estimated from these calibrated curves were equivalent to the values shown in Table 1, and the average ± standard deviation was 1.62 × 10⁻³ ± 0.36 × 10⁻³ cm s−1. These results suggest that single exponential fits to the fluorescence stopped-flow traces can be used to estimate the Pf values for intact yeast cells using the linear relation Pf versus k as long as the values of V0/A and (osmout)∞ are known.
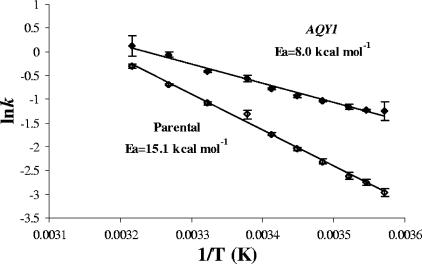
The presence of water channels facilitates water fluxes across the membrane and lowers the activation energy (Ea) for transport. The Ea values for the strain overexpressing AQY1 and the parental strain were 8.0 and 15.1 kcal mol−1 (33.4 and 63.2 kJ mol−1), respectively (Fig. 4). Considering that the parental strain represents only the lipid bilayer contribution, the Ea calculated for the channel pathway is 3.8 kcal mol−1 (15.9 kJ mol−1). These results are in agreement with the values obtained for protoplasts of the same strains (5).
FIG. 4.
Arrhenius plots for the parental strain and the overexpressing AQY1 strain loaded with CFDA and subjected to a hypoosmotic shock (Λ = 0.75; temperature range, 7°C [280 K] to 38°C [311 K]). The Ea values (15.1 and 8.0 kcal mol−1 [63.2 and 33.4 kJ mol−1]) were calculated for the parental strain and the strain overexpressing AQY1.
To the best of our knowledge, this is the first study in which the parameters of water transport in yeasts were assessed without removing the cell wall. Fluorescence self-quenching is a noninvasive methodology that can be used for assessment of water transport in intact yeast cells, making it possible to design experimental conditions in which different levels of membrane stress can be established and their effects on water channel regulation can be evaluated. These situations cannot be tested otherwise in protoplasts. Furthermore, the use of intact cells instead of protoplast preparations makes the water transport studies much simpler, increasing the possibility of biochemical characterization of aquaporins from foreign systems (plants) by heterologous expression in yeasts.
Acknowledgments
This work was supported by Fundação para a Ciência e Tecnologia grant POCTI/AGR/57403/2004.
Strains 10560-6B and 10560-6B/pYX012 were kindly provided by Patrick Van Dijck, Laboratory of Molecular Cell Biology, K.U. Leuven, Leuven, Belgium. The epifluorescence experiments were performed under the supervision of Paulo Costa Lemos, REQUIMTE, Portugal.
Footnotes
Published ahead of print on 2 February 2007.
REFERENCES
- 1.Chen, R. F., and J. R. Knutson. 1988. Mechanism of fluorescence concentration quenching of carboxyfluorescein in liposomes: energy transfer to nonfluorescent dimers. Anal. Biochem. 172:61-77. [DOI] [PubMed] [Google Scholar]
- 2.Laizé, V., F. Tacnet, P. Ripoche, and S. Hohmann. 2000. Polymorphism of Saccharomyces cerevisiae aquaporins. Yeast 16:897-903. [DOI] [PubMed] [Google Scholar]
- 3.Meyrial, V., V. Laize, R. Gobin, P. Ripoche, S. Hohmann, and F. Tacnet. 2001. Existence of a tightly regulated water channel in Saccharomyces cerevisiae. Eur. J. Biochem. 268:334-343. [DOI] [PubMed] [Google Scholar]
- 4.Soveral, G., R. I. Macey, and T. F. Moura. 1997. Water permeability of brush border membrane vesicles from kidney proximal tubule. J. Membr. Biol. 158:219-228. [DOI] [PubMed] [Google Scholar]
- 5.Soveral, G., A. Veiga, M. C. Loureiro-Dias, A. Tanghe, P. Van Dijck, and T. F. Moura. 2006. Water channels are important for osmotic adjustments of yeast cells at low temperature. Microbiology 152:1515-1521. [DOI] [PubMed] [Google Scholar]
- 6.Tanghe, A., P. Van Dijck, F. Dumortier, A. Teunissen, S. Hohmann, and J. M. Thevelein. 2002. Aquaporin expression correlates with freeze tolerance in baker's yeast, and overexpression improves freeze tolerance in industrial strains. Appl. Environ. Microbiol. 68:5981-5989. [DOI] [PMC free article] [PubMed] [Google Scholar]
- 7.Tanghe, A., P. Van Dijck, and J. M. Thevelein. 2006. Why do microorganisms have aquaporins? Trends Microbiol. 14:78-85. [DOI] [PubMed] [Google Scholar]
- 8.Terwilliger, T. C., and A. K. Solomon. 1981. Osmotic water permeability of human red cells. J. Gen. Physiol. 77:549-570. [DOI] [PMC free article] [PubMed] [Google Scholar]
- 9.van Heeswijk, M. P., and C. H. van Os. 1986. Osmotic water permeabilities of brush border and basolateral membrane vesicles from rat renal cortex and small intestine. J. Membr. Biol. 92:183-193. [DOI] [PubMed] [Google Scholar]
- 10.Verkman, A. S., A. N. van Hoek, T. Ma, A. Frigeri, W. R. Skach, A. Mitra, B. K. Tamarappoo, and J. Farinas. 1996. Water transport across mammalian cell membranes. Am. J. Physiol. 270:C12-C30. [DOI] [PubMed] [Google Scholar]


