

Abstract
Certain toxic elements support the metabolism of diverse prokaryotes by serving as respiratory electron acceptors for growth. Here, we demonstrate that two anaerobes previously shown to be capable of respiring oxyanions of selenium also achieve growth by reduction of either tellurate [Te(VI)] or tellurite [Te(IV)] to elemental tellurium [Te(0)]. This reduction achieves a sizeable stable-Te-isotopic fractionation (isotopic enrichment factor [ɛ] = −0.4 to −1.0 per ml per atomic mass unit) and results in the formation of unique crystalline Te(0) nanoarchitectures as end products. The Te(0) crystals occur internally within but mainly externally from the cells, and each microorganism forms a distinctly different structure. Those formed by Bacillus selenitireducens initially are nanorods (∼10-nm diameter by 200-nm length), which cluster together, forming larger (∼1,000-nm) rosettes composed of numerous individual shards (∼100-nm width by 1,000-nm length). In contrast, Sulfurospirillum barnesii forms extremely small, irregularly shaped nanospheres (diameter < 50 nm) that coalesce into larger composite aggregates. Energy-dispersive X-ray spectroscopy and selected area electron diffraction indicate that both biominerals are composed entirely of Te and are crystalline, while Raman spectroscopy confirms that they are in the elemental state. These Te biominerals have specific spectral signatures (UV-visible light, Raman) that also provide clues to their internal structures. The use of microorganisms to generate Te nanomaterials may be an alternative for bench-scale syntheses. Additionally, they may also generate products with unique properties unattainable by conventional physical/chemical methods.
Tellurium is a toxic metalloid present as a trace constituent (0.002 ppm) in the Earth's crust. It occurs in nature in four oxidation states: 6+, 4+, 0, and 2−. The first two form the partially soluble oxyanions tellurate [TeO42−, or Te(VI)] and tellurite [TeO32−, or Te(IV)], and with respect to the latter two, the occurrence of native tellurium [Te(0)] is rare, while metal tellurides represent the most common form found in minerals. Nano-scaled tellurium compounds, such as CdTe, have significant potential as solar-cell materials and are currently under intensive research scrutiny (38). Although some marine ferromanganese crusts are enriched in their Te content (11), the concentrating mechanism from seawater is not known. Tellurium oxyanions were once examined as potential antibacterial agents (8), but more recently, the resistance of diverse bacteria to Te(VI) and Te(IV) has been studied (e.g., references 1, 2, 23, and 24). The mechanisms of resistance to Te oxyanions, most commonly Te(IV), involve their physical removal from the cell's immediate aqueous environment, a response similar to that for toxic selenium oxyanions. This can be achieved by either volatilization to form dimethyl telluride (2) or reductive precipitation to form insoluble Te(0). The precipitated Te(0) can occur outside (19) or, more commonly, inside the cells (3, 28, 46), sometimes in association with the inner cell envelope (42). It is not known whether Te has a biogeochemical cycle; however, a number of toxic elements clearly do have such cycles. The biogeochemical cycles for arsenic and selenium have been elucidated (reviewed in reference 34). On the reductive side, uranium (22, 40), chromium (40), and vanadium (27) all can serve as electron acceptors for the anaerobic growth of diverse prokaryotes. The recent discovery of Te(VI) reduction by bacteria isolated from the surfaces of marine worms found near hydrothermal vents was suggestive of respiration (6). Here, we report that two well-studied bacteria originally isolated for their abilities to respire selenium oxyanions, Bacillus selenitireducens (37) and Sulfurospirillum barnesii (26, 35), also have abilities to grow using Te(IV) and Te(VI), respectively, as their electron acceptors. We have shown a stoichiometric growth relationship between the oxidation of the provided electron donor (lactate) and the reduction of these oxyanions to Te(0). Moreover, dissimilatory reduction of Te oxyanions by these two bacteria results in the formation of unusual Te(0) crystals that could have a future practical application(s) as composite or compound nanomaterials in solar cells.
MATERIALS AND METHODS
Growth and washed-cell experiments.
B. selenitireducens and S. barnesii were grown in anaerobic batch culture, with lactate as the electron donor as previously described but with Te oxyanions serving as the electron acceptor (26, 37). The former microbe is a haloalkaliphile isolated from Mono Lake that respires selenite, while the latter is a freshwater isolate that respires selenate. Both respire arsenate as well as several other inorganic electron acceptors, including nitrate. Growth experiments with B. selenitireducens or S. barnesii were conducted by making pulsed additions of 0.6 mM of either Te(IV) or Te(VI), respectively, to the cultures over the course of a 30-day incubation. This strategy was chosen because higher starting concentrations of Te (e.g., >∼2 mM) were found to inhibit growth. Pulsed 0.6 mM additions of Te(VI) for S. barnesii were made at several intervals over the 30-day incubation such that the concentration in each bottle was maintained between 0.1 and 1.2 mM for an ∼6.0 mM total cumulative addition of Te(VI). The 0.6 mM pulsed additions of Te(IV) maintained the 0.1 mM to 1.5 mM concentrations, with also a cumulative total of ∼6.0 mM Te(IV) added over 28 days. Both cultures were incubated statically at 28°C and were subsampled using a sterile anaerobic technique in order to maintain the proper Te(VI) or Te(IV) concentration in the aqueous phase. Values for Gibbs free energies of formation for thermodynamic calculations were taken from published tables (41, 44).
Cells used for the washed-cell experiments in the stable Te isotope fractionation experiments (see below) were grown in 500-ml batches as described above, with nitrate as the electron acceptor for S. barnesii and fumarate for B. selenitireducens, before being harvested and washed with mineral media previously described (26, 37). The washed cell pellets were resuspended in mineral salt medium that lacked reducing agents (e.g., cysteine sulfide or cysteine) as well as supplements of vitamins and yeast extract (final cell densities = ∼1.2 × 10⁹ to 1.9 × 10⁹ cells ml−1). Only 3 mM Te(VI) or Te(IV) was added to S. barnesii or B. selenitireducens, respectively, with 5 mM lactate serving as the electron donor. The liquid and solid fractions of the washed cells were separated by centrifugation, and the solid phase was rinsed with deionized water before being dissolved and cleaned for its Te-isotopic analysis.
Stable isotopic fractionation.
For analysis of Te fractionation in experiments with washed cells or abiotic controls, solid and liquid fractions were separated by centrifugation before the solid fraction was dissolved in concentrated nitric acid, allowed to sit for an hour, and then diluted to 2% nitric acid. For abiotic controls, chemical reduction of Te(IV) with cysteine-HCl was carried out in N2-flushed tubes with 3 mM Te(IV) and 0 to 2.0 ml of 2.5% cysteine-HCl, which were allowed to sit for a week before being analyzed on a Perkin-Elmer Elan 6000 inductively coupled plasma mass spectrometer (ICP-MS). For the purification of solid and liquid samples for tellurium MS, a modification of the anion-exchange technique reported by Loss et al. (21) was employed. Teflon beakers and subboiling distilled acids were used throughout the procedure. Solid samples of various Te amounts were dissolved in 1 ml of 6 N HCl. Liquid samples containing ∼25 μg Te were taken to dryness on a hot plate, treated with Ultrex H2O2 to eradicate organics, and dissolved in 1 ml of 6 N HCl. Te concentrations were measured on a small, weighed fraction taken from each sample solution using the ICP-MS. Digested solid and liquid fractions containing ∼21 μg Te were loaded directly onto a Teflon column containing 1 ml of AG-1-X8 anion-exchange resin that had previously been cleaned and equilibrated with 6 N HCl. The column was washed with 10 ml of 6 N HCl and 10 ml of 3 N HCl, and Te was then eluted from the column with 7 ml of 0.5 N HCl. The concentration of Te was then measured in this fraction to demonstrate quantitative recovery of Te from the column (target concentration, 3 ppm). Recoveries ranged from 98% to 103%. Although not utilized in this study but potentially present in the product effluents as a result of processing, cadmium, tin, antimony, palladium, rubidium, strontium, and zirconium, which might cause isobaric interferences during isotope composition analysis, were monitored during this measurement. These elements were not detected in any of the product effluents.
Tellurium isotope compositions were measured on a Thermo-Finnigan Neptune multicollector ICP-MS at the University of California at Santa Cruz. The instrument was operated in standard-resolution mode. Samples were directly aspirated into the MS as solutions of 3 ppm Te in 0.5 N HCl (∼4%). Prior to measurement, a fixed amount of either indium (113In, 115In) or a mixture of enriched 120Te and 124Te (Te “double spike”), both in 0.5 N HCl, was added to a fixed amount of the sample solution. The In “normal” or Te “double spike” amendments allowed for correction of variable mass discrimination due to subtle matrix effect differences during measurement of the isotopic composition of the samples. For the purpose of data presentation, here we discuss the 130Te/125Te ratio only and report isotope enrichment factors in terms of differences per ml per atomic mass unit. For MS runs using the indium (In) internal standard, isotope data were collected in 30 repetitions of two 4-second scans: first 125Te-126Te-128Te-130Te simultaneously and then 113In-115In simultaneously. A 3-ppm Te standard solution, similarly spiked with In, was analyzed between each sample. To extract the true 130Te/125Te ratio, we first determined the linear relationship between the natural logs for measured 115In/113In and 130Te/125Te for all standards run during the analysis session (see the “empirical external normalization” of Clayton et al. [4]) and applied a correction to both samples and standards. 130Te/125Te ratios were then determined using the corrected data with a traditional “standard-sample-standard” bracketing technique. In runs using the Te “double spike” internal standard, isotope data were collected in 30 repetitions of a single 8-second scan: 120Te-124Te-125Te-126Te-128Te-130Te simultaneously. The 130Te/125Te ratio was extracted from the isotope composition of the sample “double spike” mixture, using the same algorithm as that used previously in our work on selenium isotopes (17). The data are reported here as δ130Te, the per-mil difference between the resulting 130Te/125Te ratio of a sample and that of the starting material for each experiment.
Electron microscopy.
Scanning electron microscopy (SEM) images were prepared by filtering the bacteria and Te(0) onto 0.1-μm Nuclepore filters, fixing them with gluteraldahyde, dehydrating them in ethanol and then amyl acetate, and then critical point drying them with CO2 as previously described (26, 32). Transmission electron microscopy (TEM), energy-dispersive X-ray spectroscopy (EDS), and selected area electron diffraction (SAED) were all done on a Philips CM10 operating at 100 kV. Whole mounts consisted of unstained cells lying on carbon- and Formvar-coated 200-mesh copper grids. Thin sections were taken from cells fixed with 2% (vol/vol) glutaraldehyde in 1.5 mM HEPES buffer, en bloc stained with 2% (wt/vol) uranyl acetate, and embedded in LR White resin. For added contrast, some sections were floated on 2% uranyl acetate for 2 min and washed with water before being viewed. EDS was performed using a beam current of 10 nA for 100 s (live time). The camera length for SAED was 640 mm.
Raman and UV-visible light (UV-Vis) spectroscopy.
The Te(0) formed by growing cultures of B. selenitireducens and S. barnesii was harvested and cleansed of cellular materials by procedures outlined previously for the selenium nanospheres formed by these microorganisms (25). No precautions were taken to exclude oxygen in the process, and purified Te(0) samples were stored in deionized water under air for up to a year before undergoing spectroscopic analyses. However, a sample set from S. barnesii was also processed, with precautions taken to exclude oxygen, which included making all manipulations in an anaerobic chamber, centrifuging the cell material/Te(0) mixtures in anaerobically sealed tubes, and storing the final purified Te(0) samples in aqueous suspension as described above but crimp sealing them in a serum bottle under an N2 atmosphere. Raman spectra of the purified Te(0) samples from growth experiments as well as commercially obtained Te(0) were obtained using a Renishaw InVia Raman spectrometer equipped with a Raman Leica RE02 microscope. The excitation wavelength was 488 nm, produced from an air-cooled Laser-Physics Ar+ laser. Depending upon the sample, the excitation laser power used was between ∼1.3 mW and ∼2.5 mW. The biologically produced Te samples suspended in deionized water were drop cast onto clean silicon substrates and allowed to dry before the Raman spectra were accumulated. The commercially produced Te sample (Te powder, 200 mesh; Aldrich Chemical Co.) was suspended in deionized water and also drop cast onto a clean silicon substrate and allowed to dry before the Raman spectra were acquired. The Raman spectrometer was calibrated to the 520-cm−1 Raman peak of the silicon substrate.
UV-Vis absorption data were acquired using a Perkin-Elmer Lambda 20 UV-Vis spectrometer operating at a range of 350 nm to 1,000 nm. The biologically produced Te samples suspended in deionized water were drop cast onto clean glass microscope slides and allowed to dry before the absorption spectra were accumulated. The commercially produced Te sample was suspended in deionized water and also drop cast onto a clean glass microscope slide and allowed to dry before the UV-Vis data were acquired. An absorption spectrum of a clean, blank glass microscope slide was first measured and used as a background reference for the Te sample data.
Analysis.
Lactate, acetate, and tellurate were quantified by high-performance liquid chromatography with both Bio-Rad Aminex HPX-87H and Hamilton PRP-X300 columns and a UV detector with a 0.016 N sulfuric acid mobile phase. Tellurite was measured on a Dionex ion chromatography system with a Dionex HC-9 column, a UV detector, and a bicarbonate mobile phase. Final Te(0) was quantified by subsampling a known volume of the final cell and tellurium suspension after it was mixed well, centrifuging it to remove the liquid fraction, and then dissolving the solid fraction in concentrated nitric acid. An hour later, the nitric acid was diluted to 2% and further dilutions were made before the final product was run on the ICP-MS and the original tellurium content of the sample was back calculated. Tellurite concentrations were determined using hydride generation atomic adsorption spectrophotometry as described elsewhere for As analysis (20) but modified by employing a Te-specific lamp. Cell densities were measured using acridine orange direct counts (14).
RESULTS
Demonstration of respiratory growth on Te(IV) and Te(VI).
Growth of B. selenitireducens on Te(IV) was slow (doubling time = 3.4 days; growth rate = 0.2 day−1) but resulted in a 10-fold increase in cell density, the near-quantitative oxidation of lactate to acetate, and the removal of ∼5.5 mM of the cumulatively added Te(IV) (Fig. 1A). At the end of the incubation, there was a complete recovery of Te(0) (mean = 5.5 mM ± 0.8 [standard deviation]; three experiments) from the added Te(IV) as determined by oxidation of the black precipitate back into solution with nitric acid. In contrast, there was no significant growth in live controls lacking Te(IV) (final density = ∼1.0 × 10⁷ cells ml−1) and oxidation of lactate to acetate did not occur, while there was no loss of Te(IV) from sterile controls, which achieved a final cumulative added concentration of 5.7 mM (not shown). Similar growth phenomena were observed for S. barnesii, using Te(VI) as its electron acceptor (Fig. 1B). Cell densities reached ∼3 × 10⁸ cells ml−1 (doubling time = 3.3 days; growth rate = 0.2 day−1), whereas controls without Te(VI) did not grow (∼2 × 10⁷ cells ml−1), and sterile controls did not consume Te(VI) (data not shown). A rough carbon balance was achieved between lactate consumed (12 mM), acetate produced (9 mM), cell growth (∼0.6 mmol C liter−1), and the occurrence of both pyruvate (0.4 mM) and propionate (0.4 mM) as minor intermediates (not shown). Similarly, a complete reduction of ∼6.5 mM Te(VI) to Te(0) would require ∼39-mmol-eq electrons, while the observed formation of 9 mM acetate would generate 36-mmol-eq electrons from the oxidation of lactate. Tellurite was a transient intermediate during growth of S. barnesii on Te(VI), with concentrations ranging between 0.003 and 0.18 mM, or on average ∼10% of the amount of Te(VI) added as pulsed additions (not shown). The observation of Te(IV) as a transient intermediate was analogous to that of selenite during growth of S. barnesii on selenate (26).
FIG. 1.

Growth of B. selenitireducens on Te(IV) (top) and of S. barnesii on Te(VI) (bottom). Symbols represent the means for three experimental growth cultures, and bars indicate standard deviations.
Stable Te isotope fractionation.
Dissimilatory reduction of tellurium oxyanions by washed cell suspensions of B. selenitireducens (Fig. 2A) and S. barnesii (Fig. 2B) caused a kinetic isotope effect (KIE), resulting in a clear biological fractionation of stable tellurium isotopes. This could be viewed in time course incubations either as a progressive enrichment of the heavier 130Te in the residual unreacted aqueous tellurium or as an early enrichment of the lighter 124Te in the solid phase. Isotopic mass balance was achieved in both sets of experiments, as indicated in Fig. 2A and B, by clustering of the calculated total system composition around the starting composition.
FIG. 2.
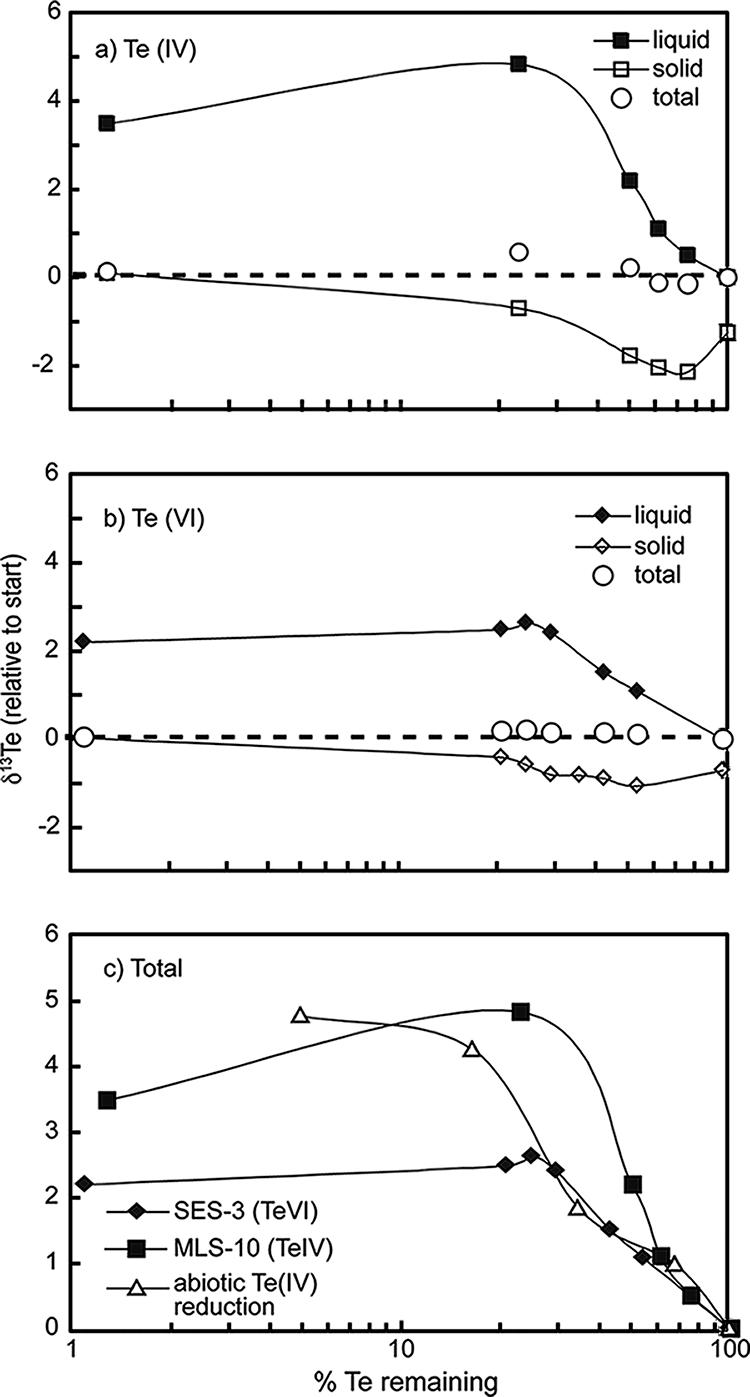
Stable Te isotope fractionation during reduction of Te oxyanions by cell suspensions of B. selenitireducens reducing Te(IV) (a), cell suspensions of S. barnesii reducing Te(VI) (b), and fractionation in liquid fractions achieved by chemical reduction of Te(IV) with cysteine compared with the biological reductions (c). δ130Te values are plotted relative to the δ130Te ratio of the starting liquid for each experiment. Symbols referring to aqueous samples represent the δ130Te of unreacted tellurium oxyanions in solution, while those referring to the solid phase represent the δ130Te of the Te(0) product. Symbols referring to “total” represent calculated mass balances based on Te mass proportion and δ130Te values for the aqueous- and solid-phase samples.
The observed KIE was greater during reduction of Te(IV) with B. selenitireducens than during either reduction of Te(VI) with S. barnesii or chemical (abiotic) reduction of Te(IV) with cysteine (Fig. 2C). Isotopic enrichment factors (ɛ), calculated as the slopes of the lines through the aqueous-phase data for each experiment shown in Fig. 2C, are given in Table 1. We note that in the latter portion of each experiment (i.e., <20% aqueous Te remaining), the δ130Te of aqueous Te became constant or decreased slightly, resulting in a change in the slopes of the curves in Fig. 2C. Whether this reflects an approach toward isotopic equilibrium, a sampling artifact (e.g., entrainment of some isotopically lighter, solid Te in the aqueous fraction), or some other as-yet-undiscerned process remains an open question. Regardless, for determination of ɛ, we restrict our analysis to data for samplings with >20% aqueous Te remaining in order to assess the clear KIE.
TABLE 1.
Stable Te isotope fractionation achieved with growing cultures and cell suspensions of B. selenitireducens and S. barnesii compared with results for earlier experiments conducted with Se oxyanions or with the fungus P. brevicula
| Exptl condition | Oxyanion | Isotope enrichment factor (ɛ) per ml per atomic mass unit |
|---|---|---|
| B. selenitireducens | Te(IV) | −0.80 |
| B. selenitireducensa | Se(VI) | −2.0 |
| S. barnesii | Te(VI) | −0.39 |
| S. barnesiia | Se(VI) | −1.0 |
| Abiotic reduction with cysteine | Te(IV) | −0.47 |
| Penicillum breviculab | Te(IV) | −0.75 |
| Abiotic reduction with sulfiteb | Te(IV) | −0.88 |
Electron microscopy.
Both washed cell suspensions and growing cultures of B. selenitireducens on Te(IV) formed abundant accumulations of Te(0) on their cell surfaces (Fig. 3). Unstained whole mounts of cell suspensions of B. selenitireducens given Te(IV) and examined by TEM revealed thick surface accumulations (“Te nanorods”) of an electron-dense mineral, on average ∼32 nm in diameter by ∼260 nm in length, that could be seen in tight association with the cells (Fig. 3A). In growth experiments, these surface Te nanorods were somewhat sparser and thinner, on average 18 nm in diameter by ∼125 nm in length, than those seen in the cell suspensions (Fig. 3B). These Te nanorods presumably grew from cellular nucleation points as the Te was reduced. Once produced, the nanorods clustered together to form much larger (∼1-μm-long) and thicker (∼200-nm) appendages (“shards”), often projecting outward from the plane of the cell surface. Scanning electron micrographs confirmed this and showed the presence of numerous larger external rosettes of Te(0) composed of dozens of individual linear crystals similar in size and shape to the Te shards (Fig. 3C). These were interpreted to be the major end product of dissimilatory Te(IV) reduction because of their obvious abundance when viewed in a wider field (Fig. 3D). These rosettes could be seen both on and off cells, and we suggest that these Te rosettes are composites of individual Te shards that sloughed off the cell surfaces and, once free, adhered to one another, possibly through electrostatic interaction.
FIG. 3.

Te(0) nanomaterials formed by dissimilatory reduction of Te(IV) by B. selenitireducens. (A) TEM of cell surfaces of washed cell suspensions given Te(IV) and showing Te nanorods (“nr” arrows). (B) TEM of extracellular Te(0) nanorods (“nr” arrows) and larger Te shards (“S” arrows) on cells growing on Te(IV). (C) SEM of cells and Te rosettes (“R” arrow). (D) Wider-field SEM view of the abundance of the external Te(0) rosettes (“R” arrow). (E) TEM thin section showing internal cellular accumulations of Te(0) nanorods (arrows) after incubation of washed cells with Te(IV).
Surprisingly, thin sections of B. selenitireducens revealed internal accumulations of Te(0). This occurred either under growth conditions or in washed cell suspensions, where the Te(0) had the characteristic nanorod appearance (Fig. 3E). These internal Te(0) accumulations often formed close to the cell's periphery and conformed to the contour of the cell envelope (Fig. 3E). This observation suggested that Te nanorods were formed via metal reduction mechanisms occurring inside the cell. It was striking to notice that the internal shards were composed of a linear arrangement of smaller nanocrystallites (Fig. 3E), suggesting that separate nucleation points within the cytoplasm, close to the cell envelope, initiated Te reduction. As these small nanocrystallites grew in size, they annealed together to form the larger, shard-like nanocrystals. This method of growth helps explain the linear shard-like gross morphologies of the Te nanorods. After a search through many thin sections, however, nanorods were never seen escaping from a cell. Indeed, the particulate nature of the nanorods makes it unlikely that they could escape without lysing cells; yet, few lysed cells were encountered. Clearly, Te nanorods were frequently encountered on the outside surfaces of the bacteria as well as in the external milieu (Fig. 3A to E). The similar appearances of both the external and the internal mineral phases suggested that they were identical. EDS and SAED also suggested this, because both types consisted of only Te and both had crystalline structures (Fig. 4A).
FIG. 4.
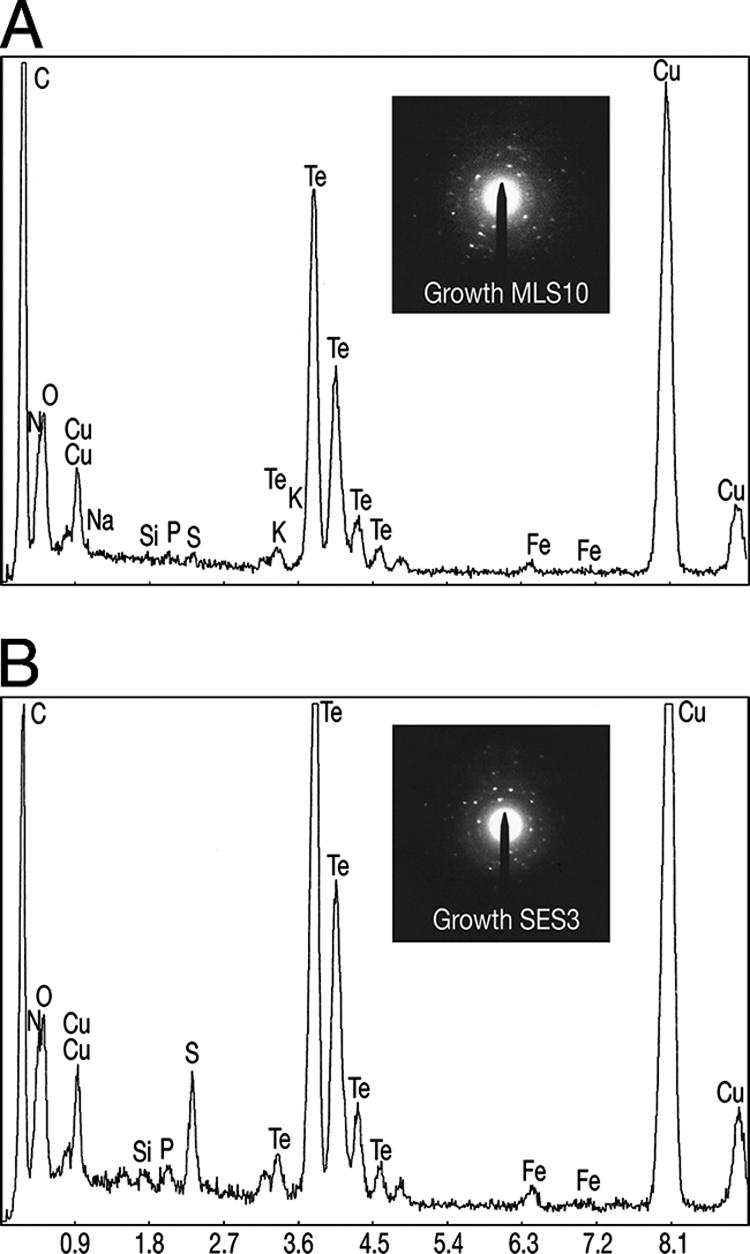
EDS spectra for B. selenitireducens (A) and S. barnesii (B) with SAED patterns inserted.
Unstained whole mounts of S. barnesii revealed an entirely differently shaped mineral phase. This was in the form of irregularly shaped, ∼20-nm-sized “nanospheres” that coalesced together to form larger, ∼500- to 1,000-nm (average = ∼430 nm) clusters (Fig. 5A) , often attached to the cell surface (Fig. 5B). The clusters of exogenous Te(0) nanospheres were clearly the major end product of dissimilatory Te(VI) reduction, as can be seen in an SEM image over a wider field (Fig. 5C). As with B. selenitireducens, thin sections of S. barnesii revealed that nanospheres were being formed not only outside but inside the cells as well (Fig. 5D). Accordingly, electron transfer took place both inside and outside cells for reasons speculated on above, but in this case, a mineral phase different from that seen with B. selenitireducens was formed. Visual observation, EDS, and SAED suggested that the inside and outside phases were identical, consisting only of Te, and were crystalline (Fig. 4B). Native Te(0) obtained from a chemical supply house did not exhibit any of these bacterial Te morphotypes, because the commercial materials either were amorphous or when structured displayed a much larger cuboidal arrangement (Fig. 5E).
FIG. 5.

Formation of irregular Te(0) “nanospheres” by S. barnesii. (A) Whole-mount TEM image of a single cell grown on Te(VI) showing abundant external Te nanospheres (small arrows) forming larger aggregates (large arrow) on the cell surfaces. (B) Lower-magnification TEM image of another single cell grown on Te(VI) showing abundant external Te nanospheres. (C) Wide-field SEM image of the Te(0) nanosphere aggregates formed after growth on Te(VI). (D) Unstained TEM thin-section image of cells grown on Te(VI) showing internal accumulations of Te(0). (E) SEM image of Te(0) obtained from a chemical supply house.
Raman and UV-Vis spectroscopy.
In order to gain insight into the atomic structural arrangements within these Te nanocrystals, the extracellular tellurium “rosettes” from B. selenitireducens and the granular “nanospheres” from S. barnesii were cleansed of cellular material and compared with the commercially obtained Te(0) using Raman spectroscopy. Elemental Te is known to adopt a trigonal geometry with three tellurium atoms per unit cell under ambient conditions (∼20°C) (5, 18). Each of these unit cells can then be characterized by an infinite helical chain oriented parallel to the x axis (Fig. 6), which leads to interchain interactions (between the different unit cells) and intrachain interactions (between each Te atom per unit cell). The presence of any oxidized Te (i.e., TeO2) in samples exhibits specific vibrational positions between 200 cm−1 and 800 cm−1, while pure Te(0) will have only one vibrational mode (270 cm−1) in this range, corresponding to the second-order E vibrational mode. Both the B. selenitireducens and the S. barnesii samples had only Te peaks present at 270 cm−1, with the peak at 520 cm−1 being attributable to silicon used as the substrate in sample preparation (Fig. 7). In comparison, the commercially obtained Te not only exhibited the Te(0) band at 270 cm−1 but also had six multiple peaks characteristic of TeO2 vibrational configurations (224, 352, 440, 578, 646, and 660 cm−1) as well as a band corresponding to the chain ends, evident as a small vibrational mode at 724 cm−1 which corresponds to a TeO3 pyramidal structure. Hence, it is clear that the two microbial samples consisted of only pure Te(0), while the commercially obtained Te(0) in reality consisted of a mixture of Te(0) and TeO2. We also detected evidence for Te(0) oxidation occurring in the Te nanospheres derived from S. barnesii that we stored in distilled water for a year without taking any precautions to exclude air. Its vibrational spectrum also showed multiple peaks between 200 cm−1 and 700 cm−1, but notably none at 270 cm−1, suggesting that the Te(0) was oxidized to a mixture of TeO2 configurations, with the β-TeO2 form dominating. These TeO2 vibrational peaks were absent from the Te nanosphere samples where we had taken pains to exclude oxygen by preparing the samples in an anaerobic glove box and subsequently storing them under N2. Curiously, the Te rosette samples obtained from B. selenitireducens were also stored for a prolonged period under distilled water in contact with air but did not exhibit any TeO2 vibrational peaks. This would suggest that the Te nanospheres from S. barnesii were more reactive than the Te nanorod rosettes from B. selenitireducens even though they had the same Raman spectra (Fig. 7). We attribute this to the much greater surface area associated with the Te(0) crystals from S. barnesii (Fig. 5) than with those from B. selenitireducens (Fig. 3).
FIG. 6.

Trigonal arrangements of tellurium atoms aligned in basic unit pattern (A) and the self-seeding nucleation process whereby this basic structure forms nanorods (B).
FIG. 7.

Raman spectra of purified Te(0) nanomaterials from B. selenitireducens (MLS10), S. barnesii (SES3), and samples from S. barnesii that were exposed to air for over a year compared with those of samples of commercially obtained Te(0). The peak at wave number 270 corresponds to Te(0), while other peaks between 200 and 800 correspond to TeO2, with the exception of a peak at 520 corresponding to Si. a.u., arbitrary units.
Analysis of UV-Vis spectra obtained from the Te(0) rosettes indicated a significantly larger absorption range in the near-infrared region (not shown). The shift in the absorption maximum of the B. selenitireducens samples was only ∼0.25 eV relative to that of commercial Te(0), but the shift in the S. barnesii samples was ∼0.75 eV. While there was little difference in bandgap energies between B. selenitireducens Te(0) shards and the commercial sample, the S. barnesii Te(0) material shifted to a lower bandgap energy, which was indicative of the greater ease with which its electrons left its atomic valence constraints and became conduits of electrical conduction.
DISCUSSION
Our results for B. selenitireducens (Fig. 1A) and S. barnesii (Fig. 1B) represent the first clear evidence that anaerobic bacterial growth can be achieved by employing tellurium oxyanions as electron acceptors. Previously, cytochromes were shown to be involved in the reduction of Te(IV) to Te(0) by some common gram-negative bacteria, but no claim was made with respect to tellurium-associated energy conservation (42). More recent was a growth claim for two uncharacterized marine isolates associated with a hydrothermal vent that were capable of reducing Te(VI) to Te(0). However, the evidence given for respiratory growth linked to Te(VI) was equivocal in that it was based on modest cell count increases during prolonged incubation as well protonophore (CCCP [carbonyl cyanide m-chlorophenylhydrazone]) inhibition of such growth (6). No clear demonstration of energy conservation linked to Te(VI) reduction was provided.
The fact that B. selenitireducens and S. barnesii grew in medium with Te(IV) or Te(VI) (Fig. 1) while no growth was observed in controls lacking these oxyanions represents a clear demonstration of Te-dependent growth. The linkage of lactate oxidation to Te oxyanion reduction further demonstrated that these substances served as terminal electron acceptors for anaerobic respiration. Hence, the biological oxidation of organic matter using Te(IV) as an electron acceptor must be exothermic in order to support the growth of B. selenitireducens, and experimental observations noted that it conformed to the following stoichiometry:
 |
(1) |
 |
Likewise, growth of S. barnesii on lactate and Te(VI) was also exothermic and was noted to conform to the following stoichiometry:
 |
(2) |
 |
Because tellurium oxyanions are relatively strong oxidants, the energy yields for equations 1 and 2 under standard conditions are high. Yet, these calculations stand in contrast to our experimental observations of rather slow doubling times (>3 days) for each microorganism. However, when we applied more reasonable in situ concentration values of ∼1 mM Te(IV) or Te(VI), the energy yields did not change significantly, showing a slight decrease for equation 1 (ΔGr = −217.2 kJ mol lactate−1), while equation 2 increased slightly (ΔGr = −280.4 kJ mol lactate−1). We conclude that while these two microorganisms are capable of growth via dissimilatory reduction of Te oxyanions, their lack of robust growth is more likely associated with the toxicity of these compounds as well as practical constraints imposed by the pulsed additions of Te oxyanions. While we circumvented our preliminary problem of initial Te toxicity to our cultures (∼≥2 mM) by making pulsed additions of 0.6 mM Te oxyanions over the course of the incubations, these low-concentration additions constricted potential growth rates by limiting the availability of the electron acceptor. This observation stands in contrast to the typical concentrations of Se oxyanions (10 to 20 mM) or arsenate (5 to 10 mM) that we employ for routine cultivation of these organisms (26, 37).
The resistance of bacterial growth to Te oxyanions, primarily Te(IV), has been well studied (3, 10, 23, 24, 36, 39). In general, MICs of ≤2 mM have been commonly reported (3, 36), although resistance to ∼10 mM has been noted in the case of some isolates from marine hydrothermal vents (28). Both B. selenitireducens and S. barnesii were originally isolated for their abilities to grow using 10 mM selenite and selenate, respectively, as their respiratory electron acceptors (26, 37). We undertook this current investigation to answer the simple question of whether oxyanions of tellurium, another group 16 element, could substitute for selenium oxyanions in their capacities to support the growth. While we have shown this to be true, we were surprised by the low tolerance of these bacteria to Te(IV) and Te(VI), which stood in contrast to their abilities to withstand and employ much higher levels of selenium oxyanions. It is not known yet whether actual dissimilatory tellurate/tellurite reductases that would be analogous to the substrate-specific selenate reductase of Thaurea selenatis exist (30). Alternatively, it could be that these Te reductions are achieved by enzymes with much broader substrate affinities, such as nitrite reductase (1, 7) or dimethyl sulfoxide reductase (43). We suggest that because of the sensitivities of these two organisms to Te oxyanions, the answer to this question may be better served by first isolating novel species of Te-respiring bacteria that are also resistant to high concentrations of Te oxyanions.
Stable isotope ratios have often been used to track diverse biogeochemical processes both in present-day natural and experimental settings and over the ∼3.8-billion-year record of life on Earth. Much of the effort has concentrated on lighter elements, such as C, N, and S, where the KIEs are greatest (29, 31), since fractionation of heavier elements, such as iron (16), is generally more subtle and was until the past few years difficult to accurately measure. In our experiments, we observed relatively large KIEs during both microbial and abiotic reduction of relatively heavy Te. In our experiments, a greater fractionation was achieved by B. selenitireducens reducing Te(IV) than by S. barnesii reducing Te(VI) (Table 1). This may have been due to the fact that the reaction proceeded faster in cell suspensions of S. barnesii (8.2 × 10⁻¹⁷ mol cell−1 day−1) than in B. selenitireducens (6.4 × 10⁻¹⁷ mol cell−1 day−1), allowing greater expression of the KIE in the latter. Alternatively, isotopic fractionation may be controlled by different rate-limiting steps along the specific reduction pathways associated with these microbes, and for S. barnesii, it is a two-step process involving reduction of Te(VI) to Te(IV), followed by reduction of the latter to Te(0). B. selenitireducens also exhibited greater fractionation of Te(IV) than could be achieved by chemical reduction or by the mold Pterotrigonia brevicula during its detoxifying metabolism of Te(IV) (33). Compared with what was found in the experiments conducted by Herbel et al. (13) with selenium oxyanions, however, B. selenitireducens and S. barnesii achieved at least twice as great a fractionation during reduction of a lighter Se element (atomic weight = 78.96) as they did during reduction of a heavier Te element (atomic weight = 127.6). Nonetheless, the KIEs achieved by the two microbes used in this study open the possibility of employing stable Te isotope ratios to study the biogeochemistry of this element in nature, as has been attempted for selenium (17). Such an approach could help determine if natural enrichments of this element, such as those associated with marine ferromanganese deposits (11), are formed by reductive microbiological processes or by purely physical/chemical mechanisms.
The nanocrystals of Te(0) formed by B. selenitireducens (Fig. 3) and S. barnesii (Fig. 5) were strikingly different in appearance, despite the fact that they have similar internal structures as revealed by Raman spectroscopy (Fig. 7). These observations stand in curious contrast to our previous results concerning the formation of elemental selenium nanospheres by these microorganisms as well as by the extreme halophile Selenihalanaerobacter shriftii (25). In that study, all the Se nanospheres had an outwardly uniform appearance but differed markedly with respect to their spectral properties (both UV-Vis and Raman), which we speculated was caused by the involvement of different reductase enzymes for each of the three microbes. The similarity among the Raman spectra for Te(0) in this work probably lies in the fundamental trigonal alignment features of the Te chains (Fig. 6), suggesting that there are few if any variations possible on this basic theme.
We did note some differences between the Te(0) nanorods formed by cell suspensions of B. selenitireducens (Fig. 3A) and those formed during growth experiments (Fig. 3B). The only difference between these two conditions was that cysteine was not included in the cell suspension experiments but was required for growth by serving as a sulfur source and reducing agent. For washed cells, we did not note any sloughing off of the Te(0) nanorods to form Te shards, and indeed, the Te(0) remained tightly adhered to the cell surface. Preliminary measurements made by Fourier transform infrared spectroscopy of Te(0) nanorods from the cell suspension experiments revealed the presence of functional amide groups on the Te(0), suggesting that some cell wall proteins remained firmly attached to the Te(0) even after being subjected to our purification steps (P. Ajayan, personal communication). In contrast, the Te(0) shards formed during growth were easily purified, presumably because the presence of cysteine in the medium eliminated strong attachment of the Te(0) nanorods to the cell surface of sulfhydryl groups.
In addition to the external Te minerals, we also noted the occurrence of internal Te(0) deposits in both B. selenitireducens (Fig. 3E) and S. barnesii (Fig. 5D). To account for both internal and external nanorods, it is likely that B. selenitireducens has two separate electron transfer systems, one inside cells for detoxification purposes and another associated with the cell membrane that is involved in energy conservation. Previously, we reported that both B. selenitireducens and S. barnesii formed discrete Se(0) “nanospheres” on their cell surfaces when grown on selenium oxyanions, which sloughed off the cells, forming larger aggregates (25). We also noted the occurrence of internal Se nanospheres in both organisms, which we attributed to the reductive detoxification reaction of all Se oxyanions that entered the cells. It is therefore likely that the crystals of Te(0) found within B. selenitireducens as well as within S. barnesii were formed by similar precipitating reductive detoxification reactions as opposed to dissimilatory (respiratory) reductions.
Nonetheless, a clear experimental proof that supports our different hypothesized origins for the internal (detoxification) versus external (dissimilatory reduction) Te(0) nanocrystals was not pursued in this study. This would be a fruitful area for future research but may be resolvable only by employing genomic/proteomic in silico approaches in conjunction with experiments using metabolic inhibitors and/or knockout mutants. Indeed, it would also be quite interesting to identify the initial nucleation mechanism, presumably an outward-facing membrane protein linked to the electron transport chain, that serves as a template for external Te(0) and Se(0) nanoparticle aggregation. It could be that fundamental differences in the structure of such a protein could in turn give rise to the profound geometric and spectral variations that we reported to be between Te(0) and Se(0) nanoparticles formed by diverse prokaryotes that respire oxyanions of these elements.
A current technical interest in tellurium is centered upon its optical-electrical properties, with a goal in mind of devising solar cells that have high efficiencies of conversion of sunlight into electrical current. The lower bandgap energy that we noted for the S. barnesii Te(0) indicates the greater ease with which this material can serve to convert radiant electromagnetic energy into electrical current than the referenced commercially obtained samples. This agrees with its overall higher chemical reactivity with regard to oxidation upon air exposure (Fig. 7).
Recent research in materials science has focused on preparing nanorods of either TeO2 or Te(0) by using physical/chemical techniques, such as high-energy sources (e.g., laser ablation) run at high temperatures (e.g., 500°C), sonication, or auto-oxidation of highly reactive chemicals (e.g., NaHTe) with oxygen (9, 15, 47). We suggest that the use of Te-respiring anaerobes may also yield a diversity of useful Te nanomaterials that can be generated at room temperature and without requiring the use of either harsh chemical or physical methods. It is also notable that cell suspensions of Veillonella atypical were capable of selenide and telluride production from their corresponding oxyanions (45). Although B. selenitireducens can produce hydrogen selenide via dissimilatory reduction of selenite (12), its ability to produce hydrogen telluride has not been tested. It is conceivable, therefore, that in addition to the formation of nanomaterials composed of Te(0), microbiological approaches could also be devised to generate CdSe and CdTe nanoparticles.
Acknowledgments
We are grateful to M. Herbel and P. Ajayan for preliminary technical analyses and discussion, to J. Switzer Blum for technical assistance, and to L. Young, J. Stolz, and L. G. Miller for constructive comments on an earlier draft of the manuscript.
This work was supported by the USGS Director's Venture Capital Fund award and by a NASA Exobiology grant (R.S.O.).
This paper is dedicated to the memory of Melvyn J. Oremland (1939-2005), Professor of Physics, Pace University, NY.
Footnotes
Published ahead of print on 2 February 2007.
REFERENCES
- 1.Avarézi, C., R. J. Turner, J. Pommier, J. H. Weiner, C. Giordano, and A. Verméglio. 1997. Tellurite reductase activity of nitrate reductase is responsible for the basal resistance of Escherichia coli to tellurite. Microbiology 143:1181-1189. [DOI] [PubMed] [Google Scholar]
- 2.Basnayake, R. S. T., J. H. Buis, O. M Akpolat, and T. G. Chasteen. 2001. Production of dimethyl telluride and elemental tellurium by bacteria amended with tellurate or tellurite. Appl. Organometal. Chem. 15:499-510. [Google Scholar]
- 3.Borghese, R., F. Borsetti, P. Foladori, G. Ziglio, and D. Zannoni. 2004. Effects of the metalloid oxyanion tellurite (TeO32−) on growth characteristics of the phototrophic bacterium Rhodobacter capsulatus. Appl. Environ. Microbiol. 70:6595-6602. [DOI] [PMC free article] [PubMed] [Google Scholar]
- 4.Clayton, R., P. Andersson, N. H. Gale, C. Gillis, and M. J. Whitehouse. 2002. Precise determination of the isotopic composition of Sn using MC-ICP-MS. J. Anal. At. Spectrom. 17:1248-1256. [Google Scholar]
- 5.Cooper, E. D. 1994. Tellurium. Van Nostrand Reinhold Co., New York, NY.
- 6.Csotonyi, J. T., E. Stackebrandt, and V. Yurkov. 2006. Anaerobic respiration on tellurate and other metalloids in bacteria from hydrothermal vent fields in the eastern Pacific Ocean. Appl. Environ. Microbiol. 72:4950-4956. [DOI] [PMC free article] [PubMed] [Google Scholar]
- 7.de Moll-Decker, H., and J. M. Macy. 1993. The periplasmic nitrite reductase of Thauera selenatis catalyzes the reduction of selenite to elemental selenium. Arch. Microbiol. 160:241-247. [Google Scholar]
- 8.Fleming, A., and M. Y. Young. 1940. The inhibitory action of potassium tellurite on coliform bacteria. J. Pathol. Bacteriol. 51:29-35. [Google Scholar]
- 9.Gautam, U. K., and C. N. R. Rao. 2004. Controlled synthesis of crystalline tellurium nanorods, nanowires, nanobelts and related structures by a self-seeding solution process. J. Mater. Chem. 14:2530-2535. [Google Scholar]
- 10.Guzzo, J., and M. S. Dubow. 2000. A novel selenite- and tellurite-inducible gene in Escherichia coli. Appl. Environ. Microbiol. 66:4972-4978. [DOI] [PMC free article] [PubMed] [Google Scholar]
- 11.Hein, J. R., A. Koschinsky, and A. N. Halliday. 2003. Global occurrence of tellurium-rich ferromanganese crusts and a model for the enrichment of tellurium. Geochim. Cosmochim. Acta 67:1117-1127. [Google Scholar]
- 12.Herbel, M. J., J. Switzer Blum, S. Borglin, and R. S. Oremland. 2003. Reduction of elemental selenium to selenide: experiments with anoxic sediments and bacteria that respire Se-oxyanions. Geomicrobiol. J. 20:587-602. [Google Scholar]
- 13.Herbel, M. J., T. M. Johnson, R. S. Oremland, and T. D. Bullen. 2000. Fractionation of selenium isotopes during bacterial respiratory reduction of selenium oxyanions. Geochim. Cosmochim. Acta 64:3701-3709. [Google Scholar]
- 14.Hobbie, J. E., R. L. Daley, and S. Jaspar. 1977. Use of nuclepore filters for counting bacteria for fluorescence microscopy. Appl. Environ. Microbiol. 33:1225-1228. [DOI] [PMC free article] [PubMed] [Google Scholar]
- 15.Jiang, Z.-Y., Z. X. Xie, X.-H. Zhang, S.-Y. Xie, R.-B. Huang, and L.-S. Zheng. 2004. Synthesis of alpha-tellurium dioxide nanorods from elemental tellurium by laser ablation. Inorg. Chem. Commun. 7:179-181. [Google Scholar]
- 16.Johnson, C. M., B. L. Beard, E. F. Roden, D. K. Newman, and K. H. Nealson. 2004. Isotopic constraints on biogeochemical cycling of Fe. Rev. Miner. Geochem. 55:359-408. [Google Scholar]
- 17.Johnson, T. M., M. J. Herbel, T. D. Bullen, and P. T. Zawislanski. 1999. Selenium isotope ratios as indicators of selenium sources and biogeochemical cycling. Geochim. Cosmochim. Acta 63:2775-2783. [Google Scholar]
- 18.Kirchhoff, F., N. Binggeli, G. Galli, and S. Massidda. 1994. Structural and bonding properties of solid tellurium from first-principles calculations. Phys. Rev. B 50:9063-9071. [DOI] [PubMed] [Google Scholar]
- 19.Klonowska, A., T. Heulin, and A. Vermeglio. 2005. Selenite and tellurite reduction by Shewanella oneidensis. Appl. Environ. Microbiol. 71:5607-5609. [DOI] [PMC free article] [PubMed] [Google Scholar]
- 20.Kulp, T. R., S. E. Hoeft, L. G. Miller, C. Saltikov, J. Nilsen, S. Han, B. Lanoil, and R. S. Oremland. 2006. Dissimilatory arsenate and sulfate reduction in sediments of two hypersaline, arsenic-rich soda lakes: Mono and Searles Lakes, California. Appl. Environ. Microbiol. 72:6514-6526. [DOI] [PMC free article] [PubMed] [Google Scholar]
- 21.Loss, R. D., K. J. R. Rosman, and J. R. DeLaeter. 1990. The isotopic composition of zinc, palladium, silver, cadmium, tin, and tellurium in acid-etched residues of the Allende meteorite. Geochim. Cosmochim. Acta 54:3525-3536. [Google Scholar]
- 22.Lovley, D. R., E. J. P. Phillips, T. A. Gorby, and E. J. Landa. 1991. Microbial reduction of uranium. Nature 350:413-416. [Google Scholar]
- 23.Moscoso, H., C. Saavedra, C. Loyola, S. Pichuantes, and C. Vásquez. 1998. Biochemical characterization of tellurite-reducing activities of Bacillus stearothemophilus V. Res. Microbiol. 149:389-397. [DOI] [PubMed] [Google Scholar]
- 24.O'Gara, J. P., M. Gomelsky, and S. Kaplan. 1997. Identification and molecular genetic analysis of multiple loci contributing to high-level tellurite resistance in Rhodobacter sphaeroides 2.4.1. Appl. Environ. Microbiol. 63:4713-4720. [DOI] [PMC free article] [PubMed] [Google Scholar]
- 25.Oremland, R. S., M. J. Herbel, J. Switzer Blum, S. Langley, T. J. Beveridge, T. Sutto, P. M. Ajayan, A. Ellis, and S. Curran. 2004. Structural and spectral features of selenium nanospheres formed by Se-respiring bacteria. Appl. Environ. Microbiol. 70:52-60. [DOI] [PMC free article] [PubMed] [Google Scholar]
- 26.Oremland, R. S., J. Switzer Blum, C. W. Culbertson, P. T. Visscher, L. G. Miller, P. Dowdle, and F. E. Strohmaier. 1994. Isolation, growth and metabolism of an obligately anaerobic, selenate-respiring bacterium, strain SES-3. Appl. Environ. Microbiol. 60:3011-3019. [DOI] [PMC free article] [PubMed] [Google Scholar]
- 27.Ortiz-Bernad, I., R. T. Anderson, H. A. Vrionis, and D. R. Lovley. 2004. Vanadium respiration by Geobacter metallireducens: novel strategy for in situ removal of vanadium from groundwater. Appl. Environ. Microbiol. 70:3091-3095. [DOI] [PMC free article] [PubMed] [Google Scholar]
- 28.Rathgeber, C., N. Yurkova, E. Stackebrandt, J. T. Beatty, and V. Yurkov. 2002. Isolation of tellurite- and selenite-resistant bacteria from hydrothermal vents of the Juan de Fuca Ridge in the Pacific Ocean. Appl. Environ. Microbiol. 68:4613-4622. [DOI] [PMC free article] [PubMed] [Google Scholar]
- 29.Schidlowski, M. 1987. Applications of stable carbon isotopes to early biochemical evolution on Earth. Annu. Rev. Earth Planet. Sci. 15:47-72. [Google Scholar]
- 30.Schröder, I., S. Rech, T. Krafft, and J. M. Macy. 1997. Purification and characterization of the selenate reductase from Thauera selenatis. J. Biol. Chem. 272:23765-23768. [DOI] [PubMed] [Google Scholar]
- 31.Shen, Y., R. Buick, and D. E. Canfield. 2001. Isotopic evidence for microbial sulphate reduction in the early Archean. Nature 410:77-81. [DOI] [PubMed] [Google Scholar]
- 32.Smith, R. L., F. E. Strohmaier, and R. S. Oremland. 1985. Isolation of anaerobic oxalate degrading bacteria from freshwater lake sediments. Arch. Microbiol. 14:8-13. [Google Scholar]
- 33.Smithers, R. M., and H. R. Krouse. 1967. Tellurium isotope fractionation study. Can. J. Chem. 46:583-591. [Google Scholar]
- 34.Stolz, J. F., P. Basu, J. M. Santini, and R. S. Oremland. 2006. Arsenic and selenium in microbial metabolism. Annu. Rev. Microbiol. 60:107-130. [DOI] [PubMed] [Google Scholar]
- 35.Stolz, J. F., D. J. Ellis, J. Switzer Blum, D. Ahmann, R. S. Oremland, and D. R. Lovley. 1999. Sulfurospirillum barnesii sp. nov., Sulfurospirillum arsenophilus sp. nov., and the Sulfurospirillum clade in the epsilon Proteobacteria. Int. J. Syst. Bacteriol. 49:1177-1180. [DOI] [PubMed] [Google Scholar]
- 36.Summers, A. O., and G. A. Jacoby. 1977. Plasmid-determined resistance to tellurium compounds. J. Bacteriol. 129:276-281. [DOI] [PMC free article] [PubMed] [Google Scholar]
- 37.Switzer Blum, J., A. Burns Bindi, J. Buzzelli, J. F. Stolz, and R. S. Oremland. 1998. Bacillus arsenicoselenatis sp. nov., and Bacillus selenitireducens sp. nov.: two haloalkaliphiles from Mono Lake, California which respire oxyanions of selenium and arsenic. Arch. Microbiol. 171:19-30. [DOI] [PubMed] [Google Scholar]
- 38.Tang, Z., Z. Zhang, Y. Wang, S. C. Glotzer, and N. A. Kotov. 2006. Self assembly of CdTe nanocrystals into free-floating sheets. Science 314:274-278. [DOI] [PubMed] [Google Scholar]
- 39.Taylor, D. E., Y. Hou, R. J. Turner, and J. H. Weiner. 1994. Location of a potassium tellurite resistance operon (tehAtehB) within the terminus of Escherichia coli K-12. J. Bacteriol. 176:2740-2742. [DOI] [PMC free article] [PubMed] [Google Scholar]
- 40.Tebo, B. M., and A. Obraztsova. 1998. Novel sulfate-reducing bacterium grows with Cr(VI), U(VI), Mn(IV), and Fe(III) as electron acceptors. FEMS Microbiol. Lett. 162:193-198. [Google Scholar]
- 41.Thauer, R. K., K. Jungermann, and K. Decker. 1977. Energy conservation in chemotrophic anaerobic bacteria. Microbiol. Rev. 4:100-180. [DOI] [PMC free article] [PubMed] [Google Scholar]
- 42.Trutko, S. M., V. K. Akimenko, N. E. Suzina, L. A. Anisomova, M. G. Shylapnikov, B. P Bashkunov, V. I. Duda, and A. M. Boronin. 2000. Involvement of the respiratory chain of gram negative bacteria in the reduction of tellurite. Arch. Microbiol. 173:178-186. [DOI] [PubMed] [Google Scholar]
- 43.Weiner, J. H., D. P. MacIssac, R. E. Bishop, and P. T. Bilous. 1988. Purification and properties of Escherichia coli dimethyl sulfoxide reductase, an iron-sulfur molybdoenzyme with broad substrate specificity. J. Bacteriol. 170:1505-1510. [DOI] [PMC free article] [PubMed] [Google Scholar]
- 44.Woods, T. L., and R. M. Garrels. 1987. Thermodynamic values at low temperature for inorganic materials: an uncritical summary. Oxford University Press, New York, NY.
- 45.Woolfolk, C. A., and H. R. Whiteley. 1962. Reduction of inorganic compounds with molecular hydrogen by Micrococcus lactilyticus. I. Stoichiometry with compounds of arsenic, selenium, tellurium, transition and other elements. J. Bacteriol. 84:647-658. [DOI] [PMC free article] [PubMed] [Google Scholar]
- 46.Yurkov, V., J. Jappé, and A. Verméglio. 1996. Tellurite resistance and reduction by obligately aerobic photosynthetic bacteria. Appl. Environ. Microbiol. 62:4195-4198. [DOI] [PMC free article] [PubMed] [Google Scholar]
- 47.Zhu, W., W. Wang, H. Xu, L. Zhou, L. Zhang, and J. J. Shi. 2006. Ultrasonic-induced growth of crystalline tellurium nanorods and related branched structures. J. Cryst. Growth 295:69-74. [Google Scholar]