Abstract
Background
While tumour necrosis factor α (TNF‐α) appears to be associated with the development of non‐alcoholic steatohepatitis (NASH), its precise role in the pathogenesis of NASH is not well understood.
Methods
Male mice deficient in both TNF receptors 1 (TNFR1) and 2 (TNFR2) (TNFRDKO mice) and wild‐type mice were fed a methionine and choline deficient (MCD) diet or a control diet for eight weeks, maintaining isoenergetic intake.
Results
MCD dietary feeding of TNFRDKO mice for eight weeks resulted in attenuated liver steatosis and fibrosis compared with control wild‐type mice. In the liver, the number of activated hepatic Kupffer cells recruited was significantly decreased in TNFRDKO mice after MCD dietary feeding. In addition, hepatic induction of TNF‐α, vascular cell adhesion molecule 1, and intracellular adhesion molecule 1 was significantly suppressed in TNFRDKO mice. While in control animals MCD dietary feeding dramatically increased mRNA expression of tissue inhibitor of metalloproteinase 1 (TIMP‐1) in both whole liver and hepatic stellate cells, concomitant with enhanced activation of hepatic stellate cells, both factors were significantly lower in TNFRDKO mice. In primary cultures, TNF‐α administration enhanced TIMP‐1 mRNA expression in activated hepatic stellate cells and suppressed apoptotic induction in activated hepatic stellate cells. Inhibition of TNF induced TIMP‐1 upregulation by TIMP‐1 specific siRNA reversed the apoptotic suppression seen in hepatic stellate cells.
Conclusions
Enhancement of the TNF‐α/TNFR mediated signalling pathway via activation of Kupffer cells in an autocrine or paracrine manner may be critically involved in the pathogenesis of liver fibrosis in this NASH animal model.
Keywords: tumour necrosis factor‐α, non‐alcoholic steatohepatitis, tissue inhibitor of metalloproteinase 1, kupffer cell, liver fibrosis
Based on imaging and autopsy studies, 20–30% of adults in the USA and Western countries have excess fat accumulation of the liver.1 Approximately 10% of these individuals, nearly 2–3% of adults, are estimated to meet the current diagnostic criteria for non‐alcoholic steatohepatitis (NASH). In a fraction of individuals with NASH, sustained liver injury leads to progressive fibrosis and cirrhosis. NASH may also be a cause of cryptogenic cirrhosis. The histopathological abnormalities of NASH, a common liver injury, mimic those of alcoholic steatohepatitis (ASH). Although the pathophysiological mechanisms leading to NASH development remain unclear, similar histological features and natural histories of this condition and ASH suggest that a common pathogenic mechanism might function in both conditions.2 In contrast with NASH, the pathogenesis of ASH has been studied in depth. Understanding the pathogenesis of ASH should help elucidate the pathogenesis of NASH.
Tumour necrosis factor α (TNF‐α) plays a major role in the in vivo pathogenesis of alcohol induced liver injury.3,4 As seen in ASH, treatment with anti‐TNF antibodies improves non‐alcoholic fatty liver disease in ob/ob mice.5 Crespo et al demonstrated that NASH patients with significant fibrosis exhibited increased expression of TNF‐α mRNA in comparison with those with minimal or non‐existent fibrosis.6 These results suggest that TNF‐α plays a critical role in the development of NASH.
TNF‐α interacts with two specific receptors, the p55 receptor, known as TNF receptor 1 (TNFR1), and the p75 receptor, known as TNF receptor 2 (TNFR2).7,8 All cells express both TNF receptors. The cytoplasmic domain of TNFR1 contains a Fas‐like “death domain”, suggesting that this receptor might mediate the lethal actions of TNF. In contrast, TNFR2, which lacks a death domain, was believed to transduce non‐cytotoxic TNF‐α initiated signals.9 Examination of mice lacking both receptors (TNFRDKO mice) however revealed blockade of the effects of TNF‐α.
Following administration of a methionine and choline deficient (MCD) diet, mice rapidly and consistently develop a severe form of steatohepatitis.10 The resulting characteristic pathology of steatosis, mixed cell inflammatory infiltrate, hepatocellular necrosis, and pericellular fibrosis mimics that found in humans with NASH.
In this study, we examined the requirement for TNF‐α/TNFR mediated signalling in the development of NASH after feeding TNFRDKO mice the MCD diet.
Materials and methods
Animal feeding
Eight week old male mice homozygous for both the Tnfrsf1atm1lmx and Tnfrsf1btm1lmx targeted mutations (p55 and p75 deficient) were purchased from Jackson Laboratories (Bar Harbor, Maine, USA). Male wild‐type B6129SF2/J mice were used as controls.
Mice, housed in temperature and light controlled rooms, were randomly divided into four groups: (A) knockout mice (−/− mice) fed the MCD diet for eight weeks (n = 8), (B) wild‐type mice (+/+ mice) pair fed the MCD diet for eight weeks (n = 8); (C) knockout mice (−/− mice) pair fed an isocaloric control diet for eight weeks (n = 8), and (D) wild‐type mice (+/+ mice) pair fed an isocaloric control diet for eight weeks (n = 8). The compositions of the liquid MCD and control diets were based on the MCD diet (cat No 960439; ICN, Aurora, Ohio, USA) and the control diet (cat No 960441; ICN). Mice in all groups B, C, and D were pair fed daily on an isoenergetic basis with the corresponding littermates fed the MCD diet (group A). Male Sprague‐Dawley rats weighing at least 400 g were randomly divided into two groups; one group of rats were fed the MCD diet for eight weeks while the other group of rats were pair fed an isocaloric control diet for eight weeks. All animals received humane care in compliance with the National Research Council's criteria outlined in the “Guide for the Care and Use of Laboratory Animals”, prepared by the US National Academy of Sciences and published by the US National Institutes of Health.
Biochemical and histological analysis
Serum alanine aminotransferase (ALT) activity was determined using a Fuji Dry‐Chem 5500 (Fuji Film, Tokyo, Japan). Hepatic triglyceride (TG) content was measured as previously described.11,12 Liver tissues were fixed in 4% paraformaldehyde, embedded in paraffin, and stained using an oil red O method in conjunction with haematoxylin‐eosin and a Masson‐trichrome solution. For protein or RNA analysis, tissues were frozen in liquid nitrogen and stored at −80°C until needed.
To measure hydroxyproline levels, liver tissues were stored for 24 hours in screw capped bottles with 5 ml of 12 N HCl at 4°C. After addition of 500 μl of each sample to 500 μl distilled water, samples were hydrolysed at 110°C for 20 hours. Supernatant (100 μl) was then mixed with 1.5 ml of 0.3 N hydroxylithium. The mixture (30 μl) was examined using a Hitachi L‐8500 High Speed Amino Acid Analyser (Hitachi Co., Hitachi, Tokyo, Japan). The quantity of hydroxyproline was expressed as μmol/g tissue.
Immunohistochemistry
Paraffinised sections were deparaffinised, rehydrated, blocked with normal horse serum, and incubated with anti‐α smooth muscle actin monoclonal antibody (mAb) 1A4 (36 μg/ml) (Dako Japan, Kyoto, Japan) and the anti‐F4/80 mAb (10 μg/ml) (Serotec, Oxford, UK) overnight at 4°C. The mouse F4/80 antigen is a 160 kDa glycoprotein expressed by mouse macrophages; antimouse F4/80 antibody binds mouse monocytes/macrophages and Kupffer cells. The antigen is not expressed by either lymphocytes or polymorphonuclear cells. Antibody binding was detected by incubation with biotinylated antimouse IgG antibody and visualised with a Vectastain Elite ABC Kit (Vector Laboratories, Inc. Burlingame, California, USA) by reaction with Vectastatin DAB Substrate (Vector).
Real time quantitative and reverse transcription‐polymerase chain reaction analysis
Total RNA was extracted from total liver homogenates or hepatic stellate cells using Isogen (Nippon Gene, Tokyo, Japan), as described by Tomita and colleagues.11,12,13 Reverse transcription and real time polymerase chain reaction (PCR) amplification were performed as previously described, using TaqMan assay reagent (Applied Biosystems, Foster City, California, USA).11,12 Reverse transcription‐PCR (RT‐PCR) was used to visualise differences in TNFR1 and TNFR2 mRNA expression levels in the whole livers of wild‐type and knockout mice using Takara Ex Taq DNA polymerase (Takara, Tokyo, Japan), as previously described.13
Western blot analysis
Total cellular protein (30 μg), isolated from snap frozen liver, was subjected to western blot analysis for prohibitin 1 (PHB1) and cytochrome oxidase subunit I (COX I). Membranes were probed with anti‐prohibitin mAb (Oncogene Research Products, San Diego, California, USA) or anti‐COX I mAb 1D6 (Molecular Probes, Inc. Leiden, the Netherlands).
Mitochondrial isolation and characterisation
A mitochondrial fraction was enriched from 100 mg liver specimens with the Mitochondria Isolation Kit (Sigma, St Louis, Missouri, USA) by two consecutive centrifugation steps at 600 g and 11 000 g. The electrochemical proton gradient (ΔΨ) of the inner mitochondrial membrane was tested by measuring the uptake of the fluorescent carbocyanine dye JC‐1 (Sigma) into mitochondria, as specified by the manufacturer.12,14 Relative ΔΨ was calculated in comparison with values obtained in control +/+ mice.
Isolation of hepatic stellate cells
Hepatic stellate cells were isolated from the livers of male SD rats (450–500 g) fed either the MCD diet or a pair fed control diet for eight weeks, as previously described.15 After seven days of culture, hepatic stellate cells were incubated for 20 hours in Eagle's minimum essential medium (EMEM) supplemented with 0.3% fetal bovine serum (FBS) in the presence or absence of 1 ng/ml TNF‐α.
Determination of cell apoptosis
Twenty hours after incubation under serum reduced conditions in the presence or absence of TNF‐α, hepatic stellate cell apoptosis was detected using a Cell Death Detection ELISA kit (Roche, Tokyo, Japan), according to the manufacturer's instructions. Caspase‐3 activity was also measured using the Caspase‐3 Activity Assay kit (Roche), as specified by the manufacturer.
TIMP‐1 gene silencing in hepatic stellate cell cultures
Double stranded siRNA specific for the rat tissue inhibitor of metalloproteinase 1 (TIMP‐1) exhibited the following sequences: 5′‐AGA UGA CUA AGA UGC UCA AAG GAU UAG‐3′ and 5′‐UAU CUA CUG AUU CUA CGA GUU UCC UAA‐3′. Hepatic stellate cells were treated with 5 nM siRNA in Ribo‐Juice siRNA transfection reagent (Novagen, Madison, Wisconsin, USA), according to the manufacturer's instructions. Cells cultured in Ribo‐Juice without siRNA were used as controls.
Statistical analysis
All data are expressed as mean (SEM). Statistical analyses were performed using the unpaired Student's t test or one way ANOVA.
Results
Effect of TNFR1 and TNFR2 deficiency on MCD diet induced liver steatosis
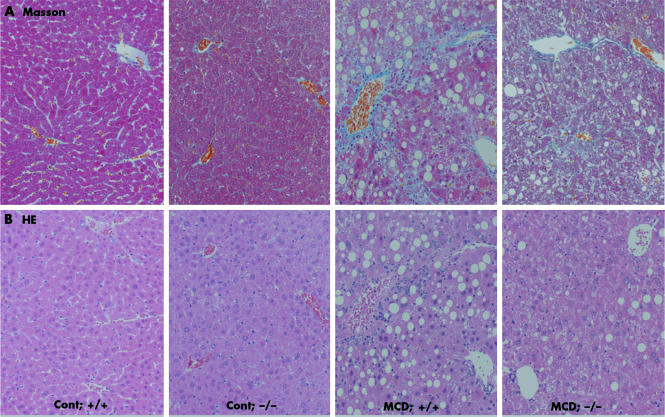
Administration of the MCD diet resulted in a significant increase in liver TG levels in both wild and TNFRDKO mice compared with levels observed after administering the control diet (fig 1). Hepatic TG concentrations in TNFRDKO mice given the MCD diet were 51.47 (8.88) mg/g liver weight while levels in wild‐type mice given the MCD diet were 107.3 (12.64) mg/g liver weight (fig 1A). Histological analysis also demonstrated increased accumulation of lipid droplets in hepatocytes, particularly in perivenular areas, in wild‐type mice given the MCD diet over the buildup seen in TNFRDKO mice given the MCD diet (figs 1B, 2B). Administration of the MCD diet decreased overall body weight and increased the liver/body weight ratio in both wild‐type and knockout mice. We did not observe any significant differences in either parameter between wild‐type and knockout mice (data not shown).
Figure 1 Effect of tumour necrosis factor receptor (TNFR) deficiency on methionine and choline deficient (MCD) diet induced steatohepatitis. (A) Hepatic triglyceride (TG) levels in each group. *p<0.05 compared with other groups; †p<0.05 compared with the control group. Control, mice pair fed an isocaloric liquid control diet; MCD, mice pair fed an isocaloric liquid MCD diet. (B) Oil red stained sections of representative liver samples derived from a control diet fed +/+ mouse (Cont; +/+), a control diet fed −/− mouse (Cont; −/−), an MCD diet fed +/+ mouse (MCD; +/+), and an MCD diet fed −/− mouse (MCD; −/−) (×100). Specific staining of lipid accumulation is shown. (C) Serum alanine aminotransferase (ALT) activity was measured in each of the treated groups. *p<0.05 compared with the control group. (D) Expression of TNFR1 and TNFR2 mRNA levels were normalised to glyceraldehyde‐3‐phosphate dehydrogenase (GAPDH) levels in whole liver of wild‐type and knockout mice. TNFR1 (197 bp; TNFR1 forward, 5′‐CAG TCT GCA GGG AGT GTG AA‐3′; TNFR1 reverse, 5′‐CAC GCA CTG GAA GTG TGT CT‐3′), TNFR2 (153 bp; TNFR2 forward, 5′‐GTC TTC GAA CTG CAG CTG TG‐3′; TNFR2 reverse, 5′‐GCC AGG AGG ACA CTT AGC AC‐3′), and GAPDH (223 bp; GAPDH forward, 5′‐AAC TTT GGC ATT GTG GAA GG‐3′; GAPDH reverse, 5′‐ACA CAT TGG GGG TAG GAA CA‐3′) were amplified using the indicated primers over 35 cycles with an annealing temperature of 55°C with Takara Ex Taq DNA polymerase. Polymerase chain reaction products were separated on a 2% agarose gel containing ethidium bromide.
Figure 2 Effect of tumour necrosis factor receptor (TNFR) deficiency on liver fibrosis induced by methionine and choline deficient (MCD) dietary feeding. Liver histology of wild‐type mice fed the MCD diet exhibited moderate steatohepatitis. These samples displayed severe perivenular macrovesicular steatosis, numerous inflammatory foci with infiltrating neutrophils and mononuclear cells, and scattered pericellular fibrosis. (A) Masson trichrome (Masson) stained sections of representative liver samples derived from a control diet fed +/+ mouse (Cont; +/+), a control diet fed −/− mouse (Cont; −/−), an MCD diet fed +/+ mouse (MCD; +/+), and an MCD diet fed −/− mouse (MCD; −/−) (×100). (B) Haematoxylin‐eosin (HE) stain of representative liver sections prepared from a control diet fed +/+ mouse (Cont; +/+), a control diet fed −/− mouse (Cont; −/−), an MCD diet fed +/+ mouse (MCD; +/+), and an MCD diet fed −/− mouse (MCD; −/−) (×100).
To assess the effect of the combination of the MCD diet and TNF‐α on liver function, we analysed serum ALT activity. ALT levels were elevated in both wild‐type and TNFRDKO mice after an eight week MCD feeding period. There were no significant differences, however, between the two groups in the levels measured (fig 1C). To confirm the deficiency in both TNFR1 and TNFR2 mRNA expression in TNFRDKO mice, we performed RT‐PCR analysis of whole liver homogenates derived from wild‐type and knockout mice. There was no detectable expression of TNFR1 or TNFR2 mRNA in the livers of TNFRDKO mice (fig 1D).
Deficiency of TNFR1 and TNFR2 reduces liver fibrosis after MCD dietary feeding
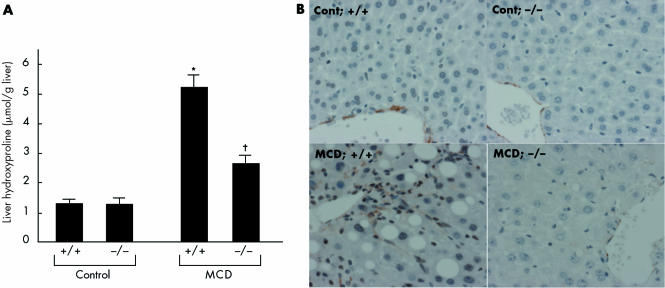
After MCD dietary feeding, the livers of wild‐type mice exhibited increased collagen deposition, conspicuously localised around the central vein and throughout the lobule in a pericellular distribution (fig 2A). In contrast, the extent of the centrizonal fibrosis was markedly reduced in livers of TNFRDKO mice (fig 2A). The livers of MCD fed wild‐type mice also exhibited increased staining for α‐smooth muscle actin, a marker of stellate cell activation in areas of damage; TNFR1 and TNFR2 deficiency, however, reduced this pathology (fig 3B). Extraction and quantitation of liver hydroxyproline amounts confirmed the microscopic results. Liver hydroxyproline concentrations in TNFRDKO and wild‐type mice given the MCD diet were 2.77 (0.28) and 5.45 (0.44) μmol/g liver weight, respectively (fig 3A). In contrast, liver hydroxyproline levels in animals given an isocaloric control diet were as low as 1.36 (0.28) and 1.32 (0.21) μmol/g liver weight in wild‐type mice and TNFRDKO mice, respectively.
Figure 3 Effect of tumour necrosis factor receptor (TNFR) deficiency on liver fibrosis induced by methionine and choline deficient (MCD) dietary feeding. (A) Liver hydroxyproline concentrations in the treated groups. *p<0.05 compared with the other groups; †p<0.05 compared with the control group. Control, mice pair fed an isocaloric liquid control diet; MCD, mice pair fed an isocaloric liquid MCD diet. (B) Immunohistochemical staining for α‐smooth muscle actin. Representative liver samples derived from control diet fed +/+ (Cont; +/+), control diet fed −/− (Cont; −/−), MCD diet fed +/+ (MCD; +/+), and MCD diet fed −/− (MCD; −/−) mice (×100).
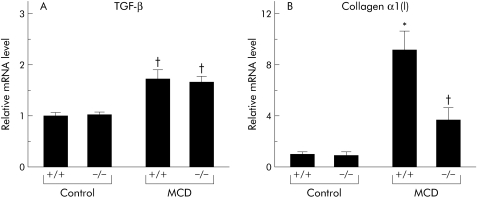
Real time PCR analysis of whole liver homogenates of MCD diet fed mice showed a significant increase in α1(I) collagen and transforming growth factor β (TGF‐β) mRNA levels in comparison with control diet fed mice (fig 4). While the livers of knockout mice exhibited significantly reduced induction of collagen α1 (I) mRNA after MCD dietary feeding, TNFR1/TNFR2 deficiency had no impact on induction of TGF‐β mRNA in the livers of MCD fed mice (fig 4).
Figure 4 Effect of tumour necrosis factor receptor (TNFR) deficiency on liver fibrosis induced by methionine and choline deficient (MCD) dietary feeding. (A) Hepatic transforming growth factor β (TGF‐β) and collagen α1(I) (B) expression levels. Real time polymerase chain reaction (PCR) analysis was used to quantitate hepatic mRNA levels of TGF‐β (Α) and collagen α1(I) (B) from liver homogenates isolated from each group. Results (mean (SEM)) of five mice/group at the end of the feeding period are shown. All real time quantitative PCR reactions were performed in duplicate. *p<0.05 compared with the other groups; †p<0.05 compared with the control group. Control, mice pair fed an isocaloric liquid control diet; MCD, mice pair fed an isocaloric liquid MCD diet.
Effect of TNFR1/TNFR2 deficiency on intrahepatic recruitment and activation of Kupffer cells and induction of adhesion molecules and TNF‐α
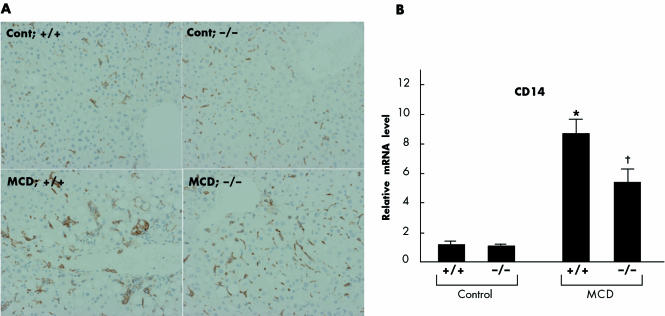
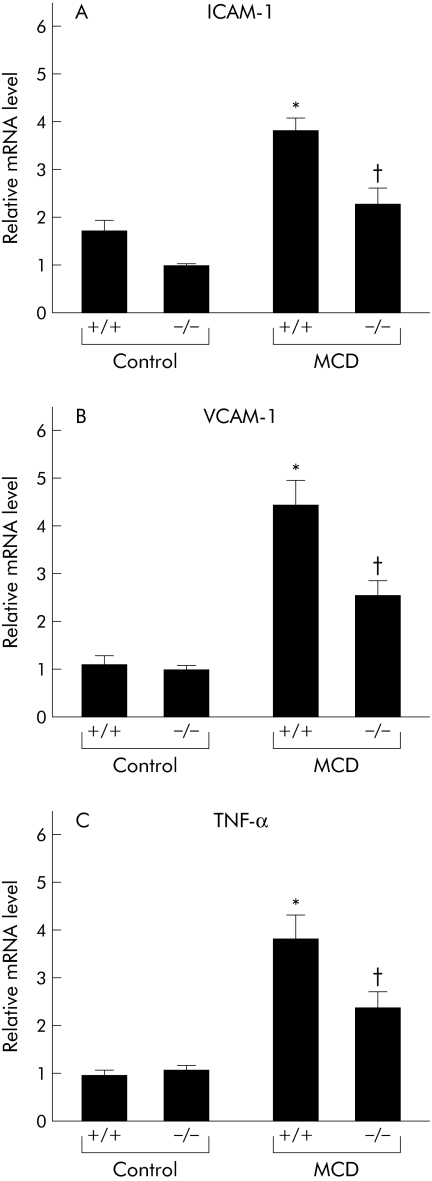
While administration of the MCD diet for eight weeks augmented the number of large macrophage clusters preferentially distributed to pericentral regions, TNFR1/TNFR2 deficiency reduced this recruitment (fig 5A). As expression of CD14, a functional lipopolysaccharide (LPS) receptor, is enhanced on Kupffer cells following activation by multiple stimuli such as LPS and TNF‐α, we next examined CD14 mRNA levels by real time PCR. This analysis demonstrated that an eight week MCD dietary feeding period increased hepatic CD14 expression; this induction was reduced in the livers of knockout mice (fig 5B). We also discovered that MCD dietary feeding significantly increased hepatic intracellular adhesion molecule 1 (ICAM‐1) and vascular cell adhesion molecule 1 (VCAM‐1) expression; this induction was also abrogated in the livers of knockout mice (fig 6A, B).
Figure 5 Effect of tumour necrosis factor receptor (TNFR) deficiency on activation of Kupffer cells during methionine and choline deficient (MCD) diet induced steatohepatitis. (A) Immunohistochemical detection of F4/80 positive cells in the liver. To identify the infiltrating cell types, we performed immunohistochemical analysis using a monoclonal antibody specific for F4/80 antigen, a surface marker of mouse monocytes/macrophages and Kupffer cells. Representative liver samples derived from control diet fed +/+ (Cont; +/+), control diet fed −/− (Cont; −/−), MCD diet fed +/+ (MCD; +/+), and MCD diet fed −/− (MCD; −/−) mice (×100). B: Hepatic CD14 expression levels. Results (mean (SEM)) of five mice/group at the end of the feeding period are shown. All real time quantitative polymerase chain reactions were performed in duplicate. *p<0.05 compared with the other groups; †p<0.05 compared with the control group. Control, mice pair fed an isocaloric liquid control diet; MCD, mice pair fed an isocaloric liquid MCD diet.
Figure 6 Effect of tumour necrosis factor receptor (TNFR) deficiency on activation of Kupffer cells during methionine and choline deficient (MCD) diet induced steatohepatitis. (A) Hepatic intracellular adhesion molecule 1 (ICAM‐1), (B) vascular cell adhesion molecule 1 (VCAM‐1), and (C) tumour necrosis factor α (TNF‐α) expression levels. Real time polymerase chain reaction analysis quantitated hepatic mRNA levels of ICAM‐1, VCAM‐1, and TNF‐α in liver homogenates from each group. Results (mean (SEM)) of five mice/group at the end of the feeding period are shown. All real time quantitative polymerase chain reactions were performed in duplicate. *p<0.05 compared with the other groups; †p<0.05 compared with the control group. Control, mice pair fed an isocaloric liquid control diet; MCD, mice pair fed an isocaloric liquid MCD diet.
As Kupffer cells are the primary source of hepatic TNF‐α, we compared hepatic TNF‐α mRNA levels between the treated groups by real time PCR analysis. Feeding for eight weeks with the MCD diet enhanced hepatic TNF‐α levels; cytokine levels were significantly increased in MCD diet fed wild‐type mice compared with MCD diet fed TNFRDKO mice (fig 6C).
Effect of an eight week MCD feeding period on hepatic expression of genes involved in steatosis in wild‐type and knockout mice
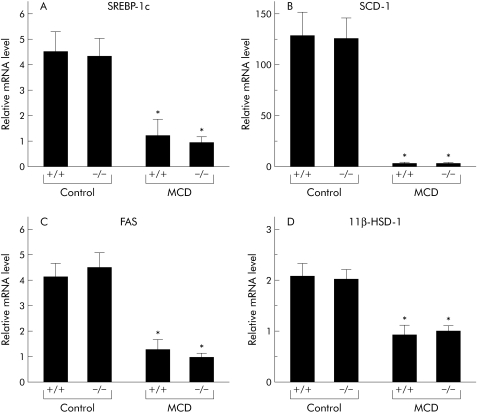
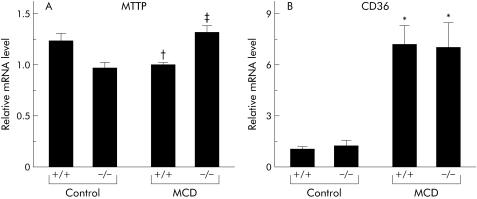
To elucidate the mechanisms by which MCD dietary feeding augments hepatic lipid contents and how deficiency in TNFR1 and TNFR2 attenuated this change, we examined hepatic levels of sterol regulatory response element binding protein 1c (SREBP‐1c), stearoyl‐CoA desaturase 1 (SCD‐1), fatty acid synthase (FAS), and 11β‐hydroxysteroid dehydrogenase 1 (HSD‐1) mRNA by real time PCR. While administration of the MCD diet dramatically decreased hepatic mRNA levels of these genes, TNFR1/TNFR2 deficiency had no impact on expression (fig 7A–D). After a period of MCD feeding, levels of mRNA encoding hepatic microsomal TG transfer protein (MTTP) were significantly higher in knockout mice than in wild‐type mice (fig 8A). MCD dietary feeding also enhanced hepatic levels of CD36 mRNA expression; TNFR1/TNFR2 deficiency had no impact on CD36 levels (fig 8B).
Figure 7 Expression levels of genes functioning in the development of steatosis and steatohepatitis in the treated groups. Hepatic expression levels of (A) sterol regulatory response element binding protein 1c (SREBP‐1c), (B) stearoyl‐CoA desaturase 1 (SCD‐1), (C) fatty acid synthase (FAS), and (D) 11β‐hydroxysteroid dehydrogenase 1 (HSD‐1) were measured using real time polymerase chain reaction (PCR). Results (mean (SEM)) of five mice/group at the end of the feeding period are shown. All real time quantitative PCR reactions were performed in duplicate. *p<0.05 compared with the control groups. Control, mice pair fed an isocaloric liquid control diet; MCD, mice pair fed an isocaloric liquid MCD diet.
Figure 8 Expression levels of genes functioning in the development of steatosis and steatohepatitis in the treated groups. Hepatic expression levels of (A) microsomal triglyceride transfer protein (MTTP) and (B) CD36 were evaluated by real time polymerase chain reaction (PCR) analysis of liver homogenates. Results (mean (SEM)) of five mice/group at the end of the feeding period are shown. All real time quantitative PCR reactions were performed in duplicate. *p<0.05 compared with the control groups; †p<0.05 compared with the control +/+ group; ‡p<0.05 compared with the control −/− and MCD +/+ groups. Control, mice pair fed an isocaloric liquid control diet; MCD, mice pair fed an isocaloric liquid MCD diet.
Effect of an eight week MCD feeding period on mitochondrial proteins and function in wild‐type and knockout mice
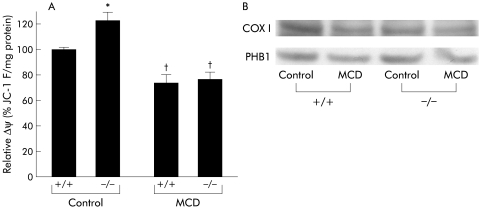
As alteration of mitochondrial function may be a key factor in the progression of NASH, we examined mitochondrial protein levels and function in the livers of treated animals. We measured mitochondrial inner membrane potential in a mitochondria enriched fraction purified from liver extracts of treated mice. MCD dietary feeding significantly decreased the electrochemical proton gradient, indicating defects in mitochondrial inner membrane integrity.14 Again, TNFR1/TNFR2 deficiency did not alter these results (fig 9A). Western blotting analysis demonstrated that PHB1 and COX I protein levels decreased after MCD dietary feeding, with no significant differences observed between the knockout and wild‐type animals (fig 9B).
Figure 9 Effect of tumour necrosis factor receptor (TNFR) deficiency on mitochondrial protein expression and function. (A) We measured the electrochemical proton gradient of the inner mitochondrial membrane. Mitochondrial function was examined by measuring ΔΨ in mitochondrial enriched fractions isolated from five mice/group at the end of the feeding period. The calculated relative ΔΨ was normalised to the values obtained in control +/+ mice. *p<0.05 compared with the control +/+ group; †p<0.05 compared with the other groups. (B) Hepatic prohibitin 1 (PHB1) and cytochrome oxidase subunit I (COX I) protein levels in treated animals. Control, mice pair fed an isocaloric liquid control diet; MCD, mice pair fed an isocaloric liquid MCD diet.
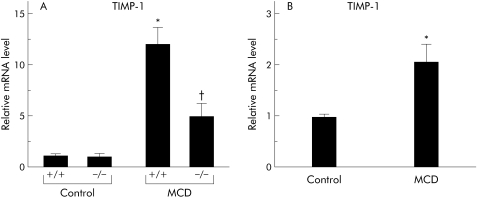
An eight week MCD dietary feeding period dramatically increased hepatic TIMP‐1 mRNA expression while TNFR1/TNFR2 deficiency significantly decreased it
Real time PCR analysis indicated that MCD dietary feeding for eight weeks markedly enhanced hepatic TIMP‐1 mRNA expression. mRNA levels were significantly lower in MCD diet fed knockout mice than those seen in MCD diet fed wild‐type mice (fig 10A). As TIMP‐1 is a major synthetic product of activated hepatic stellate cells, we examined TIMP‐1 mRNA levels by real time PCR analysis of hepatic stellate cells isolated from rats fed an MCD diet or pair fed a control diet. Administration of the MCD diet significantly increased TIMP‐1 mRNA levels in hepatic stellate cells (fig 10B).
Figure 10 Effect of tumour necrosis factor (TNF) on apoptosis induction through changes in tissue inhibitor of metalloproteinase 1 (TIMP‐1) expression. We examined TIMP‐1 expression in whole liver tissues and in hepatic stellate cells isolated from each of the treated groups. (A) Hepatic TIMP‐1 expression levels in the treated groups. Results (mean (SEM)) of five mice/group examined at the end of the feeding period. All real time quantitative polymerase chain reaction (PCR) reactions were performed in duplicate. *p<0.05 compared with the other groups; †p<0.05 compared with the control group. (B) TIMP‐1 expression levels in hepatic stellate cells isolated from rats fed either an methionine and choline deficient (MCD) or control isocaloric diet for eight weeks. Results (mean (SEM)) of three rats/group examined at the end of feeding period are shown. All real time quantitative PCR reactions were performed in duplicate. *p<0.05 compared with the control group. Control, animals pair fed an isocaloric liquid control diet; MCD, animals pair fed an isocaloric liquid MCD diet.
TNF‐α exerted antiapoptotic effects on activated hepatic stellate cells through activation of TIMP‐1
After a seven day culture period, hepatic stellate cells were treated in the presence or absence of 5 nM TIMP‐1 siRNA for 24 hours in EMEM supplemented with 10% FBS. Cells were then incubated for 20 hours in EMEM supplemented with 0.3% FBS in the presence or absence of 1 ng/ml TNF‐α. Real time PCR analysis demonstrated that addition of TNF‐α significantly increased levels of TIMP‐1 mRNA in activated hepatic stellate cells; treatment with TIMP‐1 siRNA markedly suppressed this increase (fig 11A). Using an ELISA assay kit, we determined that TNF‐α administration also suppressed induction of apoptosis in primary cultured hepatic stellate cells; again, TIMP‐1 siRNA significantly reversed this effect (fig 11B). A caspase‐3 activity assay also indicated that TNF‐α significantly reduced caspase‐3 activity in activated hepatic stellate cells. Inhibition of TIMP‐1 induction by siRNA treatment resulted in significant enhancement of caspase‐3 activity (fig 11C).
Figure 11 Effect of tumour necrosis factor (TNF) on apoptosis induction through changes in tissue inhibitor of metalloproteinase 1 (TIMP‐1) expression. We showed the effect of TNF‐α on apoptosis induction and caspase‐3 activity in activated hepatic stellate cells through upregulation of TIMP‐1. (A) TIMP‐1 expression was examined in activated hepatic stellate cells at 20 hours after addition of TNF‐α and/or TIMP‐1 siRNA. All real time quantitative polymerase chain reaction (PCR) reactions were performed in duplicate. Results (mean (SEM)) of four individual experiments are shown. *p<0.05 compared with the other groups. (B) Hepatic stellate cell apoptosis was detected by ELISA kit. The apoptotic index in activated hepatic stellate cells was analysed 20 hours after addition of TNF‐α and/or TIMP‐1 siRNA. Results (mean (SEM)) of four individual experiments are displayed. *p<0.05 compared with the other groups. (C) Caspase‐3 activity in activated hepatic stellate cells was assessed 20 hours after addition of TNF‐α and/or TIMP‐1 siRNA. Results (mean (SEM)) of four individual experiments are shown. *p<0.05 compared with the other groups.
Discussion
This study is the first to suggest that deficiency of TNFR1/TNFR2 reduces liver steatosis and fibrosis after MCD dietary exposure. Our observations confirm the critical roles of TNFR1/TNFR2 signalling in the pathophysiology of NASH. MCD dietary feeding induces the development of a steatohepatitis in rodents that is histologically similar to human NASH. Using this animal model, our study presents several lines of evidence that implicate TNFR1 and TNFR2 as potential therapeutic targets for the treatment of NASH.
Hepatic Kupffer cells, the primary source of hepatic TNF‐α,16 were recruited and activated in our nutritional model of NASH. TNF‐α is thought to regulate Kupffer cell activation through both autocrine and paracrine mechanisms.17 This regulation may explain how TNFR1/TNFR2 deficiency ameliorated enhancement of hepatic TNF‐α mRNA expression levels seen in MCD fed mice. We also demonstrated that expression of VCAM‐1 and ICAM‐1, two adhesion molecules facilitating leucocyte recruitment, were upregulated in MCD fed mice. Defects in TNFR signalling reversed this upregulation. TNFR signalling exerts an effect on endothelial cell adhesion via regulatory effects on nuclear factor κB, a transcription factor involved in expression of multiple adhesion molecules, including VCAM‐1 and ICAM‐1.18 Our observations suggest that enhanced expression of VCAM‐1 and ICAM‐1 on Kupffer and endothelial cells would likely recruit additional Kupffer cells, leading to exaggerated release of TNF‐α from Kupffer cells. Enhancement of TNF‐α secretion, resulting from both autocrine and paracrine action, may be involved in the pathogenesis of this animal model of steatohepatitis.
In our nutritional model, MCD dietary feeding augmented the liver fibrosis in wild‐type mice from levels seen in knockout mice. As TGF‐β is one of the central fibrogenic factors involved in collagen synthesis, we examined hepatic TGF‐β mRNA expression following MCD dietary feeding. While hepatic TGF‐β mRNA expression was upregulated in MCD fed mice, TNFR1/TNFR2 signalling deficiency had no impact on TGF‐β enhancement. In contrast, the absence of both TNFR1 and TNFR2 attenuated activation of hepatic stellate cells, suppressing the subsequent enhancement of collagen α1 and TIMP‐1 mRNA expression in the liver after MCD diet administration. Furthermore, our in vitro study also demonstrated that TNF‐α directly augments TIMP‐1 expression in hepatic stellate cells, exerting an antiapoptotic effect on activated hepatic stellate cells via activation of TIMP‐1. In support of these results, activated hepatic stellate cells are reported to induce increases in TIMP‐1 mRNA expression during the development of liver fibrosis; TIMP‐1 inhibited hepatic stellate cell apoptosis with reducing caspase‐3 activity.19 In addition, administration of anti‐TIMP‐1 antibodies attenuated liver fibrosis and decreased hepatic stellate cell activation,20 suggesting that TNF‐α dependent, TGF‐β independent pathways play a crucial role in induction of liver fibrosis by MCD dietary feeding. Enhanced production of TNF‐α by activated Kupffer cells may augment TIMP‐1 production in activated hepatic stellate cells. The subsequent reduction in hepatic stellate cell apoptosis from autocrine mechanisms may exaggerate liver fibrosis. Inhibition of macrophage infiltration into the liver inhibits activation of hepatic stellate cells, suppressing liver fibrosis.21 A recent report by Duffield et al suggests that macrophage depletion increases myofibroblast numbers, again leading to augmentation of liver fibrogenesis.22 In conjunction with our findings, these results suggest that the production of TNF‐α by infiltrating Kupffer cells may play a key role in the pathogenesis of liver fibrosis in multiple hepatic diseases, including the MCD diet induced animal model of NASH.
This study also demonstrated that hepatic expression of lipogenic genes, such as SREBP‐1, SCD, FAS, and 11β HSD‐1, dramatically decreased after administration of the MCD diet. Induction of TG synthesis is highly dependent on enhancement of SREBP‐1 expression; the target genes of these molecules include SCD‐1 and FAS, suggesting that hepatic steatosis in MCD fed mice is not dependent on TG synthesis mediated by lipogenic enzymes. On the other hand, mobilisation of lipids from hepatocytes is also involved in the pathogenesis of hepatic steatosis. In this study, absence of TNF‐α signalling enhanced expression of hepatic MTTP, a protein that transfers TGs to nascent apolipoprotein B to produce very low density lipoprotein and remove lipids from hepatocytes.23 A recent report indicated that functional polymorphisms in the MTTP gene may determine susceptibility of patients to NASH.23 These results suggest that upregulation of hepatic MTTP expression may be one of mechanisms underlying improvement of the steatosis observed in TNFRDKO mice. We also demonstrated that MCD dietary feeding impaired mitochondrial function. Steady state levels of the mitochondrial proteins PHB1 and COX I were diminished significantly in the MCD diet fed groups. As both PHB1, a nuclear gene product, and COX I, a mitochondrial encoded gene, are involved in mitochondrial respiration, downregulation of both of these mitochondrial proteins in our nutritional model would likely cause impaired mitochondrial function within the liver. Hepatic S‐adenosylmethionine synthesis has been reported to function in the regulation of both mitochondrial protein expression and function.14 As S‐adenosylmethionine is synthesised from methionine and ATP precursors, methionine deficiency may exaggerate the mitochondrial dysfunction seen in MCD diet induced steatohepatitis. In our nutritional model, TNFR1/TNFR2 mediated signalling did not appear to be responsible for the mitochondrial damage seen in hepatocytes. A recent report indicated that mitochondrial overproduction of reactive oxygen species contributed significantly to the hepatocyte injury observed in NASH.24 These results may explain the lack of significant differences in serum ALT activities between wild‐type and knockout mice after MCD dietary feeding seen in our study.
In summary, our results demonstrated that TNFR1/TNFR2 deficiency improved the hepatic steatosis and fibrosis present in MCD fed steatohepatitis. Enhancement of TNF‐α signalling following activation of Kupffer cells in either an autocrine or paracrine manner may be critical in the pathogenesis of hepatic steatosis and fibrosis in this nutritional model. Our present study suggests that blockade of TNFR1/TNFR2 signalling is a promising therapeutic target for the prevention and treatment of hepatic steatosis and fibrosis in NASH.
Acknowledgement
The authors thank H Koizumi, H Ochiai, and E Tokubo for technical assistance.
Abbreviations
TNF‐α - tumour necrosis factor α
NASH - non‐alcoholic steatohepatitis
ASH - alcoholic steatohepatitis
TNFR - tumour necrosis factor receptor
TNFRDKO mice - mice deficient in both TNFR1 and TNFR2
MCD - methionine and choline deficient
VCAM - vascular cell adhesion molecule
ICAM - intracellular adhesion molecule
PHB - prohibitin
COX - cytochrome oxidase subunit
TIMP - tissue inhibitor of metalloproteinase
TGF‐β - transforming growth factor β
SREBP - sterol regulatory response element binding protein
SCD - stearoyl‐CoA desaturase
FAS - fatty acid synthase
HSD - hydroxysteroid dehydrogenase
MTTP - microsomal triglyceride transfer protein
TG - triglyceride
ALT - alanine aminotransferase
mAb - monoclonal antibody
EMEM - Eagle's minimum essential medium
FBS - fetal bovine serum
LPS - lipopolysaccharide
Footnotes
Conflict of interest: None declared.
References
- 1.Neuschwander‐Tetri B A, Caldwell S H. Nonalcoholic steatohepatitis: Summary of an AASLD Single Topic Conference. Hepatology 2003371202–1219. [DOI] [PubMed] [Google Scholar]
- 2.Ishii H. Common pathogenic mechanisms in ASH and NASH. Hepatol Res 20042818–20. [DOI] [PubMed] [Google Scholar]
- 3.Iimuro Y, Gallucci R M, Luster M I.et al Antibodies to tumor necrosis factor alpha attenuates hepatic necrosis and inflammation due to chronic exposure to ethanol in the rat. Hepatology 1997261530–1537. [DOI] [PubMed] [Google Scholar]
- 4.Yin M, Wheeler M D, Kono H.et al Essential role of tumor necroses factor alpha in alcohol‐induced liver injury in mice. Gastroenterology 1999117942–952. [DOI] [PubMed] [Google Scholar]
- 5.Li Z, Yang S, Lin H.et al Probiotics and antibodies to TNF inhibit inflammatory activity and improve nonalcoholic fatty liver disease. Hepatology 200337343–350. [DOI] [PubMed] [Google Scholar]
- 6.Crespo J, Cayon A, Fernandez‐Gil P.et al Gene expression of tumor necrosis factor alpha and TNF‐receptors, p55 and p75, in nonalcoholic steatohepatitis patients. Hepatology 2001341158–1163. [DOI] [PubMed] [Google Scholar]
- 7.Gruss H J, Dower S K. The TNF ligand superfamily and its relevance for human diseases. Cytokines Mol Ther 1995175–105. [PubMed] [Google Scholar]
- 8.Darnay B G, Aggarwal B B. Early events in TNF signaling: A story of associations and dissociations. J Leukoc Biol 199761559–565. [DOI] [PubMed] [Google Scholar]
- 9.Medvedev A E, Espevik T, Ranges G.et al Distinct roles of the two tumor necrosis factor (TNF) receptors in modulating TNF and lymphotoxin alpha effects. J Biol Chem 19962719778–9784. [DOI] [PubMed] [Google Scholar]
- 10.Leclercq I A, Farrell G C, Field J.et al CYP2E1 and CYP4A as microsomal catalysts of lipid peroxides in murine nonalcoholic steatohepatitis. J Clin Invest 20001051067–1075. [DOI] [PMC free article] [PubMed] [Google Scholar]
- 11.Tomita K, Azuma T, Kitamura N.et al Pioglitazone prevents alcohol‐induced fatty liver in rats through up‐regulation of c‐Met. Gastroenterology 2004126873–885. [DOI] [PubMed] [Google Scholar]
- 12.Tomita K, Azuma T, Kitamura N.et al Leptin deficiency enhances sensitivity of rats to alcoholic steatohepatitis through suppression of metallothionein. Am J Physiol Gastrointest Liver Physiol 2004287G1078–G1085. [DOI] [PubMed] [Google Scholar]
- 13.Tomita K, Sato M, Kajiwara K.et al Gene structure and promoter for Crad2 encoding mouse cis‐retinol/3alpha‐hydroxysterol short‐chain dehydrogenase isozyme. Gene 2000251175–186. [DOI] [PubMed] [Google Scholar]
- 14.Santamaria E, Avila M A, Latasa M U.et al Functional proteomics of nonalcoholic steatohepatitis: Mitochondrial proteins as targets of S‐adenosylmethionine. Proc Natl Acad Sci USA 20031003065–3070. [DOI] [PMC free article] [PubMed] [Google Scholar]
- 15.Toda K, Kumagai N, Tsuchimoto K.et al Induction of hepatic stellate cell proliferation by LPS‐stimulated peripheral blood mononuclear cells from patients with liver cirrhosis. J Gastroenterol 200035214–220. [DOI] [PubMed] [Google Scholar]
- 16.Su G L. Lipopolysaccharides in liver injury: molecular mechanisms of Kupffer cell activation. Am J Physiol Gastrointest Liver Physiol 2002283G256–G265. [DOI] [PubMed] [Google Scholar]
- 17.Kitamura K, Nakamoto Y, Akiyama M.et al Pathogenic roles of tumor necrosis factor receptor p55‐mediated signals in dimethylnitrosamine‐induced murine liver fibrosis. Lab Invest 200282571–583. [DOI] [PubMed] [Google Scholar]
- 18.Mackay F, Loetscher H, Stueber D.et al Tumor necrosis factor alpha‐induced cell adhesion to human endothelial cells in under dominant control of one TNF receptor type, TNF‐R55. J Exp Med 19931771277–1286. [DOI] [PMC free article] [PubMed] [Google Scholar]
- 19.Yoshiji H, Kuriyama S, Yoshii J.et al Tissue inhibitor of metalloproteinases‐1 attenuates spontaneous liver fibrosis resolution in the transgenic mouse. Hepatology 200236850–860. [DOI] [PubMed] [Google Scholar]
- 20.Parsons C J, Bradford B U, Pan C Q.et al Antifibrotic effects of a tissue inhibitor of metalloproteinase‐1 antibody on established liver fibrosis in rats. Hepatology 2004401106–1115. [DOI] [PubMed] [Google Scholar]
- 21.Imamura M, Ogawa T, Sasaguri Y.et al Suppression of macrophage infiltration inhibits activation of hepatic stellate cells and liver fibrogenesis in rats. Gastroenterology 2005128138–146. [DOI] [PubMed] [Google Scholar]
- 22.Duffield J S, Forbes S J, Constandinou C M.et al Selective depletion of macrophages reveals distinct, opposing roles during liver injury and repair. J Clin Invest 200511556–65. [DOI] [PMC free article] [PubMed] [Google Scholar]
- 23.Namikawa C, Shu‐Ping Z, Vyselaar J R.et al Polymorphisms of microsomal triglyceride transfer protein gene and manganese superoxide dismutase gene in non‐alcoholic steatohepatitis. J Hepatol 200440781–786. [DOI] [PubMed] [Google Scholar]
- 24.Laurent A, Nicco C, Tran Van Nhieu J.et al Pivotal role of superoxide anion and beneficial effect of antioxidant molecules in murine steatohepatitis. Hepatology 2004391277–1285. [DOI] [PubMed] [Google Scholar]


