Abstract
Background and aims
Transforming growth factor β (TGF‐β) is frequently involved in gastrointestinal carcinogenesis although its contribution to oesophageal adenocarcinoma (AC) and its precursor Barrett's oesophageal epithelium (BE) metaplasia are unclear.
Methods
Expression of TGF‐β signalling components was assessed by reverse transcription‐polymerase chain reaction (PCR), western blot, and immunohistochemistry in oesophageal endoscopic biopsies and cell lines. Genomic alterations in SMAD4 were characterised by fluorescence in situ hybridisation, methylation specific PCR, and sequencing. Functional integrity of TGF‐β signalling was assessed by characterisation of p21 and proliferation status. Smad4 negative BIC‐1 cells were transiently transfected with smad4 and TGF‐β responsiveness evaluated.
Results
smad4 mRNA expression was progressively reduced in the metaplasia‐dysplasia‐adenocarcinoma sequence (p<0.01). A quarter of AC samples displayed an abnormal Smad4 protein isoform, with no corresponding changes in gene sequence or organisation. Methylation of smad4 has not been described previously but we found promoter methylation in 70% of primary AC samples. In 6/8 oesophageal cell lines, chromosomal rearrangements affected the smad4 locus. Lack of smad4 expression in BIC‐1 cells occurred secondary to loss of one copy and extensive deletion of the second allele's promoter region. TGF‐β dependent induction of p21 and downregulation of minichromosome maintenance protein 2 was lost in >80% of BE and AC. TGF‐β failed to inhibit proliferation in 5/8 oesophageal cell lines. In BIC‐1, the antiproliferative response was restored following transient transfection of smad4 cDNA.
Conclusions
In BE carcinogenesis, downregulation of Smad4 occurs due to several different mechanisms, including methylation, deletion, and protein modification. Frequent alterations in TGF‐β signalling lead to a functionally significant impairment of TGF‐β mediated growth suppression.
Keywords: Smad4, p21, proliferation, dysplasia
The incidence of oesophageal adenocarcinoma (AC) has risen sharply since the 1970s,1 and the five year survival rate is less than 20% unless diagnosed at an early stage.2 Early intervention is in theory possible because AC usually arises via the formation of columnar metaplasia, termed Barrett's oesophageal epithelium (BE). BE patients have a 30‐fold increased risk of progressing to cancer through a multistep metaplasia‐dysplasia‐adenocarcinoma sequence.3 During the metaplasia‐dysplasia sequence there is accumulation of genetic abnormalities which result in loss of proliferative control.4 The pleiotropic cytokine, transforming growth factor β (TGF‐β), exerts profound regulatory effects on the differentiation and proliferation of epithelial cells. An alteration in TGF‐β signalling may thus contribute to the development and progression of BE, in keeping with other cancers.5
TGF‐β signalling is initiated by activation of type I and II transmembrane serine/threonine kinase receptors (TβRI and TβRII)6 which leads to phosphorylation of the intracellular signalling molecules, Smad2 and Smad3. This complex, in association with Smad4, is then translocated into the nucleus resulting in transcriptional regulation of target genes such as downregulation of c‐Myc and upregulation of the cyclin dependent kinase inhibitors p15INK4B and p21CIP/WAF1.6 Hence, in combination with induction of apoptosis in certain cell types, TGF‐β can function as a negative growth factor.5
Gastrointestinal malignancies frequently display inactivating mutations of the TGF‐β signalling cascade. In microsatellite unstable tumours, 81% of colon cancers and 69% of gastric cancers undergo frameshift mutations of TβRII.7 In addition, functional inactivation of smad4 (DPC4, deleted in pancreatic carcinoma, locus 4) has been described in 50% of pancreatic adenocarcinomas,8 30% of metastatic colorectal cancers,9 and 25% of small intestinal carcinomas.10
The contribution of perturbed TGF‐β signalling in AC is poorly understood. It has been suggested that mutations in TβRII are an infrequent event,11,12 presumably as a result of microsatellite instability being uncommon.13 In one study, 3/11 ACs demonstrated loss of TβRII expression.14 BE associated ACs have been shown to undergo loss of heterozygosity at chromosome 18q, the location of smad2 and smad4, in up to 69% of patients, and in as many as 46% of patients with non‐dysplastic BE.15,16 However, further analysis did not reveal any inactivating mutations of smad4.15
This study was designed to test the hypothesis that there are abnormalities in TGF‐β signalling in Barrett's carcinogenesis. The specific aims of this research were firstly to examine expression of the TGF‐β signalling components in clinical specimens and cell lines from the metaplasia‐dysplasia‐carcinoma sequence; and secondly, to determine the genetic basis and functional significance of the observed reduction in Smad4.
Methods
Patient samples
Paired endoscopic oesophageal biopsy samples for research and routine histopathology were obtained prospectively following local research ethics committee approval by Addenbrooke's Hospital NHS Trust. Samples were classified by an expert upper gastrointestinal histopathologist, as part of the routine diagnostic service, using internationally agreed criteria.17,18 Specimens were classified into the following groups: normal squamous epithelium (NE, n = 30); BE (endoscopically visible segment with columnar lined epithelium and specialised intestinal metaplasia on biopsy) without dysplasia (n = 30); low grade dysplasia (LGD, n = 15); high grade dysplasia (HGD, n = 15); and adenocarcinoma arising from BE (AC, n = 35). All cases of HGD were confirmed by a second independent consultant pathologist within the clinical department. Different patient samples were used for different analyses. All data points within an experiment were derived from separate patients rather than multiple biopsies taken from within the same patient. For immunohistochemistry, paraffin sections were selected from the tissue archive at Addenbrooke's Hospital from BE and AC patients. All tissue sections fulfilled the diagnostic criteria specified above.
Cell lines
BE HGD cell lines transduced with the human catalytic subunit of telomerase reverse transcriptase (hTERT), C hTRT, Gi hTRT, G0 hTRT (gift from P Rabinovitch, University of Washington, Washington, USA) were maintained in MCDB 153 medium.19 These cell lines were all derived from patients with histopathologically confirmed HGD.19 Barrett's associated adenocarcinoma cell lines OE33 (European Collection of Cell Cultures, Wiltshire, UK), TE7 (gift from T Nishihira, Kurokawa County Hospital, Japan), SEG‐1, BIC‐1, and FLO‐1 (gift from D Beer, University of Michigan, Michigan, USA) were used. OE33 and TE7 cells were maintained in RPMI‐1640 medium, and SEG‐1, BIC‐1, and FLO‐1 in Dulbecco's modified Eagle's medium, all supplemented with 10% fetal bovine serum, 100 U/ml penicillin, 100 mg/ml streptomycin, and 2 mM glutamine. A transitional cell bladder carcinoma cell line RT4 was used as a control for genomic analysis of smad4. Details of all of these cell lines with regard to their p53 and p16 status, which affect cell cycle control, are given in table 1.
Table 1 Alteration of genes associated with cell cycle control in oesophageal cell lines.
| p16 expression | p53 expression | p53 base change | p53 amino acid change | p53 exon | p53 codon | Reference | |
|---|---|---|---|---|---|---|---|
| C hTRT | − | M | CGC‐CAC | Arg‐His | 5 | 175 | Palanca‐Wessels,20 own observations |
| Gi hTRT | − | M | CGG‐TGG | Arg‐Trp | 7 | 248 | Palanca‐Wessels,20 own observations |
| Go hTRT | + | M | Coding shift | Gly‐coding shift | 8 | 302 | Palanca‐Wessels,20 own observations |
| OE33 | + | M | TGC‐TAC | Cys‐Tyr | 5 | 135 | Own observations |
| TE7 | − | − | − | − | − | − | Own observations |
| SEG | − | W | − | − | − | − | Own observations |
| BIC | − | M | GAG‐TAG | Glu‐Ter | 6 | 204 | Own observations |
| FLO | − | M | TGT‐TTT | Cys‐Phe | 8 | 277 | Own observations |
−, no mRNA expression; +, expression of mRNA; M, expression of mutant p53; W, expression of wild‐type p53.
Reverse transcription‐polymerase chain reaction (RT‐PCR)
Total RNA was isolated using Trizol reagent (Invitrogen, Paisley, UK). RNA (2 μg) was reverse transcribed, and 2 μl of cDNA amplified as follows: 30 cycles of 94°C for 30 seconds, 55°C for 30 seconds, and 72°C for 45 seconds for TβRI, TβRII, smad2, smad3, smad4, and β actin, as previously described,21 30 cycles of 94°C for 45 seconds, 60°C for 45 seconds, and 72°C for one minute for GAPDH, using the primers 5′‐GCA GGG GGG AGC CAA AAG GG‐3′ (forward) and 5′‐TGC CAG CCC CAG CGT CAA AG‐3′ (reverse). PCR products were analysed on 1.5% agarose gels, stained with ethidium bromide, and quantified by densitometry using Kodak Electrophoresis Documentation and Analysis System 120 (EDAS) software (Eastman Kodak Company, Rochester, New York, USA).
Western blotting
Protein lysates were prepared with ice cold lysis buffer (20 mM Tris pH 7.8, 150 mM NaCl, 1 mM EDTA, 1% NP40) containing protease inhibitors (Complete Tablet; Roche, Germany). Following quantification (BCA protein assay; Sigma‐Aldrich Company Ltd, Dorset, UK), 50 μg of protein were separated by gel electrophoresis on 8% polyacrylamide gels and transferred to PVDF membranes (Hybond‐P; Amersham Biosciences, Amersham, UK). Membranes were incubated overnight at 4°C with the following antibodies: TβRII (1:500; clone C‐4), Smad4 (1:500; clone B‐8), p‐Smad2/3 (1:500), Smad2/3 (1:500, clone E‐20), actin (1.500, clone I‐19) (all Santa Cruz Biotechnology, Inc., Santa Cruz, California, USA), and SUMO‐1 (1:500; Alexis Corporation, Nottingham, UK).
Tissue immunohistochemistry
Archival paraffin sections from BE and AC patients were deparaffinised, rehydrated, and then exposed to sodium citrate buffer for three minutes in a pressure cooker. Slides were blocked with 10% goat serum for one hour at room temperature and incubated with either TβRII (Santa Cruz Biotechnology; 1:100), Smad4 (Santa Cruz Biotechnology; 1:100), or Smad2 (clone S‐20; Santa Cruz Biotechnology; 1:100) antibodies overnight at 4°C. Antibody detection was achieved with antimouse or antigoat horseradish peroxidase (Dako Ltd, Ely, UK) followed by 3,3′ diaminobenzidine and a haematoxylin counterstain. Qualitative analysis was then performed.
Methylation analysis
Genomic DNA (1 μg) was denatured with sodium hydroxide and incubated with sodium bisulphite.22 DNA was then purified using Wizard DNA Clean Up System (Promega, Madison, Wisconsin, USA), desulphonated with sodium hydroxide, ethanol precipitated, and resuspended in Tris/EDTA. Treated DNA was analysed by methylation specific PCR (MSP) for the Smad4 promoter using the following primers: for the methylated reaction, 5′‐GTA ATA ATA CGG TTT TGG TCG TC‐3′ (forward) and 5′‐CTC CCA CCC CCT AAA CGA CCG CG‐3′ (reverse); for the unmethylated reaction, 5′‐GTA ATA ATA TGG TTT TGG TTG TT‐3′ (forward) and 5′‐CTC CCA CCC CCT AAA CAA CCA CA‐3′ (reverse). PCR was carried out for 40 cycles with annealing temperatures of 65°C for the methylated reaction and 59°C for the unmethylated reaction. MSP products were further analysed by cloning into pCR2.1 vector (Invitrogen, Paisley, UK) and sequencing of individual clones using a BigDye Terminator protocol and the ABI 3100 Genetic Analyser (Applied Biosystems, Warrington, UK).
Fluorescence in situ hybridisation (FISH)
The smad4 gene was identified from Ensembl to be contained within the RP11‐729G3 BAC clone. BAC DNA were isolated by the alkaline‐lysis method and labelled with biotin‐16‐dUTP (Roche Biochemicals, UK) using nick translation (Vysis, UK). Labelled BAC was precipitated together with a probe for centromere 18 (gift from M Rocchi, Molecular Cytogenetics Resources, Bari, Italy) or a whole chromosome 18 paint labelled with FITC (Roche Biochemicals, UK) in the presence of unlabelled human COT‐1 DNA. Metaphase preparations were obtained using standard potassium chloride/Carnoy's fixative protocols and stored at −20°C. Metaphases were made from peripheral blood lymphocytes from normal individuals for reference. Probes were applied to slides for a 72 hour hybridisation, detected with strepavidin‐Cy3 (Amersham, UK) and counterstained with DAPI in mounting medium (Vectashield, Vector Labs, UK). Slides were examined under a Zeiss Axioplan 2 epifluorescence microscope and digital images taken using a Hamamatsu ORCA II camera (Hamamatsu, Japan).
smad4 promoter analysis
For BIC‐1 cells, the 300 kb region of chromosome 18 around the smad4 promoter was studied using a series of markers. A bladder cell line RT4 known to contain the region was used as a control. Markers shown in fig 7C are taken from Yanaihara and colleagues,23 except smad4+3 kb: 5′‐CAT CCG GGA ACA TTT GTT TT‐3′ (forward) and 5′‐TTG GGC TGA ACG GTC TTT AC‐3′ (reverse).
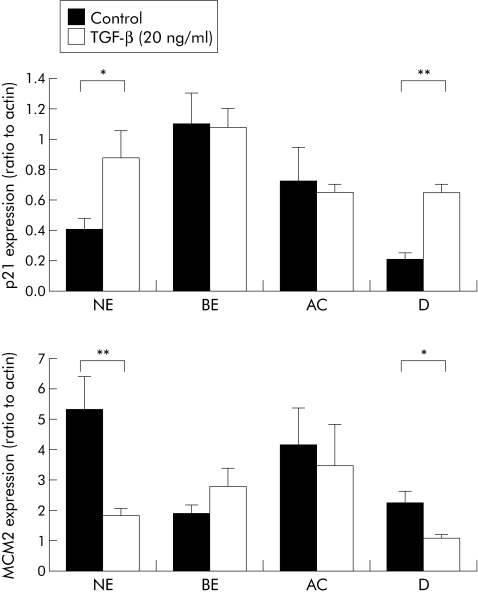
Figure 7 Transforming growth factor β (TGF‐β) signalling in the metaplasia‐dysplasia‐carcinoma sequence. Quantitative real time reverse transcription‐polymerase chain reaction for p21 (A) and minichromosome maintenance protein 2 (Mcm2) (B) from normal squamous epithelium (NE), Barrett's oesophageal epithelium (BE), BE associated adenocarcinoma (AC), and duodenal (D) samples cultured for 24 hours with or without 20 ng/ml TGF‐β1. For p21, *p<0.03, **p<0.002; for Mcm2, *p<0.03 , **p<0.009.
PCR and sequence analysis
Genomic DNA was isolated using Trizol reagent (Invitrogen). To analyse exons 1–11 of the smad4 gene, 250 ng of DNA were amplified in a 100 μl volume using primers, as previously described,24 2.5 U of Pfu DNA polymerase (Stratagene), and conditions of hot start followed by 30 cycles of 45 seconds at 94°C, 45 seconds at 58°C, and 45 seconds at72°C. PCR product (20 μl) was analysed on a 1.5% agarose gel and the remaining PCR products were then purified and directly sequenced using a BigDye Terminator protocol and the ABI 3100 Genetic Analyser (Applied Biosystems, Warrington, UK).
Organ culture
Biopsy samples from NE, BE without dysplasia, and AC (n = 9) were cultured in serum free organ culture media (medium 199) in a 95% O2/5% CO2 atmosphere, as described previously.25 Following a three hour equilibration period, samples were cultured with or without 20 ng/ml of recombinant TGF‐β1 protein (Tebu‐bio, Cambridgeshire, UK) for a further 24 hours. Samples were then snap frozen and stored at −80°C until required
Quantitative real time PCR
cDNA (1 μl) was amplified in a 50 μl volume containing 25 μl of 2× QuantiTect SYBR Green PCR Master Mix (Qiagen, West Sussex, UK) and 0.2 μM of each primer. Primers used were 5′‐GGA AGA CCA TGT GGA CCT GT‐3′ (forward) and 5′‐GGC GTT TGG AGT GGT AGA AA‐3′ (reverse) for p21, 5′‐TTC CCT GGG ATT CTG GTT‐3′ and 5′‐AAG CAG GCT TGG AGA AAC AA‐3′ (reverse) for minichromosome maintenance protein 2 (MCM2), and 5′‐TCA CCC ACA CTG TGC CCA TCT ACG A‐3′ (forward) and 5′‐CAG CGG AAC CGC TCA TTG CCA ATG G‐3′ (reverse) for β‐actin. Triplicate reactions were performed in a DNA Engine Opticon thermal cycler with initial enzyme activation of 15 minutes at 95°C, followed by 30–35 cycles of 10 seconds at 95°C, 20 seconds at 60°C, and 20 seconds at 72°C. Following PCR the threshold cycle was obtained and relative quantities determined for each sample normalised to β‐actin.
Cell proliferation assay
Cells seeded at a density of 5000 cells/well were cultured with 0.05–10 ng/ml recombinant TGF‐β1 protein (Tebu‐bio, Cambridgeshire, UK). After 72 hours of incubation, MTT (3‐[4,5‐dimethylthiazol‐2‐yl]‐2,5‐diphenyl tetrazolium bromide) (Sigma‐Aldrich) (5 mg/ml) was added and the plate incubated for a further four hours. Culture media was then removed and MTT crystals dissolved using MTT solvent (0.1 N HCl in anhydrous isopropanol).26 The optical density of each well was read at 570 nm.
smad4 transfection, immunoprecipitation, and cell proliferation
BIC‐1 cells were seeded at 2×10⁵ cells/well for protein expression or at 2×10⁴ cells/well for the MTT assay. Cells were transfected with the pRK5‐smad4 FLAG expression vector (gift of A Chantry, School of Biological Sciences, University of East Anglia, UK) using transfection reagent (Genejuice; Novagen, Merck Biosciences, Nottingham, UK). Twenty four hours after transfection, cells were cultured in TGF‐β (0.05–10 ng/ml) for 72 hours. For protein experiments, 50 μg of protein from lysed cells were separated by sodium dodecyl sulphate‐polyacrylamide gel electrophoresis (SDS‐PAGE) and membranes probed with Smad4 antibody, then stripped, and reprobed with actin antibody. In separate experiments, 24 hours after transfection, cells were incubated with 10 ng/ml TGF‐β1 for 24 hours. Cells were lysed and Smad4 was immunoprecipitated from 200 μg of cell lysate using 2 μg of Smad4 antibody (Santa Cruz Biotechnology) overnight at 4°C. Sample (15 μl) was separated by SDS‐PAGE and probed with anti‐FLAG antibody (1:5000; Abcam Ltd, Cambridgeshire, UK). Membranes were stripped and reprobed with p‐Smad2/3 antibody (Santa Cruz Biotechnology) for one hour at room temperature.
Immunofluorescence staining
Following transfection, cells were treated with 10 ng/ml TGF‐β1 for two hours, fixed with methanol/acetone for five minutes at −20°C, washed with phosphate buffered saline, and blocked with 10% horse serum in phosphate buffered saline for 30 minutes. Slides were incubated with a 1:50 dilution of anti‐Smad4 monoclonal antibody (Santa Cruz Biotechnology) for one hour at room temperature, washed, and incubated with a 1:100 dilution of FITC conjugated antimouse IgG (Vector Laboratories, Cambridgeshire, UK) and examined by confocal microscopy.
Statistics
Data were analysed using Graphpad Prism software. The Kruskal‐Wallis test was used to compare values between different groups, and Dunn's multiple comparison test was used to identify specific differences. Regression analysis was used to examine the correlation between Smad4 methylation status and mRNA expression.
Results
Expression changes in TGF‐β signalling components in the metaplasia‐dysplasia‐carcinoma sequence
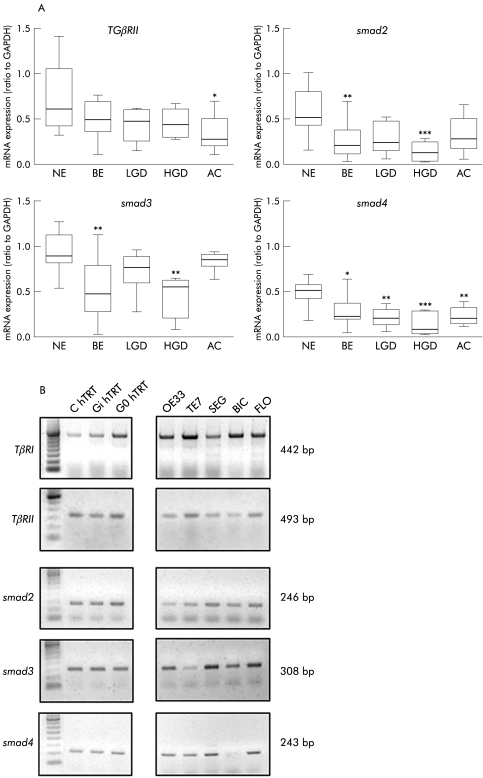
Expression of TGF‐β signalling components was analysed in primary endoscopic tissues representative of the BE‐AC sequence from a prospective cohort of patients. A panel of cell lines were also characterised to enable downstream functional studies to be performed. A significant reduction in smad2 (p<0.01), smad3 (p<0.001), and smad4 (p<0.05) mRNA expression was seen in BE patient samples compared with primary NE (fig 1A). Although dysplastic samples displayed a reduction in smad2 and smad3 expression, this only reached significance in HGD (p<0.001 smad2; p<0.01 smad3). Expression of smad4 mRNA was significantly decreased in BE, dysplastic BE, and AC (p<0.01, LGD; p<0.001, HGD; p<0.01, AC). Reduced expression of TβRII was only observed in AC (p<0.05). Expression of signalling components was more variable in cancer derived cell lines compared with levels seen in the dysplastic hTRT cell lines. The most noticeable abnormality was that smad4 mRNA expression was completely absent in BIC‐1 adenocarcinoma cells (fig 1B).
Figure 1 mRNA expression of transforming growth factor β (TGF‐β) signalling pathway components in the metaplasia‐dysplasia‐carcinoma sequence. (A) Reverse transcription‐polymerase chain reaction (RT‐PCR) was performed for primary samples of normal squamous epithelium (NE), Barrett's oesophageal epithelium (BE), low grade dysplasia (LGD), high grade dysplasia (HGD), and adenocarcinoma (AC), and compared with GAPDH expression for TGFβRII and smad molecules 2, 3 and 4. *p<0.05, **p<0.01, ***p<0.001 compared with NE. (B) RT‐PCR was also performed for a panel of cell lines. Representative gels are shown for cell lines derived from HGD in BE (hTRT immortalised) in the left hand panel and from BE adenocarcinoma cell lines in the right hand panel.
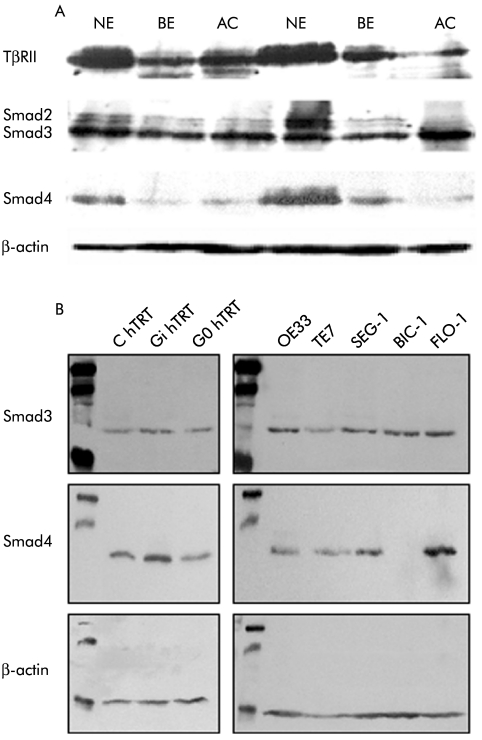
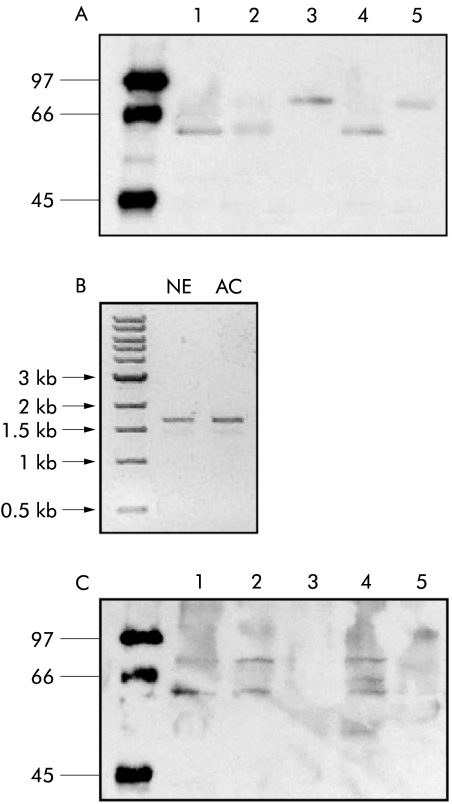
Changes in protein levels for TGF‐β pathway components correlated with changes observed at the mRNA level for smad2 and smad4 (fig 2A). Furthermore, no Smad4 protein was expressed in BIC‐1 cells, in keeping with the lack of smad4 RNA expression (fig 2B). TβRII levels were reduced in BE and AC compared with NE (fig 2A) although no alteration was demonstrated in the cell lines, in keeping with the mRNA expression data (data not shown). Analysis of an additional series of AC samples by western blot revealed that seven of 28 (25%) samples displayed a band for Smad4 at 75–80 kDa, which is 10–15 kDa heavier than expected (fig 3A). Exons 1–11 of the smad4 gene for these samples did not reveal any sequence alteration (data not shown), and there was a normal 1.6 kB product corresponding to the full length coding sequence of smad4 when analysed by RT‐PCR (fig 3B). Hence the abnormality in Smad4 protein mobility is likely to be a post‐translational protein modification. The change in mobility is too great to be accounted for by phosphorylation or ubiquitination. Sumoylation was considered but no evidence for this was demonstrated (fig 3C).
Figure 2 Protein expression of transforming growth factor β (TGF‐β) signalling pathway components in the dysplasia‐carcinoma sequence in vitro. (A). Western blot on 25 μg of cell lysate using primary samples of normal squamous epithelium (NE), Barrett's oesophageal epithelium (BE), and adenocarcinoma (AC) for TGFβRII, Smad2/3, and Smad4 compared with β‐actin (upper panel). (B). Western blot for Smad3 and Smad4 in BE oesophageal cell lines. Left hand panel shows cell lines derived from high grade dysplasia in BE (hTRT immortalised) and the right hand panel from BE adenocarcinoma cell lines.
Figure 3 Smad4 alterations in adenocarcinoma (AC). (A) Representative western blot from a denaturing gel of Smad4 expression in Barrett's oesophageal epithelium (BE) adenocarcinoma. Sample 3 and 5 display a 10–15 kDa difference in normal Smad4 mobility. This abnormality was seen in 25% of biopsies examined. (B) Expression of Smad4 mRNA in control normal squamous epithelium (NE) and in a patient sample (AC) which had exhibited an alteration in Smad4 mobility when examined by western blot. The AC sample expressed full length Smad4 mRNA. (C) Smad4 western blot in (A) stripped and reprobed for evidence of sumoylation using an antibody SUMO1. Samples 1, 2, and 4 show the presence of SUMO1 at the molecular weight of Smad4. Samples 3 and 5 do not show the presence of SUMO1 at the level Smad4 of altered mobility.
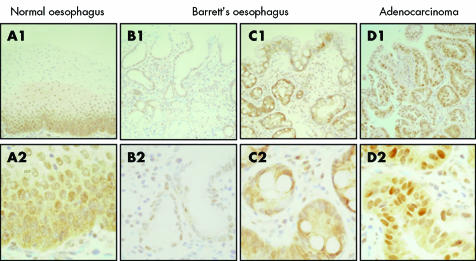
Immunohistochemistry, from separate archival specimens, demonstrated that the observed decrease in expression of the signalling components reflects alterations within the epithelium, rather than the lamina propria. Representative images are shown for Smad4 (fig 4). In all sections of NE examined, there was significant Smad4 expression within the basal layers of the epithelium (fig 4A) whereas staining in Barrett's oesophageal sections was highly variable and some patient sections had little discernable Smad4 staining (fig 4B compared with 4C). In AC, expression was heterogeneous but overall there was decreased expression compared with the homogeneously high levels of Smad4 expression within the normal squamous epithelium. This is in keeping with the RNA expression data. As expected, anti‐Smad4 staining was variably localised to the cytosol or the nucleus, consistent with its translocation depending on its activation status.
Figure 4 Immunohistochemical staining for Smad4 in sections of normal squamous epithelium, non‐dysplastic Barrett's oesophageal epithelium, and adenocarcinoma. Positive immunostaining is denoted by brown colouration in contrast with the blue haematoxylin counterstain. The top panel (A1–D1) is at 100× magnification and the bottom panel shows the same fields at 400× magnification.
Hence in both primary tissue and cell lines from the metaplasia‐dysplasia‐adenocarcinoma sequence there is a reduction in mRNA and protein expression of TGF‐β signalling components, which is particularly marked for Smad4. In addition, there is aberrant Smad4 protein detected in 25% of AC samples.
Genomic alterations of SMAD4 in the metaplasia‐dysplasia‐carcinoma sequence
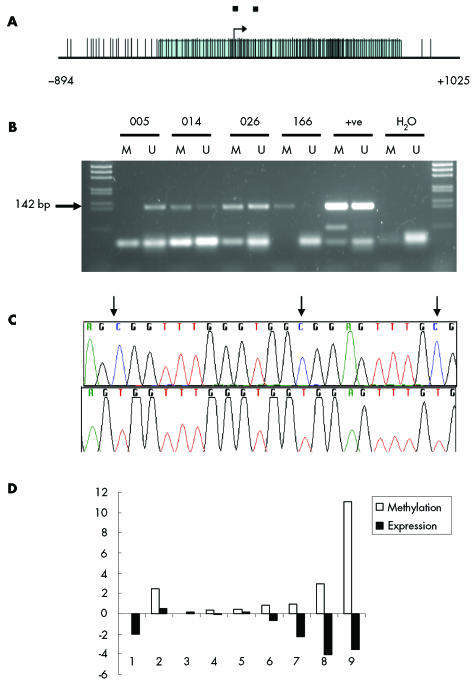
The smad4 promoter region contains multiple CpG sites (fig 5A) and analysis of this region by MSP demonstrated methylation in 3/10 BE samples and in 7/10 AC samples (fig 5B). MSP products were sequenced to investigate the 17 CpG sites within the products. All CpG sites within all methylated MSP products sequenced were methylated and all sites within unmethylated products were unmethylated (fig 5C). Quantitative real time PCR and quantitation of MSP demonstrated some correlation between the degree of methylation and mRNA expression (p = 0.086) (fig 5D). The majority of cell lines did not show a significant degree of Smad4 methylation (data not shown).
Figure 5 Methylation of the smad4 promoter in adenocarcinoma. (A) The Smad4 promoter region is shown with the shaded area representing the extent of the CpG island. Vertical lines represent CpG sites; two black boxes represent methylation specific polymerase chain reaction (MSP) primer positions. The transcription start site corresponds to GenBank Accession No AB043547, base 119575. (B) MSP analysis of adenocarcinoma DNA showing the Smad4 MSP band at 142 bp. M, methylated specific reaction; U, unmethylated specific reaction. (C) Sequence analysis of clones of methylated (top) and unmethylated (bottom) MSP products. Black arrows indicate the location of CpG sites. (D) Methylation of the smad4 promoter in adenocarcinoma samples expressed as a ratio of the intensities of the methylated MSP product against the unmethylated product. Matched expression data are shown as log10 of the quantitative polymerase chain reaction values.
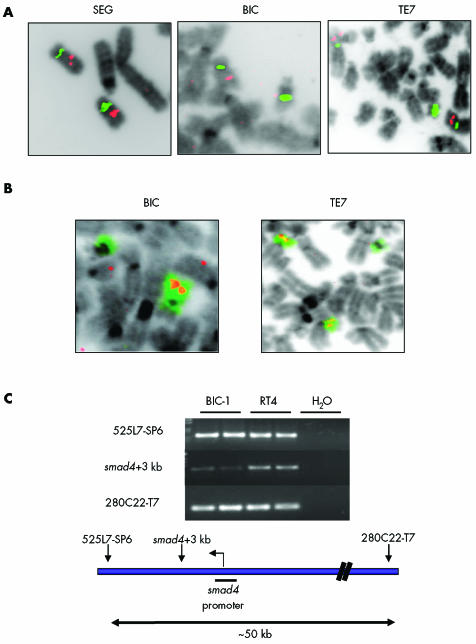
FISH studies were then undertaken to determine whether copy number changes accounted for the variability in smad4 expression in oesophageal cell lines (fig 6A,B; table 2). The most interesting cell line was BIC‐1 where loss of one copy of chromosome 18 had occurred and the remaining copy was involved in a translocation where the breakpoint had occurred within the centromere. Only one copy of smad4 was detected in BIC‐1 (fig 6A,B for TE7, SEG, and BIC data).
Figure 6 Chromosome 18 and smad4 analysis in cell lines. (A) Fluorescence in situ hybridisation images using probes for the centromere (green) and smad4 (red) in SEG‐1, BIC‐1, and TE7. (B) Structural rearrangements involving chromosome 18 identified using whole chromosome 18 paint (green) and SMAD4 (red) in BIC‐1 and TE7. SEG‐1 cells have two copies of chromosome 18 and two copies of Smad4. Chromosome 18 rearrangements in TE7 are balanced and no loss of smad4 has occurred. BIC‐1 cells contain only one copy of chromosome 18 and subsequently only one copy of smad4. (C) Polymerase chain reaction analysis of BIC‐1 and control RT4 DNA showing that the remaining allele of smad4 in BIC‐1 is affected by a deletion spanning a 30–50 kb region of chromosome 18, including the smad4 promoter.
Table 2 Chromosome 18 and Smad4 analysis by fluorescence in situ hybridisation in oesophageal cell lines.
| CEP 18 | smad4 copy No | Translocation | Description of chromosome 18 translocations | |
|---|---|---|---|---|
| C hTRT | 2 | 2 | None | |
| Gi hTRT | 3 | 3 | None | |
| Go hTRT | 4 | 4 | None | |
| OE33 | 4 | 2 | Yes | 2×18, 2× t(18;?)(p10;?) |
| TE7 | 3 | 2 | Yes | i(18)(p10), 2×t(18;?)(q10;?) |
| SEG | 2 | 2 | None | |
| BIC | 2 | 1 | Yes | del 18, t(18;?)(q10;?) |
| FLO | 4 | 4 | None |
CEP 18, centromere 18 probe; t, translocation; I, iso‐chromosome; p, short arm of chromosome; q, long arm of chromosome.
Mutational analysis of smad4 in the cell lines demonstrated a deletion of between 30 and 50 kb in BIC cells which included the promoter region for smad4 but not the downstream exons (fig 6B). The ratio of the band for this region in BIC compared with a control cell line RT4 was 1:544, reflecting a small degree of clonal heterogeneity. Hence BIC‐1 cells contain only one copy of smad4, which in >90% cells contains a deletion at the promoter that would result in loss of mRNA and subsequently protein expression.
Functional consequences of alterations in expression of TGF‐β signalling components
TGF‐β signalling was measured in endoscopic biopsies maintained as organ cultures.25 In the control samples, 67% of NE and 78% of duodenum exhibited upregulation of the cell cycle kinase inhibitor p21 in response to TGF‐β compared with 22% of BE and 33% of AC samples. Similar responses were seen with respect to downregulation of the proliferative marker Mcm2, following TGF‐β stimulation (table 3). These results were confirmed by quantitative analysis for p21 (NE, p<0.03; duodenum, p<0.002), and Mcm2 (NE, p<0.009; duodenum, p<0.03) (fig 7).
Table 3 Response of biopsy samples to transforming growth factor β in organ culture.
| Normal oesophagus | Barrett's oesophagus | Adenocarcinoma | Duodenum | |
|---|---|---|---|---|
| p21 increase | 6/9 (67%) | 2/9 (22%) | 3/9 (33%) | 7/9 (78%) |
| Mcm2 decrease | 7/9 (78%) | 2/9 (22%) | 1/9 (11%) | 8/9 (88%) |
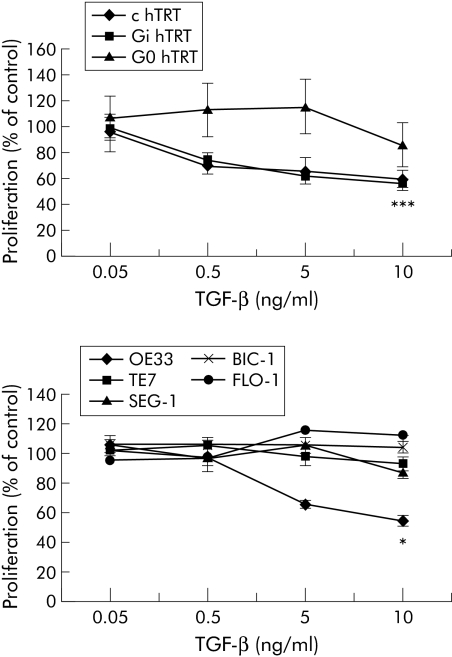
In the cell lines the effect of TGF‐β on proliferation was assessed by the MTT assay. This assay is quantitative but not feasible for primary tissues. TGF‐β failed to inhibit the growth of most cells, including a BE dysplasia cell line (G0 hTRT) and 4/5 adenocarcinoma lines (TE7, SEG‐1, BIC‐1 and FLO‐1) (fig 8). BE HGD lines C hTRT and Gi hTRT, and the BE adenocarcinoma cell line OE33 (10 ng/ml TGF‐β: p<0.001, C hTRT; p<0.001, Gi hTRT; p<0.05, OE33) were TGF‐β responsive.
Figure 8 Transforming growth factor β (TGF‐β) signalling in Barrett's oesophageal epithelial (BE) dysplasia and adenocarcinoma cell lines. MTT (3‐[4,5‐dimethylthiazol‐2‐yl]‐2,5‐diphenyl tetrazolium bromide) proliferation assay on oesophageal cell lines cultured in serial dilutions of TGF‐β (0.05–10 ng/ml) for 72 hours. Results are expressed as mean (SEM) of three separate experiments. The responsive cell lines are c hTRT and Gi hTRT BE high grade dysplasia cell lines in the upper graph and OE33, a BE adenocarcinoma cell line in the lower graph. *p<0.05, ***p<0.001 compared with TGF‐β 0.05 ng/ml.
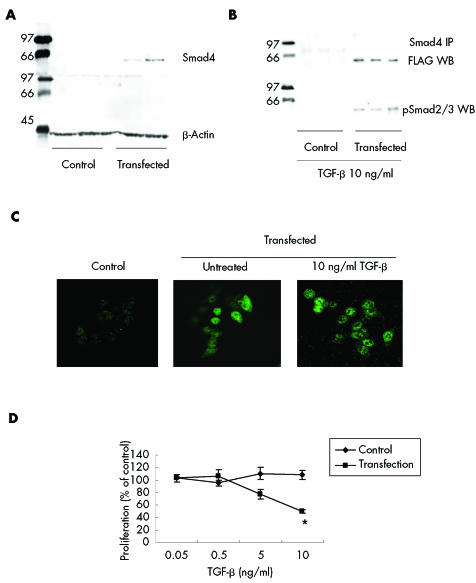
Following transfection with the expression vector pRK5‐smad4 FLAG in BIC‐1 cells (fig 9A), Smad4 protein was able to complex with, and coimmunoprecipitate with, activated Smad2/3 (fig 9B), as well as relocate from the cytoplasm to the nucleus (fig 9C). In the absence of TGF‐β, transfected cells were unable to bind p‐smad2/3 with ectopic Smad4 (data not shown). Furthermore, in comparison with untransfected cells, BIC‐1 cells expressing Smad4 exhibited a significant decrease in the rate of proliferation when treated with 10 ng/ml TGF‐β for 72 hours (p<0.05) (fig 9D). Overexpression of Smad2, Smad3, or Smad4 in other unresponsive cell lines did not restore TGF‐β unresponsiveness (data not shown). Hence the lack of Smad4 was functionally significant in BIC‐1 cells.
Figure 9 Restoration of Smad4 expression and transforming growth factor β (TGF‐β) signalling in BIC‐1 cells following transient transfection with pRK5‐Smad4 FLAG. (A) Western blot for Smad4 in control cells and transfected cells (upper band). Blots were stripped and reprobed with β‐actin as a loading control (lower band). (B) Immunoprecipitation for Smad4 (upper band) followed by western blot for FLAG in control and transfected cells treated with 10 ng/ml TGF‐β for 24 hours. Blots were stripped and reprobed with phosphorylated Smad2/3 (lower band). There is the expected association between Smad 4 and Smad2/3 in the transfected cells. (C) Far left panel demonstrates that Smad 4 expression is absent by immunofluoresence in untransfected BIC‐1 cells. Following transient transfection, Smad4 is present in the cytoplasm (middle panel). Following treatment with 10 ng/ml TGF‐β for two hours there is relocalisation of Smad 4 from a mainly cytoplasmic location (middle panel) to the nucleus (right panel). (D) Proliferation in control and transfected BIC‐1 cells treated with TGF‐β for 72 hours and assessed by the MTT (3‐[4,5‐dimethylthiazol‐2‐yl]‐2,5‐diphenyl tetrazolium bromide) assay. *p<0.05 compared with 0.05 ng/ml TGF‐β.
Discussion
TGF‐β responsiveness is reduced during all stages of the BE metaplasia‐dysplasia‐carcinoma sequence secondary to abnormalities at several points in the TGF‐β pathway; in particular, Smad4. In the clinical samples, Smad4 expression levels were profoundly reduced at all stages of the Barrett's‐dysplasia‐carcinoma sequence (figs 1, 2); 70% of AC samples had hypermethylation at the promoter region and 25% had an abnormal protein band (figs 3A, 5). In BIC‐1 cells, there was complete lack of Smad4 expression due to loss of one allele and extensive deletion of the promoter region in the remaining allele (fig 6). Functional complementation of impaired TGF‐β signalling occurred in BIC‐1 cells when Smad4 expression was re‐established (fig 9).
smad4 was first identified as a candidate tumour suppressor in pancreatic cancer,8 and since then mutations have been detected in one third of metastatic colorectal cancers,9,27 two thirds of gastric carcinomas,28 and recently a complex pattern of mutations and abnormal splicing of Smad4 has been demonstrated in thyroid tumours.29 Furthermore, mice heterozygous for smad4 develop gastric polyps months after birth that progress to invasive carcinoma.30 With regard to understanding the biological effects of smad4 silencing on carcinogenesis, the genes that are involved in cell proliferation, adhesion, and motility have been shown to be differentially regulated with respect to Smad4 status.31
Although mutations in smad4 are an infrequent event in AC,15 our findings suggest that promoter methylation may be a significant cause of reduced smad4 mRNA expression in BE carcinogenesis. To date, this represents the first example of methylation of the smad4 promoter in any malignancy. Other mechanisms that have been proposed for suppression of smad4 transcription include base pair substitutions in the promoter region in endometrial carcinoma.32 Protein alterations may also contribute to the reduction in Smad4 via the Ras signalling pathway,33 which is amplified in 40% of AC.34 The 10–15 kDa heavier Smad4 protein observed in a subset of AC indicates another possible modulation of Smad4 activity, although the limited amount of endoscopic material available precluded full characterisation. One possibility is protein interaction with proteins such as SMIF and Jab1,35,36 or post‐translational modification, especially as the altered mobility band was seen on a denaturing gel. Another possibility is sumoylation37,38,39; however, there was no evidence of sumoylation of Smad4 in these samples (fig 3C).
Overall, the proportion of samples in this series having some abnormality in Smad4 expression at the gene or protein level suggests that this may be important, albeit via a variety of different mechanisms compared with colon and pancreatic cancer.40,41 However, the limitations of this study should be taken into account. For example, due to the small size of the endoscopic biopsy specimens it was not possible to perform all of the experiments on the same sample. Therefore, each experiment was performed on separate patients selected from the prospective cohort, apart from the methylation study in which mRNA expression and methylation status were directly compared. Ideally, it would have been helpful to have long term outcome data for the Barrett's patients. In addition, the impact of abnormalities in other genes, such as p16 and p53, which control the G1/S checkpoint and that could affect our results should also be considered. However, C hTRT, Gi hTRT, and OE33 exhibit alterations in the expression of p16 and p53 (table 1) yet are still growth inhibited by TGF‐β. This implies that in AC, TGF‐β can still control proliferation despite the presence of alterations in p16 and p53.
In summary, reduction of Smad4 expression frequently occurs in BE carcinogenesis via a variety of mechanisms. The resulting functional effects of impaired TGF‐β signalling are profound and occur throughout the Barrett's metaplasia‐dysplasia‐adenocarcinoma sequence.
Acknowledgements
This work was funded by the Medical Research Council. We are grateful to Sarah Vowler for her statistical advice and to Linda Ko‐Ferrigno and David Bowtell for their critical evaluation of the manuscript. We are also grateful to Dr Rabinovitch, Dr Nishihira, and Dr Beer for giving us cell lines for this work. This study would not have been possible without the patient volunteers.
Abbreviations
AC - adenocarcinoma
BE - Barrett's oesophageal epithelium
FISH - fluorescence in situ hybridisation
HGD - high grade dysplasia
LGD - low grade dysplasia
MSP - methylation specific polymerase chain reaction
Mcm2 - minichromosome maintenance protein 2
MTT - 3‐[4,5‐dimethylthiazol‐2‐yl]‐2,5‐diphenyl tetrazolium bromide
NE - normal squamous epithelium
RT‐PCR - reverse transcription‐polymerase chain reaction
SDS‐PAGE - sodium dodecyl sulphate‐polyacrylamide gel electrophoresis
TGF‐β - transforming growth factor β
TβRI and TβRII - type I and II transmembrane serine/threonine kinase receptors
Footnotes
Conflict of interest: None declared.
References
- 1.Devesa S, Blot W, Jr J F. Changing patterns in the incidence of esophageal and gastric carcinoma in the United States. Cancer 1998152049–2053. [PubMed] [Google Scholar]
- 2.Landis S H, Murray T, Bolden S.et al Cancer statistics, 1999. CA Cancer J Clin 1999498–31. [DOI] [PubMed] [Google Scholar]
- 3.O'Shaughnessy J A, Kelloff G J, Gordon G B.et al Treatment and prevention of intraepithelial neoplasia: an important target for accelerated new agent development: recommendations of the American Association for Cancer Research Task Force on the treatment and prevention of intraepithelial neoplasia. Clin Cancer Res 20028314–346. [PubMed] [Google Scholar]
- 4.Wild C P, Hardie L J. Reflux, Barrett's oesophagus and adenocarcinoma: burning questions. Nat Rev Cancer 20033676–684. [DOI] [PubMed] [Google Scholar]
- 5.Derynck R, Akhurst R J, Balmain A. TGF‐beta signaling in tumor suppression and cancer progression. Nat Genet 200129117–129. [DOI] [PubMed] [Google Scholar]
- 6.Massague J. TGF‐beta signal transduction. Annu Rev Biochem 199867753–791. [DOI] [PubMed] [Google Scholar]
- 7.Duval A, Hamelin R. Mutations at coding repeat sequences in mismatch repair‐deficient human cancers: toward a new concept of target genes for instability. Cancer Res 2002622447–2454. [PubMed] [Google Scholar]
- 8.Hahn S A, Schutte M, Hoque A T.et al DPC4, a candidate tumor suppressor gene at human chromosome 18q21.1. Science 1996271350–353. [DOI] [PubMed] [Google Scholar]
- 9.Miyaki M, Iijima T, Konishi M.et al Higher frequency of Smad4 gene mutation in human colorectal cancer with distant metastasis. Oncogene 1999183098–3103. [DOI] [PubMed] [Google Scholar]
- 10.Blaker H, von Herbay A, Penzel R.et al Genetics of adenocarcinomas of the small intestine: frequent deletions at chromosome 18q and mutations of the SMAD4 gene. Oncogene 200221158–164. [DOI] [PubMed] [Google Scholar]
- 11.Iwaya T, Maesawa C, Nishizuka S.et al Infrequent frameshift mutations of polynucleotide repeats in multiple primary cancers affecting the esophagus and other organs. Genes Chromosomes Cancer 199823317–322. [DOI] [PubMed] [Google Scholar]
- 12.Souza R F, Garrigue‐Antar L, Lei J.et al Alterations of transforming growth factor‐beta 1 receptor type II occur in ulcerative colitis‐associated carcinomas, sporadic colorectal neoplasms, and esophageal carcinomas, but not in gastric neoplasms. Hum Cell 19969229–236. [PubMed] [Google Scholar]
- 13.Muzeau F, Flejou J F, Belghiti J.et al Infrequent microsatellite instability in oesophageal cancers. Br J Cancer 1997751336–1339. [DOI] [PMC free article] [PubMed] [Google Scholar]
- 14.Garrigue‐Antar L, Souza R F, Vellucci V F.et al Loss of transforming growth factor‐beta type II receptor gene expression in primary human esophageal cancer. Lab Invest 199675263–272. [PubMed] [Google Scholar]
- 15.Barrett M T, Schutte M, Kern S E.et al Allelic loss and mutational analysis of the DPC4 gene in esophageal adenocarcinoma. Cancer Res 1996564351–4353. [PubMed] [Google Scholar]
- 16.Wu T T, Watanabe T, Heitmiller R.et al Genetic alterations in Barrett esophagus and adenocarcinomas of the esophagus and esophagogastric junction region. Am J Pathol 1998153287–294. [DOI] [PMC free article] [PubMed] [Google Scholar]
- 17.Schlemper R J R R, Kato Y, Borchard F.et al The Vienna classification of gastrointestinal epithelial neoplasia. Gut 200047251–255. [DOI] [PMC free article] [PubMed] [Google Scholar]
- 18.Ibrahim N B N. Guidelines for handling oesophageal biopsies and resection specimens and their reporting. J Clin Pathol 20005389–94. [DOI] [PMC free article] [PubMed] [Google Scholar]
- 19.Palanca‐Wessels M C, Klingelhutz A, Reid B J.et al Extended lifespan of Barrett's esophagus epithelium transduced with the human telomerase catalytic subunit: a useful in vitro model. Carcinogenesis 2003241183–1190. [DOI] [PMC free article] [PubMed] [Google Scholar]
- 20.Palanca‐Wessels M, Barrett M, Galipeau P.et al Genetic analysis of long‐term Barrett's oesophagus epithelial cultures exhibiting cytogenetic and ploidy abnormalities. Gastroenterology 1998114295–304. [DOI] [PubMed] [Google Scholar]
- 21.Xu G, Chakraborty C, Lala P K. Expression of TGF‐beta signaling genes in the normal, premalignant, and malignant human trophoblast: loss of smad3 in choriocarcinoma cells. Biochem Biophys Res Commun 200128747–55. [DOI] [PubMed] [Google Scholar]
- 22.Herman J G, Graff J R, Myohanen S.et al Methylation‐specific PCR: A novel PCR assay for methylation status of CpG islands. Proc Natl Acad Sci U S A 1996939821–9826. [DOI] [PMC free article] [PubMed] [Google Scholar]
- 23.Yanaihara N, Kohno T, Takakura S.et al Physical and transcriptional map of a 311‐kb segment of chromosome 18q21, a candidate lung tumor suppressor locus. Genomics 200172169–179. [DOI] [PubMed] [Google Scholar]
- 24.Tanaka S, Mori M, Mafune K.et al A dominant negative mutation of transforming growth factor‐beta receptor type II gene in microsatellite stable oesophageal carcinoma. Br J Cancer 2000821557–1560. [DOI] [PMC free article] [PubMed] [Google Scholar]
- 25.Fitzgerald R C, Omary M B, Triadafilopoulos G. Acid modulation of HT29 cell growth and differentiation. An in vitro model for Barrett's esophagus. J Cell Sci 1997110663–671. [DOI] [PubMed] [Google Scholar]
- 26.Mosmann T. Rapid colorimetric assay for cellular growth and survival: application to proliferation and cytotoxicity assays. J Immunol Methods 19836555–63. [DOI] [PubMed] [Google Scholar]
- 27.Tang Y K V, Srinivasan R, Fogt F.et al Transforming growth factor‐beta suppresses nonmetastatic colon cancer through Smad4 and adaptor protein ELF at an early stage of tumorigenesis. Cancer Res 2005654228–4237. [DOI] [PubMed] [Google Scholar]
- 28.Okano H S H, Miyamoto A, Takaori K.et al Concomitant overexpression of cyclooxygenase‐2 in HER‐2‐positive on Smad4‐reduced human gastric carcinomas is associated with a poor patient outcome. Clin Cancer Res 2004106938–6945. [DOI] [PubMed] [Google Scholar]
- 29.Lazzereschi D N F, Turco A, Ottini L.et al A complex pattern of mutations and abnormal splicing of Smad4 is present in thyroid tumours. Oncogene 2005245344–5354. [DOI] [PubMed] [Google Scholar]
- 30.Xu X, Brodie S G, Yang X.et al Haploid loss of the tumor suppressor Smad4/Dpc4 initiates gastric polyposis and cancer in mice. Oncogene 2000191868–1874. [DOI] [PubMed] [Google Scholar]
- 31.Jazag A I H, Kanai F, Imamura T.et al Smad4 silencing in pancreatic cancer cell lines using stable RNA interference and gene expression profiles induced by transforming growth factor‐beta. Oncogene 200524662–671. [DOI] [PubMed] [Google Scholar]
- 32.Zhou Y, Kato H, Shan D.et al Involvement of mutations in the DPC4 promoter in endometrial carcinoma development. Mol Carcinog 19992564–72. [DOI] [PubMed] [Google Scholar]
- 33.Saha D, Datta P K, Beauchamp R D. Oncogenic ras represses transforming growth factor‐beta/Smad signaling by degrading tumor suppressor Smad4. J Biol Chem 200127629531–29537. [DOI] [PubMed] [Google Scholar]
- 34.Galiana C, Lozano J C, Bancel B.et al High frequency of Ki‐ras amplification and p53 gene mutations in adenocarcinomas of the human esophagus. Mol Carcinog 199514286–293. [DOI] [PubMed] [Google Scholar]
- 35.Bai R Y, Koester C, Ouyang T.et al SMIF, a Smad4‐interacting protein that functions as a co‐activator in TGFbeta signalling. Nat Cell Biol 20024181–190. [DOI] [PubMed] [Google Scholar]
- 36.Wan M, Cao X, Wu Y.et al Jab1 antagonizes TGF‐beta signaling by inducing Smad4 degradation. EMBO Rep 20023171–176. [DOI] [PMC free article] [PubMed] [Google Scholar]
- 37.Lin X, Liang M, Liang Y Y.et al SUMO‐1/Ubc9 promotes nuclear accumulation and metabolic stability of tumor suppressor Smad4. J Biol Chem 200327831043–31048. [DOI] [PubMed] [Google Scholar]
- 38.Lin X, Liang M, Liang Y Y.et al Activation of transforming growth factor‐beta signaling by SUMO‐1 modification of tumor suppressor Smad4/DPC4. J Biol Chem 200327818714–18719. [DOI] [PubMed] [Google Scholar]
- 39.Lee P S, Chang C, Liu D.et al Sumoylation of Smad4, the common Smad mediator of transforming growth factor‐beta family signaling. J Biol Chem 200327827853–27863. [DOI] [PubMed] [Google Scholar]
- 40.Muller N, Reinacher‐Schick A, Baldus S.et al Smad4 induces the tumor suppressor E‐cadherin and P‐cadherin in colon carcinoma cells. Oncogene 2002216049–6058. [DOI] [PubMed] [Google Scholar]
- 41.Ijichi H, Ikenoue T, Kato N.et al Systematic analysis of the TGF‐beta‐Smad signaling pathway in gastrointestinal cancer cells. Biochem Biophys Res Commun 2001289350–357. [DOI] [PubMed] [Google Scholar]


