Abstract
Aim
Peroxisome proliferator activated receptor γ (PPARγ) agonists have been shown to prevent hepatic fibrosis in rodents. We evaluated the therapeutic antifibrotic potential of the PPARγ agonist pioglitazone on established hepatic fibrosis.
Methods
Repeated injections of carbon tetrachloride (CCl4), a choline deficient diet, or bile duct ligation (BDL) were used to induce hepatic fibrosis in rats. Pioglitazone treatment was introduced at various time points. Therapeutic efficacy was assessed by comparison of the severity of hepatic fibrosis in pioglitazone treated versus untreated fibrotic controls.
Results
When introduced after two weeks of CCl4, pioglitazone reduced hepatic fibrosis, OH proline content, hepatic mRNA expression of collagen type I, and profibrotic genes, as well as the number of activated α smooth muscle actin positive hepatic stellate cells, compared with rats receiving CCl4 only, with no significant change in necroinflammation. When pioglitazone treatment was initiated after five weeks of CCl4, no antifibrotic effect was observed. Similarly, pioglitazone was associated with a reduced severity of fibrosis induced by a choline deficient diet when introduced early, while delayed treatment with pioglitazone remained ineffective. In contrast, pioglitazone failed to interrupt progression of fibrosis due to BDL, irrespective of the timing of its administration.
Conclusion
In rats, the therapeutic antifibrotic efficacy of pioglitazone is limited and dependent on the type of injury, duration of disease, and/or the severity of fibrosis at the time of initiation of treatment.
Keywords: peroxisome proliferator activated receptor gamma, hepatic fibrosis, hepatic stellate cells, pioglitazone
Peroxisome proliferator activated receptor γ (PPARγ) is a member of the family of ligand activated transcription factors. PPARγ activation plays a role in various physiological and pathophysiological events, including stimulation of adipocyte differentiation, response to insulin, and regulation of lipid metabolism.1,2,3 Hence the synthetic PPARγ ligands, thiazolidinediones, are used as insulin sensitising drugs for treatment of type 2 diabetes.4,5
Several observations indicate that PPARγ might play a pivotal role in the molecular control of fibrogenesis.6 PPARγ has been shown to be expressed in quiescent hepatic stellate cells (HSC) in the normal liver and decreased PPARγ expression has been associated with activation of HSC in vitro.7 PPARγ agonists inhibited proliferation, migration, and production of fibril forming collagen by HSC in vitro.7,8,9,10 Hazra et al have reported that forced expression of PPARγ by adenoviral transfection was sufficient to reverse the morphology of activated HSC to the quiescent phenotype.6 In HSC isolated from fibrotic bile duct ligated livers, expression and activation of PPARγ have been found to be low compared with quiescent HSC extracted from normal livers.7 In vivo, PPARγ agonists thiazolidinediones have been shown to prevent the development of hepatic fibrosis in several rats models,10,11,12 an effect linked to the prevention of HSC activation by PPARγ agonist drugs.
The aim of the present study was to investigate the therapeutic potential of the thiazolidinedione pioglitazone (PGZ). Hence hepatic fibrosis was first established in rats by repeated injections of carbon tetrachloride (CCl4), by chronic administration of a choline deficient diet, or by ligature of the bile duct. PGZ treatment was introduced at various time points after induction of hepatic fibrosis. The therapeutic antifibrotic effect of PGZ was assessed by comparison of the severity of hepatic fibrosis in PGZ treated animals versus untreated fibrotic controls.
Materials and methods
Animals and in vivo experimental design
Male Sprague Dawley rats were housed 2–4 per cage under standard conditions with ad libitum access to food and water at all times. All experiments were performed in accordance with the institutional ethics guidelines. PGZ (kindly provided by Takeda Chemical Industries, Osaka, Japan) was mixed with a powdered standard or choline deficient L‐amino acid (CDAA) defined diet to obtain a 0.01% PGZ diet (wt/wt).
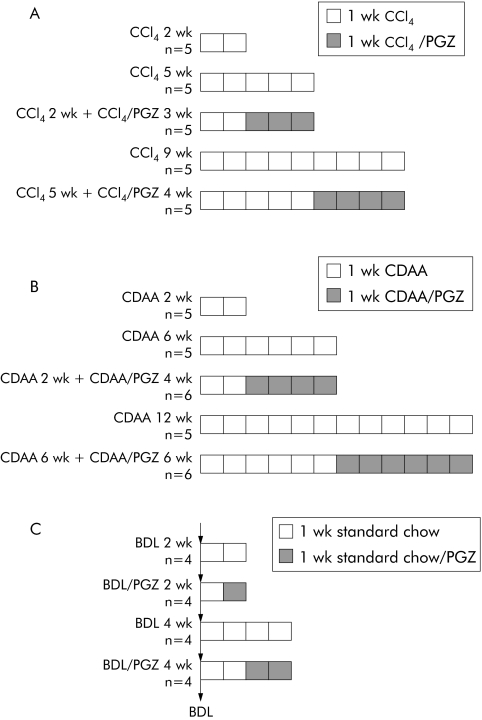
Hepatic fibrosis was induced by intraperitoneal injections of CCl4 at a dose of 0.75 ml/kg body weight, twice weekly for 2–9 weeks, and all animals sacrificed 48 hours after the last CCl4 injection. After two weeks of CCl4, rats were sacrificed (CCl4 2 wk) or CCl4 treatment was continued for an additional three weeks together with the PGZ supplemented powdered diet (CCl4 2 wk + CCl4/PGZ 3 wk) or a standard powdered died (CCl4 5 wk). In a second experiment, rats received CCl4 for five weeks (CCl4 5 wk) and thereafter animals received for a further four weeks either the PGZ supplemented diet or the standard diet while continuing CCl4 injections (CCl4 5 wk + CCl4/PGZ 4 wk or CCl4 9 wk, respectively) (fig 1A). There were five animals in each group.
Figure 1 Experimental design for evaluation of the therapeutic potential of pioglitazone (PGZ) on established hepatic fibrosis. Hepatic fibrosis induced by (A) repeated intraperitoneal injections of carbon tetrachloride (CCl4 0.75 ml/kg, twice weekly), (B) chronic administration of a choline deficient L‐amino acid (CDAA) defined diet, or (C) bile duct ligation (BDL). PGZ treatment was initiated at the indicated times and delivered as a food mixture (0.01% wt/wt). In experiments (A) and (B), five rats per group were analysed and in (C) there were four rats in each group.
Rats were fed a CDAA diet13,14 for two weeks (n = 5) to induce a mild hepatic fibrosis and thereafter received the CDAA diet supplemented or not with PGZ for a further four weeks (CDAA 2 wk + CDAA/PGZ 4 wk (n = 6) or CDAA 6 wk (n = 5), respectively). Also, rats were fed the CDAA diet for six weeks to induce a moderate hepatic fibrosis and thereafter the CDAA diet supplemented or not with PGZ for a further six weeks (CDAA 6 wk + CDAA/PGZ 6 wk (n = 6) or CDAA 12 wk (n = 5), respectively) (fig 1B).
Cholestatic fibrosis was induced by double ligation and section of the common bile duct (BDL). A 0.01% PGZ supplemented standard powdered diet was provided at day 5 and animals harvested at day 14 (BDL 2 wk + PGZ), or at day 14 and animals harvested at day 28 (BDL 4 wk + PGZ). Rats fed a standard powdered chow at all times post surgery and harvested at day 14 or day 28 served as fibrotic controls (BDL 2 wk or BDL 4 wk, respectively) (fig 1C). There were four animals in each group.
Naïve rats fed a standard powdered diet served as non‐fibrotic controls. At the time of sacrifice, the liver was excised and fixed in 10% formalin and embedded in paraffin or snap frozen in liquid nitrogen for subsequent biochemical and molecular analyses. Abdominal subcutaneous adipose tissue was excised and snap frozen in liquid nitrogen.
Histology and immunohistological examination
Liver sections were stained with haematoxylin‐eosin or with Sirius red for collagen visualisation. Ishak's score was used to assess necroinflammation.15 Immunodetection for α smooth muscle actin (α‐SMA), desmin, and glial fibrillar acidic protein (GFAP) were performed as previously described16 using the following antibodies: mouse monoclonal anti‐α‐SMA or anti‐desmin (Dako, Glostrup, Denmark; 1:100 or 1:250), or anti‐GFAP (Sigma, St Louis, Missouri, USA; 1:500). Immunostained slides were digitised through a JVC KY‐F58 colour digital camera (Japon Victor, Brussels, Belgium) and the image analyser (KS‐400 system; Zeiss Vision, Munich, Germany) measured the surface ratio between the α‐SMA positive area and the total liver area.17
Biochemical variables
Serum alanine aminotransferase (ALT), and total and unconjugated bilirubin were determined using automated procedures. Serum adiponectin was assessed using a mouse radioimmunoassay cross reacting with proteins of rat origin (RIA MADP‐60HK; Linco Research, St Charles, Michigan, USA).
Hepatic hydroxy proline content and hepatic lipids were determined as previously described.18
RNA extraction and real time reverse transcription‐polymerase chain reaction (RT‐PCR)
Hepatic α‐1‐collagen 1, tissue inhibitor of metalloproteinase (TIMP‐1), transforming growth factor β1 (TGF‐β1), connective tissue growth factor (CTGF), Kruppel‐like factor 6 (KLF‐6), CINC, and monocyte chemoattractant protein (MCP‐1) mRNA and adipose FAT/CD36 mRNA were determined by quantitative RT‐PCR. Total RNA was isolated from rat liver or adipose tissue using TriPure isolation reagent (Roche) and 1 μg RNA, and random hexamers used to prepare a first strand cDNA. SybrGreen mastermix (PE Applied Biosystems, Forster City, California, USA) and primers designed by the Primer Express design software (Applied Biosystems) were used for gene specific amplification reactions (table 1). The GeneAmp 5700 Sequence Detection System and software (Applied Biosystems) were used for real time detection of the amplification products. The amount of mRNA species was calculated by reference to a calibration curve and expressed as the ratio of specific mRNA to ribosomal protein L19 (RPL19) regarded as an invariant control.19 Mean value in the control group was arbitrarily set at 1.
Table 1 Sequences of primer pairs used for real time polymerase chain reaction assays.
| Gene | Accession No | Primer sense (5′‐3′) | Primer antisense (5′‐3′) |
|---|---|---|---|
| CD36 | NM_0331561 | GGACCATCGGCGATGAGA | ACCAGGCCCAGGAGCTTTAT |
| CINC (IL‐8) | NM_138522 | ATTTTGAGAACATCCAGAGCTTGA | CCATCCTTGAGAGTGGCTATGAC |
| Coll α1 | Z78279 | TTCACCTACAGCACGCTTGTG | TCTTGGTGGTTTTGTATTCGATGA |
| CTGF | NM_022266 | CGCCAACCGCAAGATTG | ACACGGACCCACCGAAGAC |
| IL‐1β | NM_031512 | GGGTTGAATCTATACCTGTCCTGTGT | AACCGCTTTTCCATCTTCTTCTT |
| IL‐6 | M26744 | GCCCTTCAGGAACAGCTATGA | TGTCAACAACATCAGTCCCAAGA |
| KLF‐6 | AF001417 | TGTAGCATCTTCCAGGAACTACAGA | TGACACGTAGCAGGGCTCACT |
| MCP‐1 | M57441 | CCACTCACCTGCTGCTACTCAT | CTGCTGCTGGTGATTCTCTTGT |
| RPL19 | M30264.1 | CAAGCGGATTCTCATGGAGCA | TGGTCAGCCAGTAGCTTCTT |
| TGF‐β1 | NM_021578 | TCGACATGGAGCTGGTGAAA | GAGCCTTAGTTTGGACAGGATCTG |
| TIMP‐1 | NM_053819 | AAGGGCTACCAGAGCGATCA | GGTATTGCCAGGTGCACAAAT |
IL, interleukin; TIMP‐1, tissue inhibitor of metalloproteinase; TGF‐β1, transforming growth factor β1; CTGF, connective tissue growth factor; KLF‐6, Kruppel‐like factor 6; MCP‐1, monocyte chemoattractant protein.
Western blot analysis
Livers were homogenised in ice cold 50 mM Hepes buffer (pH 7.4) containing 1.5 mM MgCl2, 150 mM NaCl, 10% glycerol, 0.1% Triton X‐100, and a mixture of proteases and phosphatases inhibitors, and then centrifuged at 9000 g for 10 minutes.
For matrix metalloproteinase 13 (MMP‐13) analysis, homogenates were diluted in 1% (w/v) sodium dodecyl sulphate (SDS) non‐reducing sample buffer and resolved by polyacrylamide gel electrophoresis on a 10% polyacrylamide/SDS gel, as described previously.20 For proliferating cell nuclear antigen (PCNA) and inducible nitric oxide synthase (iNOS), homogenates were boiled for five minutes in 12% SDS reducing buffer and resolved on a 12% polyacrylamide/SDS gel. After transfer and blocking, membranes were exposed to specific primary antibodies: anti‐rat MMP‐1320 at 1 μg/ml, anti‐PCNA (clone PC10; Dako; 1:750), or anti‐iNOS (Transduction Laboratories, Lexington, Kentucky, USA; 1:2000). Antibody reactive bands were visualised by the use of peroxidase conjugated secondary antibodies (Sigma) and enhanced chemiluminescence (Western Lightning Chemiluminescence Reagent Plus; Perkin Elmer, Boston Massachusetts, USA). Membranes were stripped and rehybridised with anti‐β‐actin antibody to assess for equivalence of loading. Signal intensity was quantified by densitometric analysis using Gel Scan Software (BioRad, Sunnyvale, California, USA).
Statistical analysis
Results are presented as mean (SD). Two way ANOVA and the Student's t test were used to compare data from different treatment groups. When p was less than 0.05, the difference was regarded as significant.
Results
Evaluation of the therapeutic effect of pioglitazone on CCl4 induced hepatic fibrosis
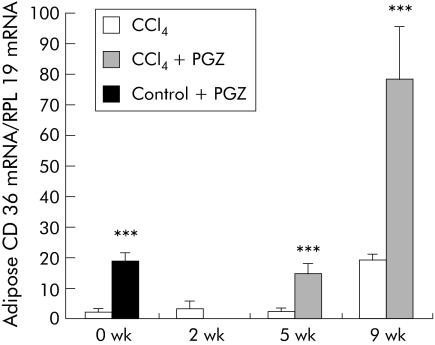
To confirm the pharmacological activity of PGZ in rats, we measured expression of CD36/FAT (fatty acid translocase) mRNA (a PPARγ regulated gene) in adipose tissue. CCl4 injection for up to five weeks had little effect on adipose CD36 mRNA but a significant increase was seen after nine weeks of CCl4 (fig 2). Compared with values obtained at specific end points, PGZ induced significant increases in adipose CD36 mRNA, confirming that, irrespective of the timing for its initiation, PGZ was biologically active (fig 2).
Figure 2 Pioglitazone (PGZ) is biologically active in carbon tetrachloride (CCl4) injected rats. Expression of CD36 mRNA in adipose tissue in rats treated with CCl4 only, and in rats treated with PGZ for the last three weeks of the five week CCl4 regimen or the last four weeks of the nine week CCl4 regimen, determined by real time polymerase chain reaction. Control rats were fed the PGZ supplemented diet for two weeks as a positive control for PGZ effects. Values are normalised to expression of RLP19 mRNA, regarded as an internal control, and expressed in relation to the mean value in untreated controls arbitrarily set at 1. Data are mean (SD) (n = 5/group). ***p<0.001 for groups treated with PGZ compared with groups not treated with PGZ at the same time point.
Effect on collagen deposition
After two weeks of CCl4, rats developed a moderate pericentrilobular fibrosis (fig 3A). After five weeks, the severity of hepatic fibrosis was more pronounced, with thick and often complete fibrotic centrocentral septa (fig 3B), associated with a significant increase in hepatic hydroxy proline content (fig 3F). Compared with five week CCl4 rats, PGZ treatment for the last three weeks of the five week CCl4 regimen significantly reduced collagen deposition, with thinner and incomplete fibrotic septa, comparable with fibrosis observed after two weeks of CCl4 (fig 3C), and reduced hepatic hydroxy proline content (fig 3F). Spleen volume was reduced (table 2), consistent with a decrease in portal hypertension.
Figure 3 Effects of pioglitazone (PGZ) treatment on progression of carbon tetrachloride (CCl4) induced hepatic fibrosis. Representative photomicrographs of Sirius red stained liver sections from rats who received CCl4 for two weeks (A), for five weeks without (B) or with (C) PGZ treatment for the last three weeks, for nine weeks without (D) or together with (E) PGZ treatment for the last four weeks (E). Original magnification 5×. Quantification of hepatic hydroxy (OH) proline content (F) in rats injected twice weekly with CCl4 for the indicated periods of time and in rats treated with PGZ for the last three weeks of the five week CCl4 regimen or the last four weeks of the nine week CCl4 regimen (CCl4 + PGZ). Data are mean (SD) for n = 5/group.***p<0.001 compared with 2 wk CCl4 livers; †p<0.05, ††p<0.01 compared with similar treatment at five weeks.
Table 2 Effect of carbon tetrachloride (CCl4) and pioglitazone (PGZ) treatment on body weight, liver weight, and spleen weight.
| Control | CCl4 2 wk | CCl4 5 wk | CCl4 2 wk + CCl4/PGZ 3 wk | CCl4 9 wk | CCl4 5 wk + CCl4/PGZ 4 wk | |
|---|---|---|---|---|---|---|
| Body weight (g) | 287 (35) | 314 (47) | 356 (26) | 366 (39) | 439 (21) | 397 (41) |
| Liver (g) | 11.3 (1.3) | 13.0 (1.4) | 14.3 (2.1) | 15.6 (1.5) | 15.5 (2.4) | 12.4 (4.0) |
| Liver to body weight ratio | 3.93 (0.25) | 4.18 (0.47) | 4.01 (0.45) | 4.3 (0.71) | 3.53 (0.47) | 3.07 (0.75) |
| Spleen (g) | 0.83 (0.04) | 0.97 (0.14)* | 1.37 (0.10)*,† | 1.15 (0.12)*,†,‡ | 1.87 (0.06)*,†,‡ | 1.9 (0.410)*,†,‡ |
*p<0.05 or higher degree of significance versus controls.
†p<0.05 or higher degree of significance versus CCl4 2 wk.
‡p<0.05 or higher degree of significance versus CCl4 5 wk.
After nine weeks of CCl4, the architecture of the liver was severely distorted (fig 3D). This cirrhotic organisation was associated with a further increase in hepatic hydroxy proline content (fig 3F) and signs of portal hypertension, such as ascites (present in all rats) and increased spleen volume (table 2). PGZ treatment initiated after five weeks of CCl4 did not alter the severity of hepatic fibrosis, as demonstrated by the presence of an equally severe cirrhosis (fig 3E), similarly high hydroxy proline content (fig 3F), ascites, and increased spleen volume (table 2) in CCl4 5 wk + CCl4/PGZ 4 wk and CCl4 9 wk groups.
Effect on HSC activation
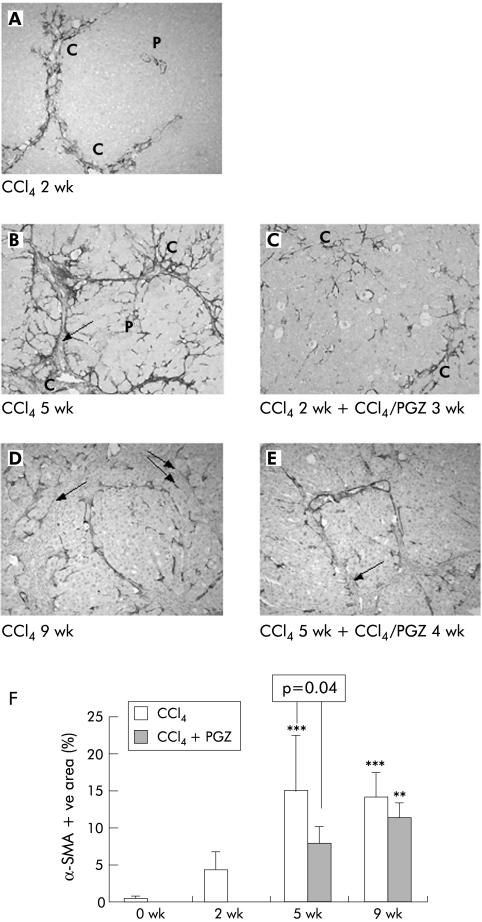
CCl4 injections for five weeks led to a progressive increase in the number of α‐SMA positive cells in the pericentral zone, fibrotic septa, and infiltrating the lobules from the edges of the septa (fig 4A, B). At nine weeks, α‐SMA positive cells were found at the junction between the thick fibrotic band and the parenchyma which they infiltrate, but not inside the fibrotic bands (fig 4D). Morphometric analysis (fig 4F) confirmed that PGZ treatment initiated after two weeks of CCl4 significantly reduced the area occupied by α‐SMA positive cells compared with five weeks of CCl4 rats (p = 0.04) but no difference was seen between CCl4 5 wk + CCl4/PGZ 4 wk and CCl4 9 wk rats (fig 4C, E, F).
Figure 4 Effects of pioglitazone (PGZ) treatment on the distribution and quantification of α smooth muscle actin (α‐SMA) positive hepatic cells during progression of carbon tetrachloride (CCl4) induced hepatic fibrosis. Representative photomicrographs of α‐SMA immunostained liver sections from rats receiving CCl4 for two weeks (A), for five weeks without (B) or with (C) PGZ treatment for the last three weeks, for nine weeks without (D) or together with (E) PGZ treatment for the last four weeks. P, portal tract, C, central vein. Note that no α‐SMA positive cells were found in the thick fibrotic bundles (arrows). Original magnification 5×. (F) Quantification of hepatic area occupied by α‐SMA positive cells in rats injected twice weekly with CCl4 for the indicated periods of time and in rats treated with PGZ for the last three weeks of the five week CCl4 regimen or the last four weeks of the nine week CCl4 regimen (CCl4 + PGZ). Data are expressed as mean (SD) percentage of α‐SMA positive area related to the total area of the section for n = 5/group. **p<0.01, ***p<0.001 compared with 2 wk CCl4 livers.
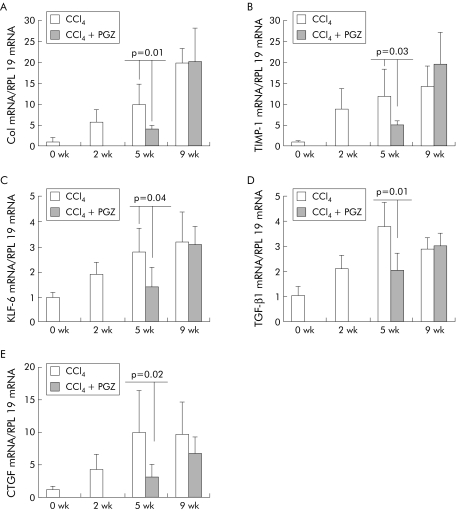
mRNA levels for collagen I and TIMP‐1 increased with duration of CCl4 injections. Compared with five weeks of CCl4, PGZ treatment introduced after two weeks of CCl4 reduced collagen I mRNA to levels obtained prior to its administration and significantly decreased upregulation of TIMP‐1. In contrast, PGZ introduced after five weeks of CCl4 did not alter collagen I or TIMP‐1 mRNA compared with rats receiving CCl4 alone for nine weeks (fig 5A, B). As expected, KLF‐6, TGFβ1, and CTGF mRNA were upregulated in the livers of CCl4 rats. PGZ treatment, when introduced after two weeks but not when introduced after five weeks, reduced expression of these profibrogenic genes consistent with the observed effect on hepatic fibrosis (fig 5–E).
Figure 5 Effects of pioglitazone (PGZ) on hepatic collagen type I (Col), tissue inhibitor of metalloproteinase (TIMP‐1), Kruppel‐like factor 6 (KLF‐6), transforming growth factor β1 (TGF‐β1), and connective tissue growth factor (CTGF) mRNA levels during progression of carbon tetrachloride (CCl4) induced hepatic fibrosis. Expression of type I collagen (A), T IMP‐1 (B), KLF‐6 (C), TGF‐β1 (D), and CTGF (E) mRNA determined by real time polymerase chain reaction in the liver of rats treated with CCl4 alone or together with PGZ for the last three weeks of the five week CCl4 regimen or the last four weeks of the nine week CCl4 regimen. Values are normalised to expression of RLP19 mRNA, regarded as an invariant control, and expressed in relation to the mean value in untreated controls arbitrarily set at 1. Data are mean (SD) (n = 5/group). There were no significant differences between values obtained in 9 wk CCl4 rats, treated or not with PGZ.
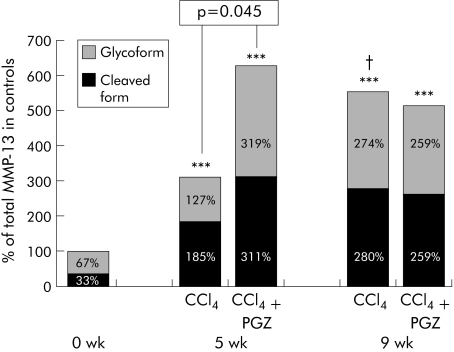
The cleaved form of MMP‐13 was increased 6 and 8.5‐fold after five and nine weeks of CCl4, respectively (fig 6). In five week CCl4 rats, PGZ treatment initiated after two weeks enhanced MMP‐13 expression and, in particular, cleaved MMP‐13 (p = 0.045). In contrast, the level of MMP‐13 after nine weeks of CCl4 remained unchanged whether or not PGZ was introduced (fig 6).
Figure 6 Effect of pioglitazone (PGZ) on the cleaved and glycoforms of matrix metalloproteinase 13 (MMP‐13) in the liver of carbon tetrachloride (CCl4) rats. Mean optical density of the glycosylated inactive form of MMP‐13 and the cleaved form of MMP‐13. Separation by electrophoresis of total liver homogenate in non‐denaturing conditions resolved the glycosylated form at 65–70 kDa and the cleaved MMP‐13 at 45–50 kDa (see methods). Data are mean for n = 5 per group, in duplicate, with 100% arbitrarily attributed to the sum of the glycosylated and cleaved forms of MMP‐13 in control livers. ***p<0.001 compared with control livers; †p<0.05 compared with five week CCl4 livers under similar conditions. There were no significant differences between values obtained in 9 wk CCl4 rats, treated or not with PGZ.
Effect on liver injury and intrahepatic inflammation
PPARγ stimulation confers anti‐inflammatory properties.21,22,23 As shown in table 3, PGZ given between weeks 2 and 5 did not prevent the rise in serum ALT. Ishak's score of liver damage and parenchymal inflammation was no different in animals treated or not with PGZ (table 3). Also, hepatocyte proliferative response to toxic hepatocellular necrosis, as assessed by PCNA expression, did not differ whether treated or not with PGZ (not shown). Increased hepatic mRNA for inflammatory mediators interleukin (IL)‐6, IL‐1β, IL‐8 (CINC), and MCP‐1, as well as iNOS protein observed in CCl4 rats were not significantly altered by PGZ treatment (table 3).
Table 3 Effect of carbon tetrachloride (CCl4) and pioglitazone (PGZ) treatment on ALT, necroinflammation, hepatic expression of proinflammatory mediators, and hepatic iNOS protein.
| Control | CCl4 5 wk | CCl4 2 wk + CCl4/PGZ 3 wk | |
|---|---|---|---|
| ALT (IU/l) | 48 (12) | 345 (189)† | 332 (168)†* |
| Ishak's score necrosis | 0.1 (0.1) | 4.8 (2.7)† | 4.4 (1.9)†* |
| Ishak's score+inflammation | 0.3 (0.2) | 8.5 (4.4)† | 7.3 (3.2)†* |
| IL‐6 mRNA‡ | 1 (0.2) | 5.2 (1.8)† | 7.0 (2.5)†* |
| IL‐1β mRNA‡ | 1 (0.2) | 9.2 (4.2)† | 14.3 (3.7)†* |
| MCP‐1 mRNA‡ | 1 (0.4) | 2.1 (0.5)† | 3.2 (2.2)†* |
| CINC (IL‐8) mRNA‡ | 1 (0.6) | 13.5 (2.2)† | 10.8 (3.1)†* |
| iNOS protein§ | 35 (11) | 108 (32)† | 153 (41)†* |
ALT, alanine aminotransferase; IL, interleukin; MCP‐1, monocyte chemoattractant protein; iNOS, inducible nitric oxide synthase.
‡Hepatic mRNA levels measured by real time polymerase chain reaction using RPL‐19 mRNA as an invariant control and expressed relative to values in the control group arbitrarily set at 1 (see materials and methods).
§Hepatic protein measured by western blotting and expressed as a ratio of the optical density of the iNOS band to that of β‐actin, used as a loading control (see materials and methods).
*No significant difference in PGZ treated versus CCl4 only rats.
†p<0.05 or higher degree of significance versus controls.
Is the therapeutic effect on fibrosis mediated via modulation of release of adiponectin?
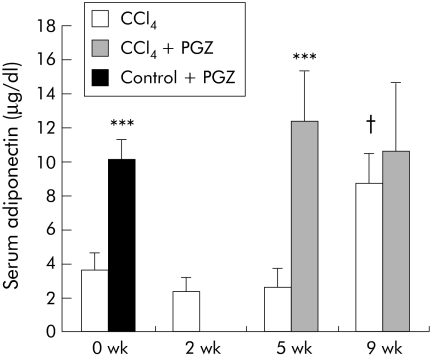
Adiponectin, regulated by PPARγ, has been shown to be antifibrotic in mice.24,25,26 CCl4 for up to five weeks did not alter circulating levels of adiponectin. PGZ significantly increased adiponectin concentrations by a factor of 5 in rats injected with CCl4 for five weeks (fig 7). In rats administered CCl4 for nine weeks, serum levels of adiponectin were significantly higher than in controls. Contrasting with induction of expression of adipocyte specific CD36 mRNA (fig 2), administration of PGZ in this group was not associated with a further increase in serum adiponectin (fig 7).
Figure 7 Effects of pioglitazone (PGZ) on serum levels of adiponectin in carbon tetrachloride (CCl4) treated rats. Serum adiponectin was determined by radioimmunoassay and is presented as mean (SD) for n = 5 per group in rats injected twice weekly with CCl4 for the indicated periods of time and in rats treated with PGZ for the last three weeks of the five week CCl4 regimen or the last four weeks of the nine week CCl4 regimen. Control rats were fed the PGZ supplemented diet for two weeks as a positive control for PGZ effect. ***p<0.001 for groups treated with PGZ compared with groups not treated with PGZ at the same times of CCl4 injections. †p<0.05 in 9 wk CCl4 rats compared with other times of CCl4 injection.
Evaluation of the therapeutic effect of PGZ on fibrosis induced by a choline deficient diet
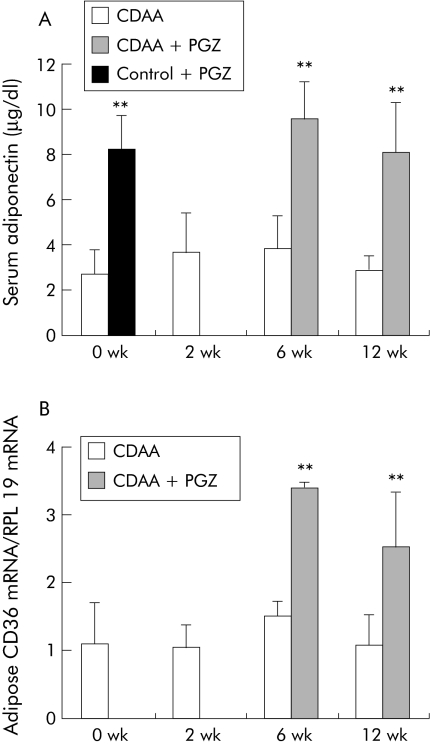
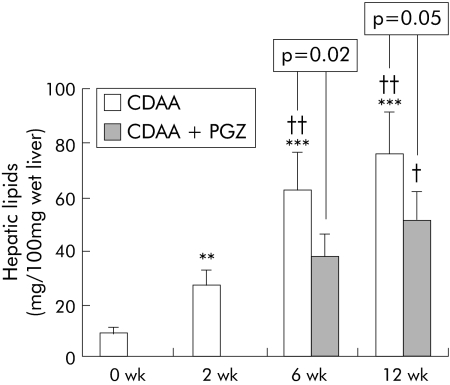
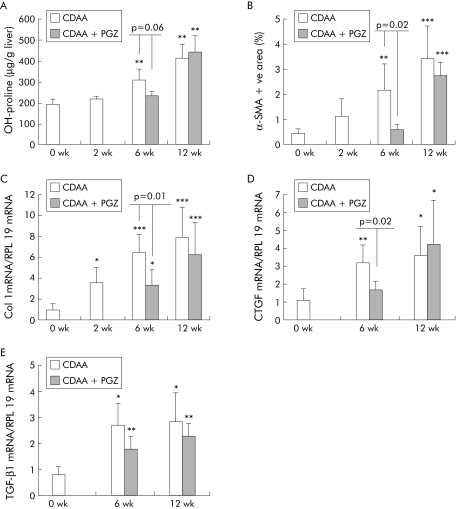
PGZ induced expression of PPARγ regulated CD36 mRNA in adipose tissue in all time groups (see fig 10B). Compared with rats fed the CDAA diet for six weeks, hepatic lipids were decreased in the CDAA 2 wk + CDAA/PGZ 4 wk group (fig 8). Histological collagen deposits appeared to be reduced in five of six livers compared with six week non‐PGZ treated CDAA fed rats (not shown) and, accordingly, PGZ reduced hydroxy proline content by 30% (fig 9A). PGZ treatment for the last six weeks of the 12 week CDAA feeding period also significantly reduced hepatic lipid content (fig 8) but had no significant effect on collagen deposits (not shown) or hepatic hydroxy proline content (fig 9A)
Figure 10 Effects of pioglitazone (PGZ) on serum level of adiponectin and adipose expression of CD36 mRNA in choline deficient L‐amino acid (CDAA) fed rats. (A) Serum adiponectin determined by radioimmunoassay. (B) CD36 mRNA in adipose tissue determined by real time polymerase chain reaction in rats fed the CDAA diet for the indicated time periods (n = 5 per group) or who received the PGZ supplemented CDAA diet for the last four weeks of the six week regimen or for the last six weeks of the 12 week regimen (n = 6 per group). Control rats were fed the PGZ supplemented diet for two weeks as a positive control for PGZ effect. Data are mean (SD).
Figure 8 Effects of a choline deficient L‐amino acid (CDAA) diet and pioglitazone (PGZ) on total liver lipid content. Total lipid content in the liver of rats fed CDAA for the indicated time periods or receiving the PGZ supplemented CDAA for the last four weeks of the six week regimen or for the last six weeks of the 12 week regimen. Data are mean (SD) for n = 5 per group. **p<0.01, ***p<0.001 compared with 0 wk CDAA (controls); †p<0.05, ††p<0.01 compared with 2 wk CDAA fed rats.
Figure 9 Effects of pioglitazone (PGZ) treatment on collagen deposit, activation of hepatic stellate cells, and expression of collagen I, connective tissue growth factor (CTGF), and transforming growth factor β1 (TGF‐β1) in choline deficient L‐amino acid (CDAA) induced hepatic fibrosis. Quantification of hepatic hydroxy (OH) proline content (A), quantification of hepatic area occupied by α smooth muscle actin (α‐SMA) positive cells expressed as percentage of the total hepatic section (B), and hepatic type I collagen (C), CTGF (D), and TGF‐β1 (E) mRNA determined by real time polymerase chain reaction in rats fed the CDAA diet for the indicated times or who received the PGZ supplemented CDAA diet for the last four weeks of the six week regimen or for the last six weeks of the 12 week regimen. Values were normalised to expression of RLP19 mRNA regarded as an internal control, and expressed in relation to the mean value in untreated controls arbitrarily set at 1. All data are expressed as mean (SD) for n = 5/group. *p<0.05, **p<0.01, ***p<0.001 compared with 0 wk CDAA (controls).
CDAA increased in a time dependent manner the number of α‐SMA positive cells (fig 9B) and induced type I collagen gene expression (fig 9C) as well as CTGF and TGF‐β1 hepatic transcripts (fig 9D, E). In the livers of animals treated with PGZ between weeks 2 and 6, α‐SMA positive cells were significantly fewer and collagen and CTGF mRNA expression significantly reduced (fig 9). In contrast, PGZ administered for the last six weeks of the 12 week feeding protocol had no effect on the number of α‐SMA positive activated HSC or on collagen I, TGF‐β1, or CTGF mRNA levels (fig 9).
Serum adiponectin remained unchanged during CDAA feeding and increased in response to PGZ, irrespective of the timing for initiation of the treatment (fig 10A).
Absence of therapeutic effect of PGZ on fibrosis induced by bile duct ligation
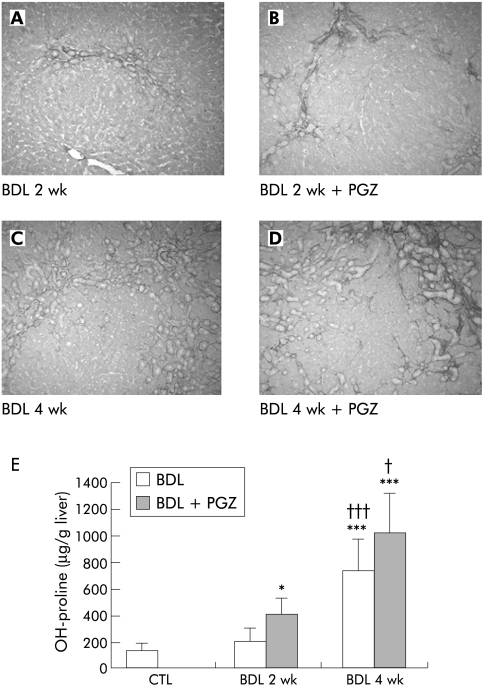
PGZ significantly induced CD36 mRNA expression in adipose tissue by a factor of 8 in BDL + PGZ 2 wk, and by a factor of 6 in BDL + PGZ 4 wk rats compared with untreated BDL rats at the same times, confirming its biological activity. Proliferation of neo‐bile ducts associated with moderate fibrosis around the neostructures occurred after two weeks of BDL (fig 11A). After four weeks, fibrosis associated with bile duct proliferation progressed to form a continuous meshwork of connective tissue (fig 11C). In BDL rats, PGZ from day 5 to 14 or from day 14 to 28 did not alter serum bilirubin levels (not shown), the degree of bile duct proliferation, or hepatic fibrosis. As shown in figure 11, hepatic fibrosis appears as severe (if not more) and hydroxy proline as increased in the BDL+PGZ group than in the BDL alone group at both time points.
Figure 11 Effects of pioglitazone (PGZ) treatment on the progression of hepatic fibrosis induced by bile duct ligation (BDL). Representative photomicrographs of Sirius red stained liver sections from rats two weeks (A) or four weeks (B) after BDL, and from rats who received a PGZ supplemented diet from day 5 to day 14 post‐BDL (BDL 2 wk + PGZ) (C) or from day 14 to day 28 post BDL (BDL 4 wk + PGZ) (D). Original magnification 5×. Quantification of hepatic hydroxy (OH) proline content in the different treatment groups (E). Data are expressed as mean (SD) for n = 4/group.*p<0.05, *** p<0.001 compared with untreated control livers; †p<0.05, †††p<0.001 compared with 2 wk BDL livers similarly treated.
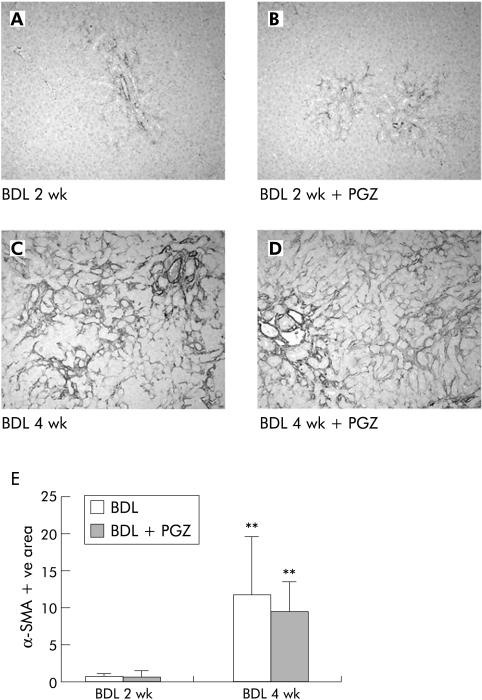
The number of α‐SMA positive cells progressively increased over time forming a mesh bridging the portal areas and remained unchanged in the liver of PGZ treated BDL rats (fig 12). Similarly, PGZ did not reduce upregulation of collagen I, TGF‐β1, or CTGF mRNA levels induced by BDL (not shown).
Figure 12 Effects of pioglitazone (PGZ) treatment on the distribution and quantification of α smooth muscle actin (α‐SMA) positive hepatic cells during progression of hepatic fibrosis induced by bile duct ligation (BDL). Representative photomicrographs of α‐SMA immunostained liver sections from rats two weeks (A) or four weeks (B) after BDL, or from rats who received a PGZ supplemented diet from day 5 to day 14 post‐BDL (BDL 2 wk + PGZ) (C) or from day 14 to day 28 post BDL (BDL 4 wk + PGZ) (D). Original magnification 10×. Quantification of hepatic area occupied by α‐SMA positive cells in the different treatment groups (E). Data are expressed as the mean (SD) percentage of α‐SMA positive area related to the total area of the section for n = 4/group. **p<0.01 compared with 2 wk BDL livers similarly treated.
Compared with controls, BDL was associated with a mild increase in serum adiponectin (4.1 (1.2), 4.3 (0.9), and 2.6 (1.1) μg/dl in BDL 4 wk, BDL 2 wk, and controls, respectively). PGZ increased levels of serum adiponectin to 9.3 (2.2), 7.1 (1.9), and 8.1 (1.5) μg/dl in BDL + PGZ 4 wk, BDL + PGZ 2 wk, and controls + PGZ, respectively. These data demonstrate that PGZ, although biologically active, had no efficacy in the treatment of cholestatic fibrosis, even when introduced at an early stage after induction of hepatic cholestasis.
Discussion
Although thiazolidinedione drugs have been shown to prevent hepatic fibrosis,10,11,12,27 PGZ provided a limited benefit in the treatment of established fibrosis. Indeed, we showed that PGZ arrested the progression of hepatic fibrosis induced by CCl4 or chronic feeding of a choline deficient diet, but only if the drug was introduced early in the course of disease progression. In addition, there was no therapeutic benefit of PGZ in cholestatic fibrosis induced by ligation of the common bile duct, irrespective of the severity of fibrosis at the time of initiation of treatment.
In the five week CCl4 model, PGZ introduced after two weeks limited progression of fibrosis, upregulation of collagen I and TIMP‐1 mRNA, two genes chiefly expressed by HSC during fibrogenesis,28,29,30 and repressed further recruitment of activated α‐SMA positive HSC. PGZ treatment was also associated with decreased expression of TGF‐β1 and CTGF, two potent autocrine profibrotic mediators.31,32 All of these changes indicate that PGZ, directly or indirectly, reduced the number and/or activation of matrix producing cells, thereby blocking fibrosis progression. In addition, levels of MMP‐13, a bioactive protein that can degrade fibrillar collagen, were higher in the liver of rats treated with PGZ than in those receiving CCl4 alone. Therefore, in accordance with previous reports, it is possible that PGZ, by maintaining expression of MMP‐13 while reducing that of its inhibitor TIMP‐1, might create an imbalance favouring matrix degradation.7,11 In contrast, PGZ treatment introduced at a later stage of disease progression (that is, after five weeks of CCl4 when HSC are fully activated and collagen bundles form thick septa) failed to reduce HSC activation and collagen production and to stimulate extracellular matrix degradation, suggesting a relationship between the severity of underlying fibrosis at the time of initiation of treatment and therapeutic efficacy.
Rats fed the CDAA diet develop macrovesicular steatosis, parenchymal inflammation, and progressive perisinusoidal fibrosis.42,43 Whether introduced after two or six weeks, PGZ therapy was associated with an improvement in fatty liver, induction of CD36 mRNA expression in adipose tissue, and enhanced production of adiponectin. Reduction in fibrosis was however observed only when the medication was given early.
Direct stimulation of PPARγ in HSC has been evoked as a mechanism responsible for the preventive effect of PGZ in hepatic fibrosis.6 PGZ is indeed a ligand for the transcription factor PPARγ. As shown by some authors7,8,9 but not confirmed by others,33 rat primary HSC express PPARγ and their culture activation is associated with decreased expression of PPARγ. PPARγ stimulation prevents in vitro activation of quiescent HSC.7,8,9,10 It is thus conceivable that, during fibrogenesis, PPARγ agonist could block activation of quiescent HSC and prevent them from being recruited into the pool of active cells which produce fibrillar ECM. If so, the antifibrotic effect of PGZ would be related to the number or proportion of quiescent cells (sensitive to PPARγ agonists) versus activated HSC (resistant to PPARγ stimulation) at the time of initiation of treatment. Our observation that PGZ arrested progression of CCl4 or CDAA induced fibrosis when given early but not at a more advanced stage (that is, when a larger proportion of HSC would be in the activated state) is compatible with this concept. However, in our experiment, the therapeutic efficacy of PGZ was not strictly related to the intensity/severity of fibrosis nor to the number of activated HSC at the time of initiation of treatment (compare figs 3 and 9). Alternatively, the efficacy of PGZ in blocking fibrosis progression might be related to the duration of the pathogenic process or to the number of quiescent HSC remaining in the liver when the treatment is introduced. Because of the lack of specific markers for quiescent cells (desmin and glial fibrillar antigen protein also being present in α‐SMA positive activated cells at the junction between the lobules and fibrous band (data not shown)34), this proposition cannot be directly tested.
Interestingly, despite its proven preventive effect7 also confirmed by us (not shown), PGZ failed to reduce (and even seems to have aggravated) progression of cholestatic fibrosis. The nature of matrix producing cells activated in the BDL model might provide an alternative explanation. It is believed that after BDL, periportal myofibroblast rather than intralobular perisinusoidal HSC are preferentially recruited and activated to produce extracellular matrix components.35,36,37,38,39,40 Miyahara et al have shown that both expression of PPARγ1 and PPRE binding significantly decreased in myofibroblastic cells isolated from one week BDL rats compared with HSC isolated from sham operated animals.7 Hence the differential response to PGZ between BDL and CCl4 or CDAA models might be explained by a more rapid or more synchronous loss of PPARγ in fibrocompetent effector cells in BDL than by other profibrotic stimuli. Further studies are warranted to determine the level of PPARγ expression in periportal myofibroblast and perisinusoidal HSC and the kinetics of expression of this transcription factor in the two cell types during fibrogenesis in vivo. Additionally, hepatic biodistribution of PGZ could be altered by cholestasis although appropriate upregulation of PPARγ dependent CD36 in adipose tissue confirms the extrahepatic effects of the drug.
Cells of the monocyte/macrophage lineage express PPARγ22,23,41 and its stimulation by PPARγ agonists decrease inflammation.21,42,43 In the liver also, PPARγ agonists protect against inflammation,6869 an effect attributed to decreased cytokine production by Kupffer cells.44,46 As Kupffer cells and inflammatory cells are important modulators of hepatic fibrogenesis,28,47,48 decreased hepatic inflammation resulting from PPARγ stimulation might interfere with fibrogenesis. The score of Ishak for hepatocellular lesions and inflammation,15 serum ALT, and induction of various proinflammatory factors were not different in CCl4 rats whether treated or not with PGZ, providing no support for the proposition that the antifibrotic effect of PGZ, in our experimental settings, could be related to its anti‐inflammatory properties.
PPARγ exerts positive transcriptional control over adiponectin gene expression.25,26 Because adiponectin has been shown to be fibroprotective,24 it is plausible that adiponectin mediates, at least in part, the antifibrotic properties of PGZ. PGZ treatment was associated with increased levels of serum adiponectin in all of our experimental models, except in the nine week CCl4 group. In this later group, adipose CD36 mRNA expression and serum adiponectin levels were high, and PGZ, while enhancing CD36 mRNA, did not induce a further increase in serum adiponectin. This suggests dysregulation of the biological function of adipose tissue caused by chronic administration of the toxic lipophilic compound CCl4 or, alternatively, associated with CCl4 induced cirrhosis. In the CCl4 model, there was a parallelism between increased adiponectin levels induced by PGZ treatment and the resulting antifibrotic effect. This parallelism between change in serum adiponectin and therapeutic response to PGZ was however not found in the CDAA and BDL models. Our data thus fail to provide a clear correlation between serum adiponectin and the therapeutic antifibrotic benefit of PGZ. Additional studies using genetically modified animals are warranted to determine whether, and if so, in which setting and in what proportion, adiponectin is implicated in the preventive and therapeutic effect of PPARγ agonist.
In conclusion, the present study demonstrates that, although proven effective in the prevention of hepatic fibrosis in rodents, the PPARγ agonist PGZ has a limited therapeutic effect. The nature of the injurious mechanism leading to fibrosis, duration of the underlying liver disease, and/or severity of fibrosis at the time of initiation of PGZ treatment influence the therapeutic potential of such a drug. Direct control of HSC biology, anti‐inflammatory properties, as well as control of expression of adipocytokines, could be implicated in the antifibrotic effect of PPARγ agonists. Further studies are warranted to determine the mechanism(s) by which PGZ interferes with progression of fibrosis and to define specific indications for the potential use of this drug in clinical practice.
Acknowledgements
We thank Mr Jorge Abarca‐Quinones and Mrs Martine Stevens for the histological stainings and Dr Pierre Moulin, Pathology Department, UCL, Brussels, for development of the software for the morphometric study. We are also grateful to Ms Christine De Saeger and Valérie Lebrun for expert technical assistance. This work was supported by a grant from the Université Catholique de Louvain (FSR) to IL and from the Belgian National Founds for Scientific Research (FNRS convention No 3‐4611.04) to IL and YH. IL is currently a research associate with the FNRS.
Abbreviations
PPARγ - peroxisome proliferator activated receptor γ
CCl4 - carbon tetrachloride
BDL - bile duct ligation
HSC - hepatic stellate cells
PGZ - pioglitazone
CDAA - choline deficient L‐amino acid
α‐SMA - α smooth muscle actin
GFAP - glial fibrillar acidic protein
ALT - alanine aminotransferase
RT‐PCR - reverse transcription‐polymerase chain reaction
SDS - sodium dodecyl sulphate
TIMP‐1 - tissue inhibitor of metalloproteinase
TGF‐β1 - transforming growth factor β1
CTGF - connective tissue growth factor
KLF‐6 - Kruppel‐like factor 6
MCP‐1 - monocyte chemoattractant protein
MMP‐13 - matrix metalloproteinase 13
PCNA - proliferating cell nuclear antigen
iNOS - inducible nitric oxide synthase
IL - interleukin
Footnotes
Conflict of interest: None declared.
References
- 1.Evans R M, Barish G D, Wang Y X. PPARs and the complex journey to obesity. Nat Med 200410355–361. [DOI] [PubMed] [Google Scholar]
- 2.Pershadsingh H A. Peroxisome proliferator‐activated receptor‐gamma: therapeutic target for diseases beyond diabetes: quo vadis? Expert Opin Investig Drugs 200413215–228. [DOI] [PubMed] [Google Scholar]
- 3.Ferre P. The biology of peroxisome proliferator‐activated receptors: relationship with lipid metabolism and insulin sensitivity. Diabetes 200453(suppl 1)S43–S50. [DOI] [PubMed] [Google Scholar]
- 4.Yki‐Jarvinen H. Thiazolidinediones. N Engl J Med 20043511106–1118. [DOI] [PubMed] [Google Scholar]
- 5.Lehmann J M, Moore L B, Smith‐Oliver T A.et al An antidiabetic thiazolidinedione is a high affinity ligand for peroxisome proliferator‐activated receptor gamma (PPAR gamma). J Biol Chem 199527012953–12956. [DOI] [PubMed] [Google Scholar]
- 6.Hazra S, Xiong S, Wang J.et al Peroxisome proliferator‐activated receptor gamma induces a phenotypic switch from activated to quiescent hepatic stellate cells. J Biol Chem 200427911392–11401. [DOI] [PubMed] [Google Scholar]
- 7.Miyahara T, Schrum L, Rippe R.et al Peroxisome proliferator‐activated receptors and hepatic stellate cell activation. J Biol Chem 200027535715–35722. [DOI] [PubMed] [Google Scholar]
- 8.Marra F, Efsen E, Romanelli R G.et al Ligands of peroxisome proliferator‐activated receptor gamma modulate profibrogenic and proinflammatory actions in hepatic stellate cells. Gastroenterology 2000119466–478. [DOI] [PubMed] [Google Scholar]
- 9.Galli A, Crabb D, Price D.et al Peroxisome proliferator‐activated receptor gamma transcriptional regulation is involved in platelet‐derived growth factor‐induced proliferation of human hepatic stellate cells. Hepatology 200031101–108. [DOI] [PubMed] [Google Scholar]
- 10.Galli A, Crabb D W, Ceni E.et al Antidiabetic thiazolidinediones inhibit collagen synthesis and hepatic stellate cell activation in vivo and in vitro. Gastroenterology 20021221924–1940. [DOI] [PubMed] [Google Scholar]
- 11.Kawaguchi K, Sakaida I, Tsuchiya M.et al Pioglitazone prevents hepatic steatosis, fibrosis, and enzyme‐altered lesions in rat liver cirrhosis induced by a choline‐deficient L‐amino acid‐defined diet. Biochem Biophys Res Commun 2004315187–195. [DOI] [PubMed] [Google Scholar]
- 12.Kon K, Ikejima K, Hirose M.et al Pioglitazone prevents early‐phase hepatic fibrogenesis caused by carbon tetrachloride. Biochem Biophys Res Commun 200229155–61. [DOI] [PubMed] [Google Scholar]
- 13.Nakae D, Yoshiji H, Mizumoto Y.et al High incidence of hepatocellular carcinomas induced by a choline deficient L‐amino acid defined diet in rats. Cancer Res 1992525042–5045. [PubMed] [Google Scholar]
- 14.Sakaida I, Kubota M, Kayano K.et al Prevention of fibrosis reduces enzyme‐altered lesions in the rat liver. Carcinogenesis 1994152201–2206. [DOI] [PubMed] [Google Scholar]
- 15.Ishak K, Baptista A, Bianchi L.et al Histological grading and staging of chronic hepatitis. J Hepatol 199522696–699. [DOI] [PubMed] [Google Scholar]
- 16.Starkel P, Sempoux C, Leclercq I.et al Oxidative stress, KLF6 and transforming growth factor‐beta up‐regulation differentiate non‐alcoholic steatohepatitis progressing to fibrosis from uncomplicated steatosis in rats. J Hepatol 200339538–546. [DOI] [PubMed] [Google Scholar]
- 17.Sempoux C, Guiot Y, Dahan K.et al The focal form of persistent hyperinsulinemic hypoglycemia of infancy: morphological and molecular studies show structural and functional differences with insulinoma. Diabetes 200352784–794. [DOI] [PubMed] [Google Scholar]
- 18.Leclercq I A, Farrell G C, Schriemer R.et al Leptin is essential for the hepatic fibrogenic response to chronic liver injury. J Hepatol 200237206–213. [DOI] [PubMed] [Google Scholar]
- 19.Colin I M, Nava E, Toussaint D.et al Expression of nitric oxide synthase isoforms in the thyroid gland: evidence for a role of nitric oxide in vascular control during goiter formation. Endocrinology 19951365283–5290. [DOI] [PubMed] [Google Scholar]
- 20.Delaisse J M, Eeckhout Y, Neff L.et al (Pro)collagenase (matrix metalloproteinase‐1) is present in rodent osteoclasts and in the underlying bone‐resorbing compartment. J Cell Sci 19931061071–1082. [DOI] [PubMed] [Google Scholar]
- 21.Delerive P, Fruchart J C, Staels B. Peroxisome proliferator‐activated receptors in inflammation control. J Endocrinol 2001169453–459. [DOI] [PubMed] [Google Scholar]
- 22.Jiang C, Ting A T, Seed B. PPAR‐gamma agonists inhibit production of monocyte inflammatory cytokines. Nature 199839182–86. [DOI] [PubMed] [Google Scholar]
- 23.Ricote M, Li A C, Willson T M.et al The peroxisome proliferator‐activated receptor‐gamma is a negative regulator of macrophage activation. Nature 199839179–82. [DOI] [PubMed] [Google Scholar]
- 24.Kamada Y, Tamura S, Kiso S.et al Enhanced carbon tetrachloride‐induced liver fibrosis in mice lacking adiponectin. Gastroenterology 20031251796–1807. [DOI] [PubMed] [Google Scholar]
- 25.Maeda N, Takahashi M, Funahashi T.et al PPARgamma ligands increase expression and plasma concentrations of adiponectin, an adipose‐derived protein. Diabetes 2001502094–2099. [DOI] [PubMed] [Google Scholar]
- 26.Iwaki M, Matsuda M, Maeda N.et al Induction of adiponectin, a fat‐derived antidiabetic and antiatherogenic factor, by nuclear receptors. Diabetes 2003521655–1663. [DOI] [PubMed] [Google Scholar]
- 27.Yuan G J, Zhang M L, Gong Z J. Effects of PPARg agonist pioglitazone on rat hepatic fibrosis. World J Gastroenterol 2004101047–1051. [DOI] [PMC free article] [PubMed] [Google Scholar]
- 28.Friedman S L. Molecular regulation of hepatic fibrosis, an integrated cellular response to tissue injury. J Biol Chem 20002752247–2250. [DOI] [PubMed] [Google Scholar]
- 29.Arthur M J. Fibrogenesis II. Metalloproteinases and their inhibitors in liver fibrosis. Am J Physiol Gastrointest Liver Physiol 2000279G245–G249. [DOI] [PubMed] [Google Scholar]
- 30.Nakatsukasa H, Nagy P, Evarts R P.et al Cellular distribution of transforming growth factor‐beta 1 and procollagen types I, III, and IV transcripts in carbon tetrachloride‐induced rat liver fibrosis. J Clin Invest 1990851833–1843. [DOI] [PMC free article] [PubMed] [Google Scholar]
- 31.Bissell D M, Roulot D, George J. Transforming growth factor beta and the liver. Hepatology 200134859–867. [DOI] [PubMed] [Google Scholar]
- 32.Rachfal A W, Brigstock D R. Connective tissue growth factor (CTGF/CCN2) in hepatic fibrosis. Hepatol Res 2003261–9. [DOI] [PubMed] [Google Scholar]
- 33.Hellemans K, Rombouts K, Quartier E.et al PPARbeta regulates vitamin A metabolism‐related gene expression in hepatic stellate cells undergoing activation. J Lipid Res 200344280–295. [DOI] [PubMed] [Google Scholar]
- 34.Niki T, De Bleser P J, Xu G.et al Comparison of glial fibrillary acidic protein and desmin staining in normal and CCl4‐induced fibrotic rat livers. Hepatology 1996231538–1545. [DOI] [PubMed] [Google Scholar]
- 35.Cassiman D, Libbrecht L, Desmet V.et al Hepatic stellate cell/myofibroblast subpopulations in fibrotic human and rat livers. J Hepatol 200236200–209. [DOI] [PubMed] [Google Scholar]
- 36.Libbrecht L, Cassiman D, Desmet V.et al The correlation between portal myofibroblasts and development of intrahepatic bile ducts and arterial branches in human liver. Liver 200222252–258. [DOI] [PubMed] [Google Scholar]
- 37.Knittel T, Kobold D, Piscaglia F.et al Localization of liver myofibroblasts and hepatic stellate cells in normal and diseased rat livers: distinct roles of (myo‐)fibroblast subpopulations in hepatic tissue repair. Histochem Cell Biol 1999112387–401. [DOI] [PubMed] [Google Scholar]
- 38.Kinnman N, Francoz C, Barbu V.et al The myofibroblastic conversion of peribiliary fibrogenic cells distinct from hepatic stellate cells is stimulated by platelet‐derived growth factor during liver fibrogenesis. Lab Invest 200383163–173. [DOI] [PubMed] [Google Scholar]
- 39.Tao L H, Enzan H, Hayashi Y.et al Appearance of denuded hepatic stellate cells and their subsequent myofibroblast‐like transformation during the early stage of biliary fibrosis in the rat. Med Electron Microsc 200033217–230. [DOI] [PubMed] [Google Scholar]
- 40.Magness S T, Bataller R, Yang L.et al A dual reporter gene transgenic mouse demonstrates heterogeneity in hepatic fibrogenic cell populations. Hepatology 2004401151–1159. [DOI] [PubMed] [Google Scholar]
- 41.Uchimura K, Nakamuta M, Enjoji M.et al Activation of retinoic X receptor and peroxisome proliferator‐activated receptor‐gamma inhibits nitric oxide and tumor necrosis factor‐alpha production in rat Kupffer cells. Hepatology 20013391–99. [DOI] [PubMed] [Google Scholar]
- 42.Nakajima T, Kamijo Y, Tanaka N.et al Peroxisome proliferator‐activated receptor alpha protects against alcohol‐induced liver damage. Hepatology 200440972–980. [DOI] [PubMed] [Google Scholar]
- 43.Su C G, Wen X, Bailey S T.et al A novel therapy for colitis utilizing PPAR‐gamma ligands to inhibit the epithelial inflammatory response. J Clin Invest 1999104383–389. [DOI] [PMC free article] [PubMed] [Google Scholar]
- 44.Enomoto N, Takei Y, Hirose M.et al Prevention of ethanol‐induced liver injury in rats by an agonist of peroxisome proliferator‐activated receptor‐gamma, pioglitazone. J Pharmacol Exp Ther 2003306846–854. [DOI] [PubMed] [Google Scholar]
- 45.Ohata M, Suzuki H, Sakamoto K.et al Pioglitazone prevents acute liver injury induced by ethanol and lipopolysaccharide through the suppression of tumor necrosis factor‐alpha. Alcohol Clin Exp Res 200428(suppl 8)139–44S. [DOI] [PubMed] [Google Scholar]
- 46.Uchimura K, Nakamuta M, Enjoji M.et al Activation of retinoic X receptor and peroxisome proliferator‐activated receptor‐gamma inhibits nitric oxide and tumor necrosis factor‐alpha production in rat Kupffer cells. Hepatology 20013391–99. [DOI] [PubMed] [Google Scholar]
- 47.Eng F J, Friedman S L. Fibrogenesis I. New insights into hepatic stellate cell activation: the simple becomes complex, Am J Physiol Gastrointest Liver Physiol 2000279G7–11. [DOI] [PubMed] [Google Scholar]
- 48.Maher J J. Interactions between hepatic stellate cells and the immune system. Semin Liver Dis 200121417–426. [DOI] [PubMed] [Google Scholar]


