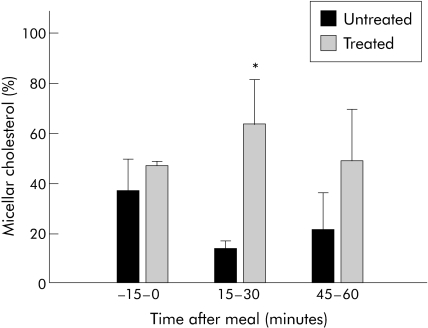
Figure 3 Distribution of cholesterol in micelles of lumenal samples of subjects after a liquid meal. Lumenal samples were separated into micellar and non‐micellar particles at three different time points during the lumenal collection. Data are presented as μg cholesterol per sample for subjects untreated or treated with bile acid therapy. Significant difference between untreated and treated percentages (*p<0.05). Data are means (SEM).

An official website of the United States government
Here's how you know
Official websites use .gov
A
.gov website belongs to an official
government organization in the United States.
Secure .gov websites use HTTPS
A lock (
) or https:// means you've safely
connected to the .gov website. Share sensitive
information only on official, secure websites.
