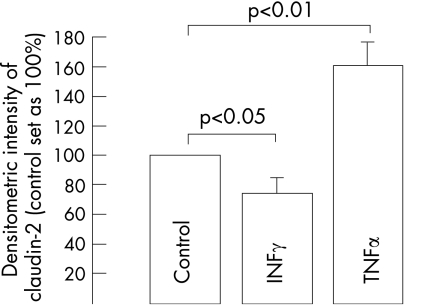
Figure 6 Immunoblot of claudin 2 in HT‐29/B6 cell monolayers after 24 h of treatment with interferon γ (IFNγ, 1000 U/ml), tumour necrosis factor α (TNFα, 100 ng/ml) or without treatment (control). Signal intensity of the 22‐kDa claudin 2 specific band from the untreated control was set as 100% and was compared with cytokine‐treated cells on the same blot. Values represent means (SEM).

An official website of the United States government
Here's how you know
Official websites use .gov
A
.gov website belongs to an official
government organization in the United States.
Secure .gov websites use HTTPS
A lock (
) or https:// means you've safely
connected to the .gov website. Share sensitive
information only on official, secure websites.
