Abstract
Background
Blood flowing across the vascular endothelium creates wall shear stress, dependent on velocity of flow and vessel geometry, that tends to disrupt lymphocyte–endothelial cell adhesion.
Objective
The microcirculation in a murine model of acute colitis was investigated to identify structural adaptations during acute colitis that may facilitate transmigration.
Methods
In 2,4,6‐trinitrobenzenesulphonic acid‐induced acute colitis, the infiltrating cells and colonic microcirculation was investigated by cellular topographic mapping, corrosion casting and three‐dimensional scanning electron microscopy (SEM). Colonic blood velocimetry was performed using intravital microscopy.
Results
Clinical and histological parameters suggested a peak inflammatory response at 96 h (p<0.001). The infiltrating cells were spatially related to the mucosal capillary plexus by three‐dimensional topographic mapping (p<0.001). In normal mice, corrosion casting and three‐dimensional SEM showed a polygonal mucosal plexus supplied by ascending arteries and descending veins. After 2,4,6‐trinitrobenzenesulphonic acid stimulation, three‐dimensional SEM showed preserved branch angles (p = 0.52) and nominal vessel lengths (p = 0.93), but a significantly dilated mucosal capillary plexus (p<0.001). Intravital microscopy of the mucosal plexus showed a greater than twofold decrease in the velocity of flow (p<0.001).
Conclusions
The demonstrable slowing of the velocity of flow despite an increase in volumetric flow suggests that these microvascular adaptations create conditions suitable for leucocyte adhesion and transmigration.
The development of peripheral mononuclear cell inflammation requires the migration of cells out of the microcirculation and into the extravascular site of inflammation.1 The process of transmigration is generally considered to be a multistep sequence involving leucocyte binding to and transmigrating across endothelial cells.2 In the initial step of this process, the migrating cells must overcome the wall shear stress created by blood flowing across the endothelial surface.
Wall shear stress in the normal microcirculation, estimated to be in the order of 10–100 dyn/cm2,3,4 is dependent on the velocity of flow and vessel geometry. During inflammation, there is a two to three‐fold increase in regional blood flow.5 As wall shear stress increases proportionate to flow, wall shear stress may rise even further during inflammation. An apparent contradiction is that in vitro assessments of lymphocyte–endothelial interactions in simplified flow conditions indicate that adhesions are infrequent when wall shear stress is >1–2 dyn/cm.2,6,7,8 These results suggest a >10 fold discrepancy between wall shear stress in vivo and the levels that permit lymphocyte–endothelial cell adhesion.
Previous work has shown that lymphocyte adhesion and transmigration in the skin of sheep occurs in specially adapted microvessels termed microangiectasias.9,10 Microangiectasias are focally enlarged vascular segments that are associated with a reduction in the velocity of flow and wall shear stress.10 It is unknown whether complementary adaptations exist in the gut microcirculation. To investigate microvascular changes in the inflammatory gut, a murine model of 2,4,6‐trinitrobenzenesulphonic acid (TNBS)‐induced colitis was investigated. Microvascular dilatations of the mucosal plexus, analogous to microangiectasias, were found to be temporally and spatially associated with TNBS‐induced perivascular mononuclear inflammation.
Methods
Mice
Male Balb/c mice (Jackson Laboratory, Bar Harbor, Maine, USA), 25–33 g (n = 256), were used in all experiments. The care of the animals was consistent with guidelines of the American Association for Accreditation of Laboratory Animal Care (Bethesda, Maryland, USA) and approved by the Institutional Animal Care and Use Committee of the Brigham & Women's Hospital and Harvard Medical School (Massachussets, USA).
TNBS administration
After the abdomen of the mouse was sheared and cleansed with water, 36 μl of 2.5% 2,4,6‐trinitrochlorobenzene (TNCB; ChemArt, Egling, Germany) in a 4:1 acetone:olive oil solution was sprayed on a 1.5 cm diameter circular PhastTransfer Filter Paper (Pharmacia, Upsala, Sweden). The TNCB‐soaked filter paper was applied to the sheared abdomen and secured with Tegaderm (3 M, St Paul, Minnesota, USA) and Durapore Surgical Tape (3M). The TNCB patch was removed 24 h after application. On day 6 post‐sensitisation, 125 μl of 1.75% TNBS (Sigma, St Louis, Missouri, USA) in a 50% ethanol vehicle was instilled into the rectum. Control mice were treated with vehicle alone.
Clinical assessment of colitis
Total body weight was assessed daily. Activity level and fur ruffling were scored daily on a 0 (normal) to 2 (severe) scale.
Histology
After euthanasia, the tissues were harvested and immediately processed. The tissue was snap‐frozen, sliced into 1 cm long segments, coated with tissue freezing medium (Triangle Biomedical Sciences, Durham, North Carolina, USA) and placed in 15 mm cryomoulds. The cryomoulds were frozen in liquid nitrogen‐cooled isopentane and stored at −80°C until sectioning. The slides were stained in Harris haematoxylin (Harris Modified, StatLab, Lewisville, Texas, USA) for 2 min followed by sequential rinses including a brief acid rinse. The slides were counterstained with Eosin Y (Sigma) for 20 s, then rinsed in ethanol and xylene (Fisher, Fair Lawn, New Jersey, USA) followed by mounting with Vectashield mounting medium (Vector, Burlingame, California, USA).
Three‐Dimensional tissue mounts
The spatial association of the infiltrating cells and the microcirculation was defined by fluorescent vessel painting11 and topographic mapping. After systemic heparinisation, the aorta was cannulated and perfused with 15 ml of 37°C phosphate buffered saline (PBS) followed by perfusion with a buffered 2.5% glutaraldehyde solution (Sigma). The systemic circulation was perfused with 1,1‐dioctadecyl‐3,3,3,3‐tetramethylindocarbocyanine perchlorate (10–25 ml) as described previously.11 Immediately after tracer infusion, the organs were harvested, prepared in a 25°C PBS bath, and fixed overnight between glass slides in 4% formalin. After a brief rinse with distilled water, the specimens were stained with 4′,6‐diamidino‐2‐phenylindole (vector) and permanently mounted with Vectashield mounting medium (vector). The fluorescently labelled microvessels were imaged using a Nikon Eclipse TE2000 inverted epifluorescence microscope.
Topographic mapping
The tissue mounts of the carbocyanine tracer (ex 549 nm/em 565 nm) were counterstained with DAPI (ex 350 nm/em 461 nm). Excitation and emission filter wheels with 25 nm band pass filters (Omega, Brattleboro, Vermont, USA) permitted selective visualisation of the vessel and infiltrating mononuclear cells to facilitate morphometric thresholding. After Z axis distance calibration of the Z‐position linear encoder (Ludl, Hawthorne, New York), optical sections were obtained through a 250 μm ×250 μm grid digitally superimposed on the colonic mucosa. The optical sections were imaged and processed with standard Metamorph 6.26 (Molecular Devices, Brandywine, Pennsylvania, USA) filters on a Dell Xeon workstation running Windows XP Professional (Microsoft, Redmond, Washington, USA). The images were pseudocoloured, and multicolour images were digitally recombined to confirm the topographic mapping.
Scanning electron microscopy
After systemic heparinisation, PBS perfusion and intravascular fixation with 2.5% buffered glutaraldehyde, the systemic circulation was perfused with 10–20 ml of Mercox (SPI, West Chester, Pennsylvania, USA) diluted with 20% methyl methacrylate monomers (Aldrich Chemical, Milwaukee, Wisconsin, USA) as described previously.11,12 After complete polymerisation, the tissues were harvested and macerated in 5% potassium hydroxide followed by drying and mounting for scanning electron microscopy. The microvascular corrosion casts were imaged after coating with gold in an argon atmosphere with a Philips ESEM XL30 scanning electron microscope (Eindhoven, The Netherlands). Stereo‐pair images were obtained using a tilt angle of 6°.13,14
Quantitative morphometry
Diameters were interactively measured orthogonal to the vessel axis after storage of calibrated images, using AnalySIS software V.2.1. Inter‐branch and inter‐vessel distances were measured in stereo‐pairs using the KS 300 software (Kontron, Eching, Germany) as described previously in detail.
Intravital microscopy
The exteriorised colon was imaged using a Nikon Eclipse TE2000 inverted epifluorescence microscope using Nikon Fluor 10×, 20×, and 40× objectives. The intravital microscopy was performed using a custom‐machined titanium stage (Miniature Tool and Die, Charlton, Massachusetts, USA) that was directly attached to the objective. The tissue contact area consisted of 2‐mm vacuum galleries that provided tissue apposition to the lens surface without compression of the tissue and with minimal circulatory disturbances. An X‐Cite (Exfo; Vanier, Canada) 120 watt metal halide light source and a liquid light guide was used to illuminate the tissue samples. Excitation and emission filters (Chroma, Rockingham, Vermont, USA), in separate LEP motorised filter wheels, were controlled by a MAC5000 controller (Ludl) and MetaMorph software 6.26 (Molecular Devices). The intravital videomicroscopy 14‐bit fluorescent images were digitally recorded with an electron multiplier charge coupled device (EMCCD) camera (C9100‐02, Hamamatsu, Japan). Images with 1000×1000 pixel resolution were routinely obtained at frame rates exceeding 60 fps with 2×2 binning or subarray acquisition. The images were recorded in image stacks comprising 30 s–10 min video sequences. The image stacks were processed with standard MetaMorph filters. Routine distance calibration and thresholding was applied to the “stacked” image sequences.15
Particle tracking velocimetry
Particle tracking velocimetry was performed with nanoparticles developed by Molecular Probes (Invitrogen, Eugene, Oregon, USA) for intravascular particle tracking.15 These particles were of similar composition to those reported previously,16 but manufactured with superior fluorescent characteristics and a diameter of 500 nm. The 6.912×10⁹ injected green (ex 490 nm; em 520 nm) or orange (ex 545 nm; em 570 nm) nanoparticles was the equivalent spherical volume as 1 ml of erythrocytes. Intravascular fluorescence labeling was performed with the intravascular injection of 400 μl of 5‐(and‐6)‐carboxyfluorescein diacetate, succinimidyl ester (CFSE) (Molecular Probes, Eugene, Oregon, USA).17 Both the nanoparticles and CFSE dye were injected into the tail vein of an anaesthetised mouse over 2–3 min. The movement of individual particles was tracked using the MetaMorph (Molecular Devices) object tracking applications. The intensity centroids of the particles were identified and their displacements tracked through planes in the source image stack. For displacement reference, the algorithm used the location of the particle at its first position in the track. Each particle was imaged as a high contrast fluorescent disk and its position was determined with sub pixel accuracy. The image of the particle was tracked using a cross‐correlation centroid‐finding algorithm to determine the best match of the particle position in successive images.
Statistical analysis
Significance estimates were based on multiple comparisons of paired data by Student‐Newman–Keuls or Mann–Whitney U test for non‐parametric analysis of variance. The significance level for the sample distribution was denoted as p<0.001 when the calculated estimate exceeded 10−5.
Results
Induction of acute colitis
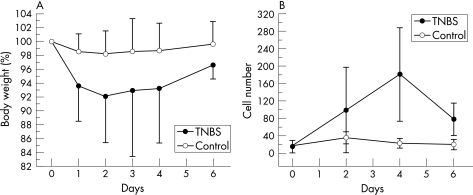
Consistent with previous reports,18 the rectal instillation of TNBS produced an inflammatory colitis. Clinical signs of inflammation such as decreased activity (86%) and ruffled fur (63%) were present in most of the mice. Total body weight, reflecting inflammation‐associated obstipation, progressively declined over 96 h followed by gradual resolution of the weight loss (fig 1A). Serial histological evaluation mirrored the clinical findings. The peak of mononuclear cell infiltration into the colonic wall occurred 4 days after exposure to antigen (fig 1B). Based on these findings, most of the subsequent morphological studies were performed 96 h after the instillation of TNBS.
Figure 1 The time course of 2,4,6‐trinitrobenzenesulphonic acid (TNBS)‐induced colitis reflected by (A) changes in total body weight and (B) the infiltration of perivascular mononuclear cells. The weight of the mice was expressed as a percentage of their baseline body weight (grams). The number of infiltrating mononuclear cells/250 μm ×250 μm grid was measured by image analysis of serial histological sections vertically sampled through the wall of the colon. Error bars reflect one standard deviation.
Colonic microcirculation
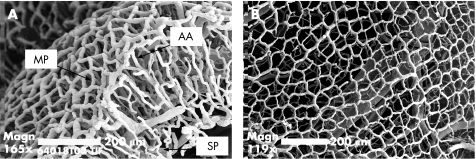
To define the normal vascular morphology of the mouse colon, corrosion casting and scanning electron microscopy was performed. Similar to findings in humans,13,19 the luminal aspect of the colon wall was defined by a polygonal mucosal network surrounding the crypts. A submucosal vascular network near the serosal surface was connected to the mucosal plexus by a dense network of ascending arterioles and parallel descending veins (fig 2).
Figure 2 The normal architecture of the colonic microcirculation in the mouse. (A) The polygonal subepithelial mucosal plexus (MP) is supplied by ascending arterioles (AA) and parallel descending veins connected to the submucosal plexus (SP). (B) The relatively uniform polygonal mucosal plexus surrounds colonic crypts (bar = 200 μm).
Topography of the cellular inflammation
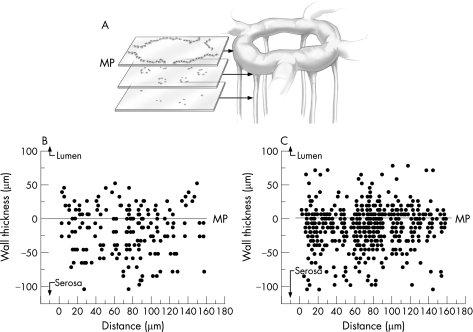
To determine the spatial relationship between the transmigrating mononuclear cells and the vascular microarchitecture in TNBS‐induced colitis, whole mounts of the colon wall were prepared after fluorescent vessel painting and counterstaining with DAPI. Three‐dimensional (z axis) optical sections of the colon tissue mounts showed that the mononuclear cells were spatially associated with the mucosal plexus (fig 3).
Figure 3 Topography of the 2,4,6‐trinitrobenzenesulphonic acid (TNBS)‐induced mononuclear infiltrate within the colon wall 4 days after the instillation of antigen. Serial optical sections of a 1‐mm2 grid were analysed in whole mounts of the colon wall for the presence of infiltrating mononuclear cells. The linearly encoded optical sections (5 μm intervals) were obtained for 400 μm thickness of the colon wall. In each section, the infiltrating mononuclear cells were counted using the MetaMorph cell counting application threshold on cell nuclei. The nuclei of crypt epithelial cells, readily identifiable by their distinctive structural orientation, were excluded from the analysis. The results of representative (A) control (n = 25) and (B) TNBS‐treated (n = 25) mice are shown. The mucosal capillary plexus was arbitrarily defined as 0 (line) with positive numbers extending to the lumenal surface and negative numbers extending to the serosal surface. MP, mucosal plexus.
Structural adaptation of the mucosal plexus
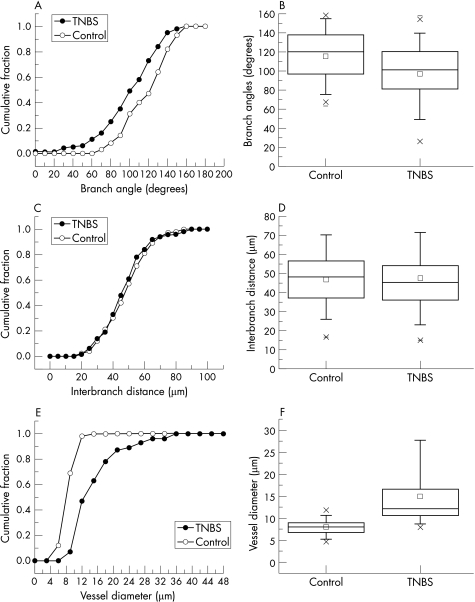
The structural adaptation of the mucosal plexus during TNBS‐induced colitis was investigated using fluorescent vessel painting and corrosion casting. Semi‐quantitative fluorescent vessel painting showed maximum changes in the diameter of the mucosal plexus 80–120 h after the instillation of antigen. To provide detailed morphometry of the dilated mucosal plexus, corrosion casting with 3‐D SEM and quantitative image analysis was performed at the peak of inflammation. Despite topographic variation in the degree of colitis, areas of intense inflammation were associated with marked dilatation of the mucosal capillary plexus (fig 4). Quantitative morphology of the mucosal plexus showed no change in branch angle (fig 5A,B; p = 0.52), or interbranch vessel length (fig 5C,D; p = 0.93), but a significant increase in vessel diameter (fig 5E,F; p<0.001).
Figure 4 Corrosion casting and scanning electron microscopy (SEM) of the colonic mucosal plexus. The microcirculation was casted 4 days after the intrarectal instillation of (A) vehicle control, or (B) 2,4,6‐trinitrobenzenesulphonic acid antigen (bar = 50 μm). In both conditions, the circulation was flushed and fixed before the infusion of low viscosity methyl methacrylate (Mercox). The surrounding tissue was corroded away and the resulting luminal cast was imaged using 3D (tilt‐angle) SEM.
Figure 5 Morphometry of microvessels in the colon mucosal plexus in mice treated with 2,4,6‐trinitrobenzenesulphonic acid (TNBS; n = 25) or vehicle alone (n = 25) 96 h after the instillation of antigen. Morphometric measurements, including branch angles (A,B), interbranch distance (C,D), and vessel diameter (E,F), were obtained on images from three dimensional‐scanning electron microscopy and plotted as cumulative frequency histograms (A,C,E) and box charts (B,D,F). The box charts show the 25–75 centile with 2 standard deviations of the mean delineated by error bars.
Flow velocity in the mucosal plexus
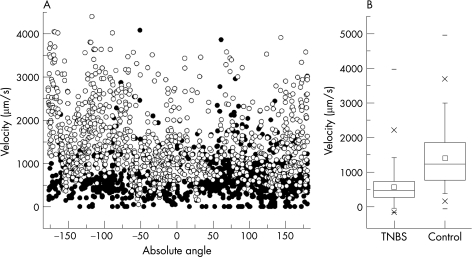
The functional consequences of the vascular dilatation were investigated by intravital microscopy. The cellular elements of the blood were labelled with intravenous CFSE and velocity tracers (500 nm fluorescent nanoparticles15) were injected into the blood. After intravenous injection, the nanoparticles were tracked in both TNBS‐induced colitis and control mice by epifluorescence intravital videomicroscopy. Videomicroscopy showed that the nanoparticle velocity was significantly lower in the inflamed microcirculation (mean (SD) 656 (463) μm/s; range 0–1094 μm/s), than in the normal mucosal plexus (1498 (826) μm/s; range 47–5078 μm/s) (p<0.001)(fig 6).
Figure 6 Velocity of the flow in the mucosal plexus during the peak of mucosal inflammation (4 days). (A) Scattergram of nanoparticles velocities recorded in the 2,4,6‐trinitrobenzenesulphonic acid (TNBS)‐induced acute colitis (dark circles; n = 6) and control (open circles; n = 6) mice. The velocities are arbitrarily shown as a function of vessel angle to facilitate presentation and to show the varied sampling of the 1000 measurements in each condition. (B) Statistical comparison of colitis and control nanoparticle velocity measurements. The box chart shows the 25–75 centile with two standard deviations of the mean delineated by error bars.
Discussion
In this report, we defined the normal murine colonic microcirculation: a polygonal mucosal plexus supplied by ascending arterioles and drained by parallel descending veins. Corrosion casting and SEM showed that induction of TNBS colitis was associated with a significant increase in the diameter of the mucosal plexus. Three lines of evidence suggested that these structural changes were functionally associated with mononuclear cell transmigration. First, the increase in microvessel diameter coincided with the peak of the perivascular mononuclear infiltrate. Secondly, topographic mapping showed that these structural changes in the mucosal plexus were spatially associated with the mononuclear infiltrate. Thirdly, the dilatation of the mucosal plexus was associated with a significant reduction in flow velocity during mucosal transit.
This work provides an explanation for the apparent conflict between observations of prominent blood vessels,20,21,22,23 increased blood flow24,25 and colonic ischaemia26 in studies of human and experimental colitis. These data suggest that the observed increase in vascularity reflects adaptive structural changes in the mucosal plexus. The dilatation of the mucosal plexus was sufficient to decrease blood flow velocity despite an increase in estimated volumetric flow. Thus, these findings indicate that vascular prominence, increased volumetric flow and decreased flow velocity can coexist in the inflammatory response to TNBS. Although our studies were limited to acute TNBS‐induced colitis, we speculate that these changes will be present in chronic disease as well.
The structural adaptations in the mucosal plexus are consistent with the results observed in the sheep skin—namely, microvessel dilatation temporally and spatially associated with perivascular mononuclear inflammation.9,10,27 In both the skin and colon, the vascular dilatations occurred in the microvessels closest to the administered antigen. In the skin, the epicutaneous application of antigen resulted in microangiectasias at the apex of the dermal capillary loop.10 In the colon, the intraluminal instillation of antigen resulted in dilatation of the mucosal plexus. Structural features of the two organs are also analogous. The transition of the narrow calibre ascending colonic arterioles into the dilated mucosal plexus is strikingly similar to the geometric transition observed in the skin microangiectasias.10 The structural difference between these two organs is that the dilated microvessels are connected in the gut mucosal plexus, whereas the capillary loops are isolated in the skin. The functional consequences of this interconnection of dilated microvessels are not clear.
We have previously proposed a microhaemodynamic hypothesis of lymphocyte transmigration: that lymphocyte adhesion and transmigration occurs in specialised segments exhibiting structural changes that contribute to decreased levels of flow velocity and wall shear stress.10 In this report, we have shown a decrease in the velocity of flow in TNBS‐treated mucosal plexus. Further, we have observed near‐zero flow velocities in many nanoparticles passing through the mucosal plexus. The geometric complexity of the colonic microcirculation, however, has so far precluded a reliable estimate of the velocity of flow in the ascending arteriole. As wall shear stress is sensitive to acute changes in vessel diameter,10 the transition from ascending arteriole to the mucosal plexus is a vascular segment likely to exhibit minimal wall shear stress. Future work will focus on more reliable estimates of flow velocity and transitional geometry in the ascending arterioles.
The temporal correlations observed in this study suggest that the time course of the vascular remodeling may be an important factor in determining the tempo of TNBS‐induced colitis—that is, the 3–4‐day delay between the instillation of TNBS and the recruitment of the mononuclear cells into mucosa. The delay may reflect the time necessary for the mural cells to reorganise and/or proliferate sufficiently to produce these changes in microvessel structure. Although the mitotic activity of the infiltrating mononuclear cells has complicated an assessment of endothelial cell proliferation, we suspect the magnitude of the remodeling is consistent with metabolic activation of these vascular lining cells. These findings are also compatible with altered endothelial responsiveness noted by Mori et al.28 From the viewpoint of lymphocyte migration, we suspect that the change in endothelial structure and function is associated with endothelial cell mitosis, changes in mural cell junctions and the enhanced expression of regulatory cell surface molecules.
Finally, we speculate that the mediators responsible for the vascular changes are known endothelial growth factors or inflammatory cytokines. Endothelial growth factors such as the vascular endothelial growth factor family have been associated with a variety of chronic inflammatory disorders including inflammatory bowel disease.29,30 In particular, ulcerative colitis and Crohn's disease have been associated with raised serum levels of vascular endothelial growth factor, basic‐fibroblast growth factor and transforming growth factor‐β.31,32,33 Similarly, the apparent interdependence of angiogenesis and inflammation suggests that cytokines previously associated with inflammation may have a direct influence on vascular remodeling. Cytokines such as granulocyte colony‐stimulating factor, granulocyte‐macrophage colony‐stimulating factor, tumour necrosis factor‐α, interleukin (IL) 1, IL6 and IL8 have been associated with a variety of angiogenic effects including endothelial cell proliferation and migration.34,35 Although the specific mediators remain unclear, the observation of inflammation‐induced structural changes in the colon microcirculation suggests the potential role for angiogenesis antagonists in the treatment of acute colitis.
Acknowledgements
We would like to thank Yu‐Zhong Zhang (Invitrogen) for kindly preparing the nanoparticles.
Abbreviations
CFSE - 5‐(and‐6)‐carboxyfluorescein diacetate succinimidyl ester
PBS - phosphate buffered saline
SEM - scanning electron microscopy
TNBS - 2,4,6‐trinitrobenzenesulphonic acid
TNCB - 2,4,6‐trinitrochlorobenzene
Footnotes
Funding: Supported in part by NIH Grant HL47078 and HL75426.
Competing interests: None.
References
- 1.West C A, Young A J, Mentzer S J. Lymphocyte traffic into antigen‐stimulated tissues. Transplant Rev 200014225–236. [Google Scholar]
- 2.Springer T A. Traffic signals for lymphocyte recirculation and leukocyte emigration: the multistep paradigm. Cell 199476301–314. [DOI] [PubMed] [Google Scholar]
- 3.Lipowsky H H, Kovalcheck S, Zweifach B W. The distribution of blood rheological parameters in the microvasculature of cat mesentery. Circ Res 197843738–749. [DOI] [PubMed] [Google Scholar]
- 4.Pries A R, Secomb T W, Gaehtgens P. Structural adaptation and stability of microvascular networks: theory and simulations. Am J Physiol 1998275(2 Pt 2)H349–H360. [DOI] [PubMed] [Google Scholar]
- 5.He C, Young A J, West C A.et al Stimulation of regional lymphatic and blood flow by epicutaneous oxazolone. J Appl Physiol 200293966–973. [DOI] [PubMed] [Google Scholar]
- 6.Li X, Su M, West C A.et al Effect of shear stress on efferent lymph‐derived lymphocytes in contact with activated endothelial monolayers. In Vitro Cell Dev Biol 200137599–605. [DOI] [PubMed] [Google Scholar]
- 7.Li X, Abdi K, Rawn J.et al LFA‐1 and L‐selectin regulation of recirculating lymphocyte tethering and rolling on lung microvascular endothelium. Am J Respir Cell Mol Biol 199614398–406. [DOI] [PubMed] [Google Scholar]
- 8.Melder R J, Munn L L, Yamada S.et al Selectin‐ and integrin‐mediated T‐lymphocyte rolling and arrest on TNF‐alpha‐activated endothelium: augmentation by erythrocytes. Biophys J 1995692131–2138. [DOI] [PMC free article] [PubMed] [Google Scholar]
- 9.West C A, He C, Su M.et al Focal topographic changes in inflammatory microcirculation associated with lymphocyte slowing and transmigration. Am J Physiol Heart Circ 2001281H1742–H1750. [DOI] [PubMed] [Google Scholar]
- 10.Secomb T W, Konerding M A, West C A.et al Microangioectasias: structural regulators of lymphocyte transmigration. Proc Natl Acad Sci U S A 20031007231–7234. [DOI] [PMC free article] [PubMed] [Google Scholar]
- 11.Ravnic D J, Jiang X, Wolloscheck T.et al Vessel painting of the microcirculation using fluorescent lipophilic tracers. Microvasc Res 20057090–96. [DOI] [PubMed] [Google Scholar]
- 12.Su M, West C A, Young A J.et al Dynamic deformation of migratory efferent lymph‐derived cells “trapped” in the inflammatory microcirculation. J Cell Physiol 200319454–62. [DOI] [PubMed] [Google Scholar]
- 13.Konerding M A, Fait E, Gaumann A. 3D microvascular architecture of pre‐cancerous lesions and invasive carcinomas of the colon. Br J Cancer 2001841354–1362. [DOI] [PMC free article] [PubMed] [Google Scholar]
- 14.Konerding M A, Fait E, Dimitropoulou C.et al Impact of fibroblast growth factor‐2 on tumor microvascular architecture. A tridimensional morphometric study. Am J Pathol 19981521607–1616. [PMC free article] [PubMed] [Google Scholar]
- 15.Ravnic D J, Zhang Y ‐ Z, Tsuda A.et al Multi‐image particle tracking velocimetry of the microcirculation using fluorescent nanoparticles. Microvasc Res 20067227–33. [DOI] [PubMed] [Google Scholar]
- 16.Bernard S L, Glenny R W, Polissar N L.et al Distribution of pulmonary and bronchial blood supply to airways measured by fluorescent microspheres. J Appl Physiol 199680430–436. [DOI] [PubMed] [Google Scholar]
- 17.Becker H M, Chen M, Hay J B.et al Tracking of leukocyte recruitment into tissues of mice by in situ labeling of blood cells with the fluorescent dye CFDA SE. J Immunol Methods 200428669–78. [DOI] [PubMed] [Google Scholar]
- 18.Neurath M, Fuss I, Strober W. TNBS‐colitis. Int Rev Immunol 20001951–62. [DOI] [PubMed] [Google Scholar]
- 19.Kruschewski M, Busch C, Dorner A.et al Angio‐architecture of the colon in Crohn disease and ulcerative colitis. Light microscopy and scanning electron microscopy studies with reference to the morphology of the healthy large intestine. Langenbecks Arch Chir 1995380253–259. [DOI] [PubMed] [Google Scholar]
- 20.Johansson H, Krause U, Olding L. Microangiographic studies in Crohn's disease and ulcerative colitis. Acta Chir Scand 1972138409–414. [PubMed] [Google Scholar]
- 21.Appleyard C B, Alvarez A, Percy W H. Temporal changes in colonic vascular architecture and inflammatory mediator levels in animal models of colitis. Dig Dis Sci 2002472007–2014. [DOI] [PubMed] [Google Scholar]
- 22.Kruschewski M, Foitzik T, Perez‐Canto A.et al Changes of colonic mucosal microcirculation and histology in two colitis models: an experimental study using intravital microscopy and a new histological scoring system. Dig Dis Sci 2001462336–2343. [DOI] [PubMed] [Google Scholar]
- 23.McLaren W J, Anikijenko P, Thomas S G.et al In vivo detection of morphological and microvascular changes of the colon in association with colitis using fiberoptic confocal imaging (FOCI). Dig Dis Sci 2002472424–2433. [DOI] [PubMed] [Google Scholar]
- 24.Foitzik T, Kruschewski M, Kroesen A.et al Does microcirculation play a role in the pathogenesis of inflammatory bowel diseases? Answers from intravital microscopic studies in animal models. Int J Colorectal Dis 19991429–34. [DOI] [PubMed] [Google Scholar]
- 25.Appleyard C B, Williams J L, Hathaway C A.et al Temporal patterns of colonic blood flow and tissue damage in an animal model of colitis. Dig Dis Sci 199944431–438. [DOI] [PubMed] [Google Scholar]
- 26.Carr N. Microvascular disease in the human large bowel. Gut 199639889–890. [DOI] [PMC free article] [PubMed] [Google Scholar]
- 27.West C A, He C, Young A J.et al Spatial variation of plasma flow in the oxazolone‐stimulated microcirculation. Inflamm Res 200251572–578. [DOI] [PubMed] [Google Scholar]
- 28.Mori M, Stokes K Y, Vowinkel T.et al Colonic blood flow responses in experimental colitis: time course and underlying mechanisms. Am J Physiol Gastrointest Liver Physiol 2005289G1024–G1029. [DOI] [PubMed] [Google Scholar]
- 29.Shibuya M. Structure and function of VEGF/VEGF‐receptor system involved in angiogenesis. Cell Struct Funct 20012625–35. [DOI] [PubMed] [Google Scholar]
- 30.Dvorak H F, Detmar M, Claffey K P.et al Vascular permeability factor/vascular endothelial growth factor: an important mediator of angiogenesis in malignancy and inflammation. Int Arch Allergy Immunol 1995107233–235. [DOI] [PubMed] [Google Scholar]
- 31.Kanazawa S, Tsunoda T, Onuma E.et al VEGF, basic‐FGF, and TGF‐beta in Crohn's disease and ulcerative colitis: a novel mechanism of chronic intestinal inflammation. Am J Gastroenterol 200196822–828. [DOI] [PubMed] [Google Scholar]
- 32.Griga T, Tromm A, Spranger J.et al Increased serum levels of vascular endothelial growth factor in patients with inflammatory bowel disease. Scand J Gastroenterol 199833504–508. [DOI] [PubMed] [Google Scholar]
- 33.Griga T, Voigt E, Gretzer B.et al Increased production of vascular endothelial growth factor by intestinal mucosa of patients with inflammatory bowel disease. Hepatogastroenterology 199946920–923. [PubMed] [Google Scholar]
- 34.Ezaki T, Baluk P, Thurston G.et al Time course of endothelial cell proliferation and microvascular remodeling in chronic inflammation. Am J Pathol 20011582043–2055. [DOI] [PMC free article] [PubMed] [Google Scholar]
- 35.Jackson J R, Bolognese B, Kircher C H.et al Modulation of angiogenesis in a model of chronic inflammation. 199746(Suppl 2)S129–S130. [DOI] [PubMed] [Google Scholar]


