Abstract
Aims
To compare ultrasonographic (US) predicting factors for conversion of choroidal naevi into melanomas.
Methods
659 consecutive eyes with choroidal naevi were examined between 1984 and 2004. 165 clinically suspicious naevi were followed clinically and ultrasonographically (thickness, base diameters, internal reflectivity and location in the eye) for 5.08 (SE 0.24) years.
Results
17 naevi (2.6% of all naevi, 10.3% of suspicious naevi) converted to small choroidal melanomas. The thickness of benign and premalignant naevi differed significant only after 1.5 years of follow up. The mean initial thickness of benign and premalignant naevi was significantly different (p = 0.001), as was mean initial internal reflectivity (p = 0.002) and mean initial largest base diameter (LBD, p = 0.05). Posterior pole and nasally located naevi were more likely to become malignant. A thickness of ⩾2 mm and a LBD ⩾7 mm were most predictive of conversion to melanoma, as was a combined KI index of ⩾14.5 (KI = LBD + 4 × thickness + 1 (for nasal location) + 1 (for posterior pole location)). An artificial neural network did not have a better forecasting accuracy than the KI index. Logistic regression found the only significant parameters to influence the risk of conversion to melanoma to be the KI value and the initial tumour thickness.
Conclusions
A follow up of at least 1.5 years is necessary to detect conversion of naevi to choroidal melanomas. The thickness and LBD of the lesion can be used for predicting the risk.
Keywords: choroidal neoplasm, naevus, melanoma, ophthalmic ultrasonography
Choroidal naevi are common lesions of the posterior pole that rarely transform into melanomas, although most choroidal melanomas are thought to arise from pre‐existing naevi.1 The incidence of choroidal naevi ranges from 2%2 to 6.5%3 of the population. Early detection of small choroidal melanoma has been correlated with better prognosis than detection at a medium or large size4 although even small tumours, measuring 3.0 mm or less in thickness, can lead to metastatic disease.5,6 The annual rate of malignant transformation of a choroidal naevus was estimated to be one in 8845.7
Shields et al6,8 reported that patients with small pigmented choroidal tumours are at risk for metastases if the tumour is greater than 2.0 mm in thickness, is juxtapapillary, is associated with symptoms, has orange pigment or subretinal fluid. Choroidal melanocytic tumours that display no factors have 3% chance for growth in 5 years, and most likely represent choroidal naevi.8 Tumours that display one factor have 38% chance to grow and those with two or more factors have more than 50% chance.8 The presence of documented growth in these small tumours increased three times the risk for metastatic disease compared with a tumour without growth.6
Shields et al9 also offered a combined scheme of predicting growth: the greatest risk for growth (63%) was observed when tumour thickness was greater than 2.0 mm, tumour margin touched disc, and subretinal fluid was present. The relative risk for growth increased from 1.9 times for one factor to 27.1 times for all five risk factors combined.
Our purpose was to define the ultrasonographic (US) parameters that predict conversion of choroidal naevi into uveal melanomas and to estimate their predictive ability.
Methods
In all, 659 eyes of 659 consecutive patients that were diagnosed with choroidal naevus on fundus examination underwent US evaluation with standardised A and B scans (B‐Scan “S” system (Biovision International, Paris, France) and I3 System (Innovative Imaging Inc, Sacramento, CA, USA)) at Hadassah Medical Center, between 1984 and 2004 (1759 examinations). Of those, 165 patients with clinically suspicious naevi (one or more criteria as defined by Shields et al8) continued clinical and US follow up, performing on average (SE) 5.9 (0.2) examinations (range 3–28), during a mean follow up period of 5.08 (0.24) years (range 3–17 years, mean time between examinations 12.8 (1.0) months). The collected US parameters included: naevus thickness, major and minor base diameters (the base area was later calculated as the area of an ellipse drown around those diameters/axes), internal reflectivity, location in the eye relative to the equator (anteroposterior location) and location relative to the optic disc (inferosuperior location and nasal‐temporal location).
Statistical analysis
Student's t test was used for continuous variables and χ2 test with Yates's correction for proportions (SPSS ver12 (SPSS Inc, Chicago, IL, USA)). Probabilities of less than 5% were considered statistically significant.
We compared the ability of the different ultrasonic parameters and of various functions combining those parameters to forecast malignant transformation of naevi by comparing their receiver operating characteristics (ROC) plots.10 The area under the ROC curve (AUC) represents the probability that a randomly selected premalignant naevus will be scored higher by the diagnostic parameter than a randomly selected benign naevus . The AUCs were compared based on the method suggested by Hanley and McNeil.11,12
We calculated the best diagnostic threshold from its likelihood ratio (LR, LR = sensitivity/1 − specificity). The LR is the likelihood of diagnosing a naevus as premalignant in a patient who eventually did develop melanoma, compared to the likelihood of diagnosing it premalignant in a patient who did not. It has advantages over sensitivity and specificity because it is less likely to change with the prevalence of melanoma.
Survival rates were plotted using the product limit method of Kaplan and Meier.13 Survival rates for each prognostic parameter were compared using the log rank test.14
A logistic regression analysis was performed to adjust for the simultaneous effects of the various US covariates on the risk of naevi conversion to melanoma.
Artificial neural networks
We constructed back propagation artificial neural networks (ANNs) composed of three layers of neurons and a variable number of neurons (2–8) in the hidden layer (Matlab 7; The MathWorks, Inc, Natick, MA, USA). The ANNs were trained to forecast conversion to melanoma on 80 randomly selected patients with naevi using the following parameters: which eye, initial naevus thickness (mm), initial largest base diameter (mm), initial base area (mm2), initial reflectivity (0%–100%), and location in the eyeball (anterior‐posterior, nasal‐temporal, upper‐lower). The training protocol was batch gradient descent. Thereafter, the network's performance was assessed on the remaining patients (n = 85), whose fate was unknown to the network. We compared the ANNs forecasting ability to the forecasting ability of the individual and combined US parameters by calculating their sensitivity, specificity, area under the ROC curve and likelihood ratios.
Results
Of 659 consecutive patients who were diagnosed with choroidal naevus on fundus examination, 165 patients with clinically suspicious naevi 8 continued clinical and US follow up, performing on average (SE) 5.9 (0.2) examinations (range 3–28). Seventeen of them (2.6% of all naevi, 10.3% of suspicious naevi) eventually transformed into small choroidal melanomas on average 19.7 (3.5) months (range 4–52 months) after the first examination. Six of them (35.3%) transformed during the first year of follow up and 13 (76.5%) during the first 2 years. Table 1 compares the US and demographic characteristics of those suspicious naevi that eventually converted into melanomas (premalignant naevi) and of those that did not (benign naevi).
Table 1 Comparison of the ultrasonographic (US) and demographic characteristics of clinically suspicious naevi.
| Clinically suspicious naevi characteristic | Benign naevi (n = 148) | Premalignant naevi (n = 17) | p Value benign v premalignant | |
|---|---|---|---|---|
| Which eye (% of naevi in the left eye) | 43.2% | 54.5% | p = 0.5 (χ2 test) | |
| Location in the eye | Posterior pole | 57.6% | 70.6% | p = 0.44 (χ2 test) |
| Superior retina | 47.0% | 56.3% | p = 0.64 (χ2 test) | |
| Nasal retina | 33.3% | 50% | p = 0.27 (χ2 test) | |
| First US examination | Thickness (mm (SD*)) | 1.74 (0.53) | 2.19 (0.40) | p = 0.001 (t test) |
| Largest base diameter (mm (SD)) | 6.1 (2.0) | 7.1 (1.9) | p = 0.05 (t test) | |
| Base area (mm2 (SD)) | 27.2 (16.3) | 34.0 (13.9) | p = 0.1 (t test) | |
| Internal reflectivity (% (SD)) | 71.2 (15.8) | 57.5 (24.3) | P = 0.002 (t test) | |
| Last US examination | Thickness (mm (SD)) | 1.49 (0.56) | 2.85 (0.92) | p<0.0001 (t test) |
| Largest base diameter (mm (SD)) | 6.4 (2.1) | 7.6 (3.0) | p = 0.03 (t test) | |
| Base area (mm2 (SD)) | 32.1 (19.4) | 53.6 (26.7) | p = 0.0001 (t test) | |
| Internal reflectivity (% (SD)) | 72.6 (18.0) | 40.8 (18.1) | p<0.0001 (t test) | |
| p Value (last v first US examination) t test | Thickness | p = 0.0001 | p = 0.009 | |
| Largest base diameter | p = 0.2 | p = 0.56 | ||
| Base area | p = 0.02 | p = 0.01 | ||
| Internal reflectivity | p = 0.47 | p = 0.03 | ||
*SD, standard deviation.
Location in the eye
For 156 (94.5%) naevi the antero‐posterior location in the eye was available; 92 (59%) of them were located in the posterior pole (18 of them were juxtapapillary). The risk of suspicious posterior pole naevi to convert to melanoma was 13% (12/92) compared to a 7.8% (5/64) risk for naevi located at the equator and anterior to it (p = 0.4, χ2 test, relative risk = 1.7). None of the 18 juxtapapillary naevi converted to melanoma.
Exact location (in clock hours relative to the optic disc) was known for 148 naevi: 52 (35.1%) were located in the nasal retina and 71 (48.0%) were located in the superior half of the retina. Eight (15.4%) of the nasal naevi converted into melanomas compared to eight (8.3%) of the temporal naevi (p = 0.3, χ2 test, relative risk = 1.9). Seven (9.1%) naevi located in the superior retina converted to melanomas, compared to nine (12.7%) in the inferior half (p = 0.6, χ2 test, relative risk = 1.4).
Thickness, base size, and internal reflectivity
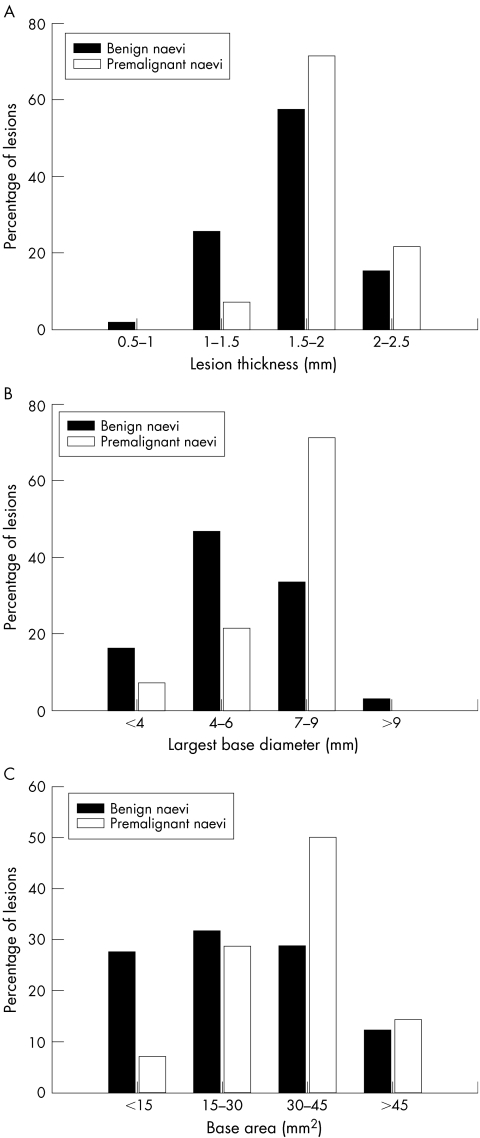
At the first examination the difference in mean (SE) thickness of benign and premalignant naevi was statistically significant (1.74 (0.13) mm v 2.19 (0.03) mm, respectively; p = 0.001, t test; fig 1A). None of the premalignant naevi was thinner than 1 mm at presentation. Similarly, the largest base diameter (LBD) was larger in premalignant naevi (p = 0.05, t test, fig 1B). The initial base area was also larger in premalignant naevi (but not statistically significant, fig 1C). The initial internal reflectivity of premalignant naevi was significantly lower (57.5% v 71.2%, p = 0.002, t test; see table 1).
Figure 1 Distribution of thickness (A), largest base diameter (LBD) (B), and base area (C) of benign and premalignant choroidal naevi at initial examination. The difference in thickness was statistically significant (p = 0.001, t test).
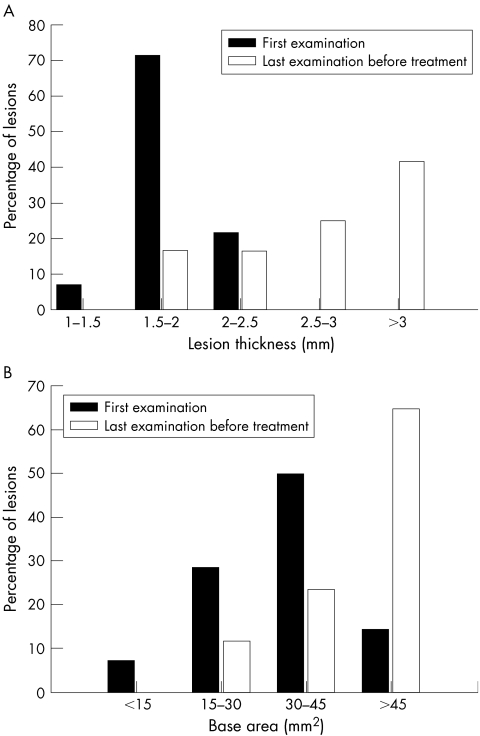
While the mean thickness of premalignant naevi increased from 2.19 (0.40) mm at first examination to 2.85 (0.92) mm at the time of diagnosis of choroidal melanoma (p = 0.009; fig 2A) the mean thickness of benign naevi decreased during follow up from 1.74 (0.53) mm to 1.49 (0.56) mm (p = 0.0001, t test). The LBD slightly increased in both benign and premalignant naevi (neither were statistically significant; see table 1). However, the mean base area of premalignant naevi increased by 57.6% (from 34.0 mm2 to 53.6 mm2; p = 0.01, t test, fig 2B) compared with an 18.0% increase in the mean base area of benign naevi (from 27.2 mm2 to 32.1 mm2; p = 0.02, t test). In the benign naevi internal reflectivity did not change significantly during follow up, while in the premalignant naevi it significantly decreased from 57.5% (24.3%) to 40.8% (18.1%) (p = 0.03, t test).
Figure 2 Change in thickness (A) and in base area (B) of premalignant naevi from the first to the last ultrasonographic examinations before brachytherapy (both were statistically significant, p = 0.009 and p = 0.01, t test).
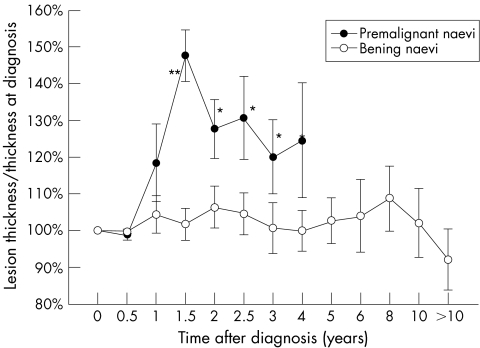
Figure 3 depicts the mean thickness of each group of naevi throughout the follow up period normalised to 100% at first examination. While the mean thickness of benign naevi remained stable, the mean thickness of the premalignant naevi was 18.4% (0.5%) thicker after 1 year (p = 0.4, t test) and 47.6% (7.0%) thicker after 1½ years (p<0.01, t test).
Figure 3 Mean thickness variation from baseline (normalised to 100% at first examination) of benign and premalignant choroidal naevi. Asterisks signify difference between benign and premalignant naevi. *p<0.05, **p<0.01 (Student's t test).
Forecasting the risk of conversion to melanoma
Since both the thickness and the LBD were significantly different in premalignant compared to benign naevi, we tried to define a combined metric that will forecast with better accuracy the risk of conversion to melanoma. We tested various combination functions (that included the thickness, LBD, base area, and location in the eye) and compared their forecasting accuracy by comparing the area under their ROC curve (AUC). The function:
KI = LBD + 4 × thickness + 1 (for nasal location) + 1 (for posterior pole location)
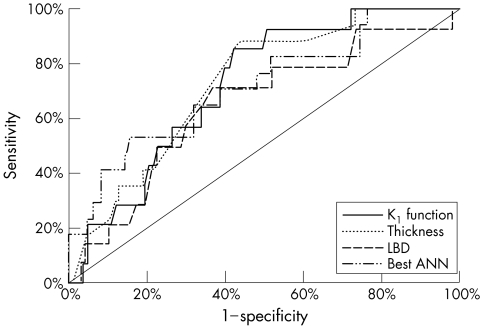
had the best AUC (72.3%). For comparison, the AUC of initial thickness alone was 66.7%, of initial LBD – 64.3%, of initial base area – 61.2% and of initial internal reflectivity – 61%. The best ANN (the one with five hidden neurons) reached an AUC of 71.7%. Figure 4 depicts the ROC curves of the best ANN, KI index, initial LBD, and initial thickness. Although KI had the best AUC, the difference between the ROC curves did not reach statistical significance. Based on the ROC curves, the best thresholds for diagnosing premalignant naevi would be KI⩾14.5 (sensitivity = 86%; specificity = 60%; LR+ = 2.1), thickness ⩾2 mm (sensitivity = 88%; specificity = 56%; LR+ = 2.0), LBD ⩾7 mm (sensitivity = 71%; specificity = 6 3%; LR+ = 1.9) initial internal reflectivity <60% (sensitivity = 47%; specificity = 83%; LR+ = 2.7) or initial base area ⩾30.7 mm (sensitivity = 64%; specificity = 64%; LR+ = 1.8).
Figure 4 The receiver operating characteristics (ROC) curves of the KI index, initial thickness, initial largest base diameter (LBD) and best artificial neural network (ANN, five hidden neurons). The area under the ROC curve (AUC) was 72.3% for KI index, 66.7% for thickness, 64.3% for LBD (p>0.05), and 71.7% for the ANN (difference not statistically significant).
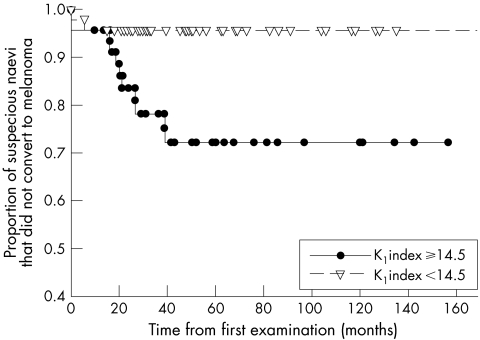
Of 92 suspicious naevi for which data were available to calculate the KI index, 46 (50%) had KI ⩾14.5. Of them, 11 (23.9%) converted to melanomas compared to only two (4.3%) of the 46 naevi with KI <14.5 (p = 0.01, χ2 test, relative risk = 5.6). Figure 5 shows the Kaplan‐Meier survival curves of naevi with a KI index ⩾14.5 compared with those with an index of <14.5. The difference between the curves was statistically significant (p = 0.004, log rank test).
Figure 5 Kaplan‐Meier survival curves of naevi with a KI index ⩾14.5 compared with those with an index of <14.5. The difference between the curves is statistically significant (p = 0.004, log rank test).
Logistic regression found the only significant parameters to influence the risk of conversion to melanoma to be the KI value (β = 1.60, p = 0.02) and the initial tumour thickness (β = 5.36, p = 0.04). Initial LBD (β = 1.24, p = 0.21), initial internal reflectivity (β = 0.02, p = 0.31), posterior location (β = 0.19, p = 0.79), nasal location (β = 1.25, p = 0.11), superior location (β = 0.29, p = 0.63), the eye involved (left or right, β = 0.42, p = 0.52), and the initial base area (β = 0.02, p = 0.77) did not contribute significantly to the model.
Discussion
In our series, 25% (165/659) of all naevi were considered suspicious, and 10.3% of suspicious naevi transformed to small melanomas. This is similar to Mims et al who reported that 10% of suspicious naevi grew in 4–30 months.15 Choroidal naevi seen by us had a 2.6% chance of converting to melanoma. This rate is much higher than in the general population (one in 88457) because we are a tertiary referral centre and not all benign naevi are referred to us. Once a naevus was referred to us at least 1.5 years of follow up were necessary to statistically distinguish between premalignant and benign naevi.
In agreement with a previous report,16 all naevi that were 1 mm or less in thickness did not convert to melanoma during the follow up period. Initial naevi thickness seems to be the most important risk factor for melanoma. A value of ⩾2 mm, as previous reported,8,15 seems to be the best cut point. The initial largest base diameter (LBD) also seems to suggest premalignancy. A cut point of 7 mm is most appropriate. In order to combine the forecasting power of the various US parameters, we devised a combined KI index. Although not statistically significant by itself, the “location in the eye” parameter seemed to contribute slightly to the KI model and the best KI formula did benefit slightly from this parameter. Although internal reflectivity seems to differ significantly among benign and premalignant naevi, we did not include it in our forecasting index since in our opinion its measurement is inaccurate in thin naevi. A cut point of KI ⩾14.5 seems to confer a 5.6 times increased risk for conversion to melanoma leading to a statistically significant difference in the Kaplan‐Meier survival curves.
Although the KI index had the best AUC, the difference between the AUCs did not reach statistical significance. This could be either due to the small number of melanomas in our database or it could suggest that either one of the US parameters (thickness or LBD) is as good a forecaster as their combination. The fact that the best ANN could not improve upon the forecasting accuracy of KI is suggestive that we have maximised the forecasting information that could be obtained from the data set.
Although we did not follow all 659 naevi ourselves, as we are the only treating ocular oncology service in Israel, if any of the 494 non‐suspicious naevi, which we did not follow, would have been diagnosed with uveal melanoma, the patient would have been referred to us for treatment. However, it is possible that some patients with non‐suspicious naevi did not continue follow up and their conversion to melanoma was not documented.
In conclusion, on average, benign choroidal naevi do not grow in size. An ultrasonic follow up of at least 1.5 years is necessary to distinguish between benign suspicious naevi and small choroidal melanomas. To forecast which suspicious naevus will convert to melanoma a thickness of ⩾2 mm and a largest base diameter of ⩾7 mm can be used or alternatively a combined KI index of ⩾14.5.
Abbreviations
ANNs - artificial neural networks
AUC - area under the ROC curve
LBD - largest base diameter
LR - likelihood ratio
ROC - receiver operating characteristics
US - ultrasonography
Footnotes
No competing interests exist for any of the authors.
References
- 1.Lee D S, Anderson S F, Perez E M.et al Amelanotic choroidal nevus and melanoma: cytology, tumor size and pigmentation as prognostic indicators. Optom Vis Sci 200178483–491. [DOI] [PubMed] [Google Scholar]
- 2.Murphy S F, Mahl C F, Bloom S M. Choroidal malignant melanoma. Optom Clin 1993363–77. [PubMed] [Google Scholar]
- 3.Sumich P, Mitchell P, Wang J J. Choroidal naevi in a white population: the Blue Mountains Eye Study. Arch Ophthalmol 1998116645–650. [DOI] [PubMed] [Google Scholar]
- 4.Diener West M, Hawkins B S, Markowitz J A.et al A review of mortality from choroidal melanoma. II. A meta‐analysis of 5‐year mortality rates following enucleation, 1966 through 1988. Arch Ophthalmol 1992110245–250. [DOI] [PubMed] [Google Scholar]
- 5.The Collaborative Ocular Melanoma Study Group Mortality in patients with small choroidal melanoma. COMS report no 4. Arch Ophthalmol 1997115886–893. [PubMed] [Google Scholar]
- 6.Shields C L, Shields J A, Kiratli H.et al Risk factors for growth and metastasis of small choroidal melanocytic lesions. Ophthalmology 19951021351–1361. [PubMed] [Google Scholar]
- 7.Singh A D, Kalyani P, Topham A. Estimating the risk of malignant transformation of a choroidal nevus. Ophthalmology 20051121784–1789. [DOI] [PubMed] [Google Scholar]
- 8.Shields C L, Shields J A. Clinical features of small choroidal melanoma. Curr Opin Ophthalmol 200213135–141. [DOI] [PubMed] [Google Scholar]
- 9.Shields C L, Cater J, Shields J A.et al Combination of clinical factors predictive of growth of small choroidal melanocytic tumors. Arch Ophthalmol 2000118360–364. [DOI] [PubMed] [Google Scholar]
- 10.Metz C. Basic principles of ROC analysis. Sem Nucl Med 19788283–297. [DOI] [PubMed] [Google Scholar]
- 11.Song H H. Analysis of correlated ROC areas in diagnostic testing. Biometrics 199753370–382. [PubMed] [Google Scholar]
- 12.Hanley J A, McNeil B J. A method of comparing the areas under receiver operating characteristic curves derived from the same cases. Radiology 1983148839–843. [DOI] [PubMed] [Google Scholar]
- 13.Kaplan E L, Meier P. Nonparametric estimation from incomplete observations. J Am Stat Assoc 195853457–481. [Google Scholar]
- 14.Mantel N. Evaluation of survival data and two new rank order statistics arising in its consideration. Cancer Chemother Rep 196650163–170. [PubMed] [Google Scholar]
- 15.Mims J L, 3rd, Shields J A. ollow‐up studies of suspicious choroidal naevi. Ophthalmology 197885929–943. [DOI] [PubMed] [Google Scholar]
- 16.Grishina E E, Kruzhkova G V. Vozmozhnosti ul'trazvukovoi biometrii v differentsial'noi diagnostike nachal'nykh melanom i nevusov khorioidei. Vestn Oftalmol 199110744–46. [PubMed] [Google Scholar]


