

Abstract
Outcome following traumatic brain injury (TBI) is in large part determined by the combined action of multiple processes. In order to better understand the response of the central nervous system to injury, we utilized an antibody array to simultaneously screen 507 proteins for altered expression in the injured hippocampus, a structure critical for memory formation. Array analysis indicated 41 candidate proteins have altered expression levels 24 hours after TBI. Of particular interest was catechol-O-methyl transferase (COMT), an enzyme involved in metabolizing catecholamines released following neuronal activity. Altered catecholamine signaling has been observed after brain injury, and may contribute to the cognitive dysfunctions and behavioral deficits often experienced after TBI. Our data shows that COMT expression in the injured ipsilateral hippocampus was elevated for at least 14 days after controlled cortical impact injury. We found strong co-localization of COMT immunoreactivity with the microglia marker Iba1 near the injury site. Since dopamine transporter expression has been reported to be down-regulated after brain injury, COMT-mediated catecholamine metabolism may play a more prominent role in terminating catecholamine signaling in injured areas.
Keywords: antibody array, dopamine, norepinephrine, COMT, TBI
INTRODUCTION
The central nervous system (CNS) response to trauma is complex, and involves axonal injury, cell death, neuronal dysfunction, impaired plasticity and altered neurotransmission. Since outcome after traumatic brain injury (TBI) is dependent on the combined action of a diverse assortment of gene products, global analysis of alterations in mRNA and protein expression is likely to provide a better overall description of TBI pathophysiology [5,6,12]. In this study, we used an antibody array as a first pass screen to identify potential candidate proteins whose expression levels change in the rat hippocampus 24 h after TBI. After validating altered expression of representative candidates by western blot analysis, we subsequently targeted catechol-O-methyl transferase (COMT), an enzyme involved in the metabolism of the catecholamines dopamine and norepinephrine, for a more extensive characterization.
Numerous studies have indicated that catecholamine signaling (e.g. synthesis, release, reuptake/inactivation) can be disturbed after TBI, suggesting that altered catecholamine function may play a role in some of the behavioral deficits observed after TBI [15,17,18,30]. For example, TBI in rats results in increased expression of tyrosine hydroxylase (TH) protein, the rate-limiting enzyme in catecholamine synthesis, as well as norepinephrine and dopamine content [16,28]. In addition, Yan et al. demonstrated decreased expression of the dopamine transporter after TBI, which may affect reuptake and signaling termination [29]. In humans, some cognitive functions correlate with a genetic polymorphism that determines COMT enzyme activity, while COMT-deficient mice exhibit altered behavior and regional disturbances in dopamine level [1,7,10]. Since TBI alters pathways involved in catecholamine synthesis and extracellular clearance, a better understanding of changes in the pathways involved in catecholamine metabolism would aid in the understanding of TBI pathophysiology and in designing potential treatment paradigms.
METHODS
Materials
Harlan (Indianapolis, IN) provided male Sprague-Dawley rats (250–300g). Cy3/Cy5 monofunctional NHS-ester labeling kits were from Amersham Biosciences (Piscataway, NJ). Antibody arrays and mouse anti-COMT, -AF6, -CA150, -Ngn3, and -glutamine synthetase were obtained from BD Biosciences (San Jose, CA). Rabbit anti-GAD65/67, -GFAP, -GalC, -parvalbumin, and -NF-H were from Chemicon (Temecula, CA), and -Iba1 was from WAKO USA (Richmond, VA). Fluorescent secondaries were from Molecular Probes (Eugene, OR), and Vector Labs (Burlingame, CA) provided AP-conjugated secondaries.
Cortical Impact Injury
All protocols involving animals are in compliance with NIH's Guide for the Care and Use of Laboratory Animals and approved by the Institutional Animal Care and Use Committee. A controlled cortical impact device was used to administer unilateral brain injury at 1.9 mm deformation essentially as described in [25]. Sham rats received a midline incision but were not otherwise injured.
Protein labeling, antibody array processing, and data handling
Rats were decapitated 24 h after injury (n=5) or sham surgery (n=4) and the hippocampi removed under ice-cold artificial cerebrospinal fluid. Cytosolic extracts from individual hippocampi were prepared in 500 μl buffer containing 10 mM HEPES pH 7.5, 1 mM EDTA, 1 mM EGTA, 10 mM NaF, 2 mM sodium pyrophosphate, 25 mM β-glycerophosphate, 1 mM DTT, 1 mM diisopropyl fluorophosphate, 100 nM okadiac acid, and 1 mM sodium orthovanadate. Extracts were centrifuged 10 min, 4°C, 10,000 x g, and the supernatant recovered and quantified by Bradford assay. All subsequent steps were carried out as described by in the manufacturers’ protocols. Equal amounts of sham or injured protein extracts were pooled and labeled with Cy3- or Cy5-NHS ester dyes to generate four labeled samples: TBI-Cy3, TBI-Cy5, Sham-Cy3, and Sham-Cy5. The labeled samples were purified, and the dye/protein ratio measured. Arrays were incubated with 20 μg labeled sample mixes (forward: TBI-Cy5/Sham-Cy3; reverse: Sham-Cy5/TBI-Cy3), sequentially washed with buffers 1–7, centrifuged 25 min at 1000 x g, and imaged on an Axon Genepix 4200A slide scanner at 10 μm resolution.
Western blot
Sham and 24 h injured ipsilateral hippocampal cytosolic extracts were prepared as described in [17]. Total extracts were prepared from sham, 3 d and 14 d samples by solubilizing hippocampi in 10 volumes lysis buffer [6 M urea, 2 M thiourea, 2% CHAPS, and 65 mM DTT]. Equal amounts of protein were separated by SDS-PAGE, blotted, and probed with the following antibodies: mouse anti-COMT (1:10,000), anti-glutamine synthetase (1:10,000), anti-AF6 (1:500), anti-Ngn3 (1:500) and anti-CA150 (1:250). Blots were developed using CPD-Star, and the resulting images quantified using ImageJ.
Immunohistochemistry
Immunohistochemical detection of target proteins was carried out as previously described [25], except picric acid was omitted. Immunoreactivity was detected using anti-mouse IgG-Alexa-568 and anti-rabbit IgG-Alexa-488. Images were collected using a Bio-Rad MRC 1024 confocal microscope with an Olympus BX 50W camera.
Data analysis and statistics
Western blot data were compared using 2-tailed unpaired Student’s t-test, and considered significant at p < 0.05. The Ab array data was analyzed using two methods. First, we analyzed the fluorescent intensity signal using the manufacturer’s suggested protocol (internally normalized ratio, INR) by taking the square root of each protein’s averaged forward and reverse ratios [√(TBI-Cy5/Sham-Cy3)/(Sham-Cy5/TBI-Cy3)]. We then applied the Rank Product method [3] as outlined in Srivastava et al. [27]. Calculated RP values were converted to approximate expected values (E, analogous to BLAST expected values) as described in [3]. Briefly, we performed 100 simulated experiments with the same parameters as the Ab array, used a random number generator to obtain spot values, and determined the number of times a simulated RP value smaller than a given experimental value occurred. We used E <0.05 as the cutoff to determine which candidates had altered expression. To minimize potential false positives, we only considered proteins meeting both analyses threshold criterion as potential candidates.
RESULTS
Antibody array
To control for differences in protein quantification and labeling efficiency, reciprocally labeled aliquots of sham and TBI extract mixes were incubated on replicate arrays. Figure 1A shows a representative Ab array region incubated with the fluorescently-labeled extract mixes. Proteins exhibiting no change in expression between sham and TBI groups appear yellow, while proteins with altered expression appear red or green. The array had low overall background, and duplicate spots had similar signal intensities. After scanning, the average internally normalized ratio (INR) was calculated for each protein. As recommended by previous investigators, proteins with INRs >1.35 or <0.75 were considered to have different expression levels [2]. We then reanalyzed the data set using Rank Product (RP) analysis [3]. RP analysis has been suggested to provide a more robust and statistically accurate methodology for comparing proteomic data sets than the manufacturer recommended INR analysis [27]. Proteins exhibiting differential expression between sham and TBI groups by both INR and RP analysis were considered potential candidates, and are listed in Table 1.
Fig. 1.
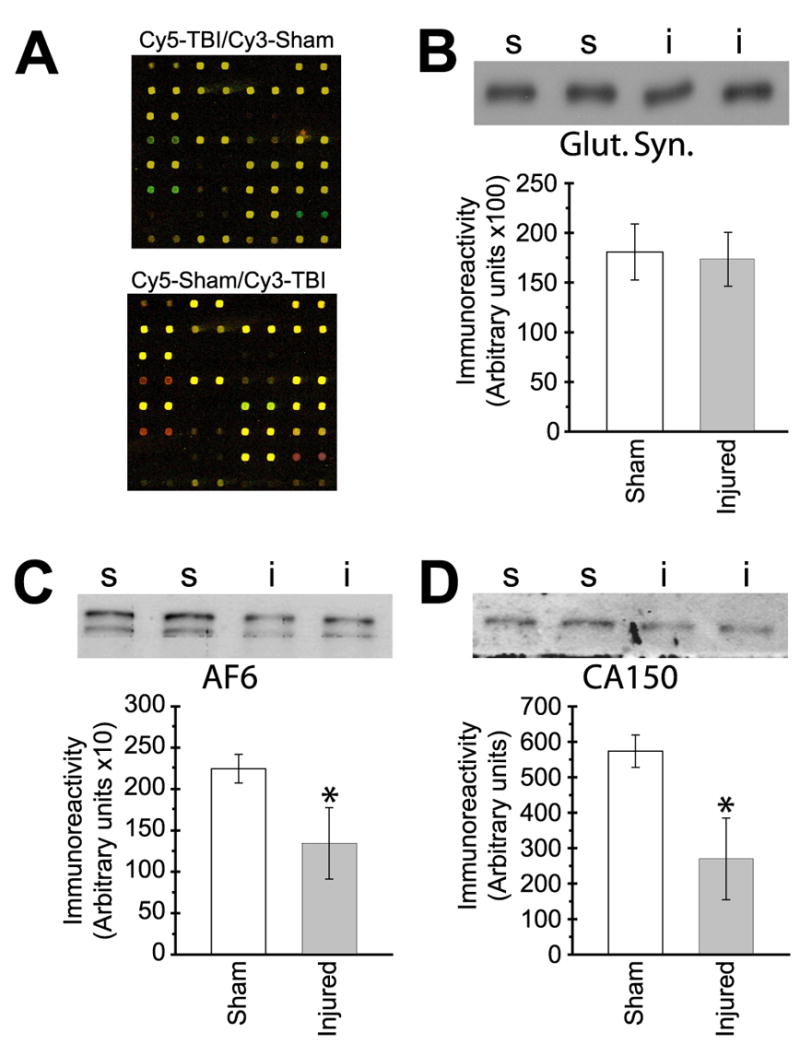
Hippocampal COMT protein expression is increased after TBI. (A) Representative antibody array region incubated with labeled forward (top) and reverse (bottom) 24 h cytosolic extract mixes. Unchanged proteins appear yellow, while red or green coloration indicates altered expression level. (B–D) Western blot verification of selected candidate proteins. Representative gel image of (B) glutamine synthetase, (C) AF6, and (D) CA150 immunoreactivity detected in cytosolic extracts are shown above, with the summary results depicted in the associated bar graphs shown below. s-sham (N=4); i-injured (N=5). Asterisks (*) indicate p<0.05.
| Protein | Swiss Prot | Putative function |
|---|---|---|
| Increased | ||
| Bcata,b | P54687 | Cell cycle regulation, apoptosis |
| CK Iε | P49674 | Ser/thr protein kinase |
| Cdk4c | P11802 | Cell cycle regulation |
| COMT | P21964 | Catecholamine o-methylation |
| CRP1d | P21291 | Actin bundling |
| CSK | P41240 | Tyrosine kinase |
| Dematind | Q08495 | Actin bundling |
| GRAP 2 | O75791 | Kinase signaling adaptor protein |
| GRB14 | Q14449 | Receptor-mediated signaling |
| HIF-1αa,c | Q16665 | Hypoxia-regulated transcription |
| hRAD9 | Q99638 | Cell cycle control checkpoint |
| HSF4 | Q9ULV5 | Heat shock gene transcription |
| IGFBP-3a,b,c | P17936 | Growth factor signaling |
| IL-5 | P05113 | Cytokine signaling |
| ILKd | Q13418 | Integrin-mediated signaling |
| MCP-1a,b,c | P13500 | Chemokine |
| p67 phoxa | P19878 | Superoxide anion production |
| PDE5A | O76074 | cGMP phosphodiesterase |
| Pleckstrind | P08567 | PKC substrate |
| PRK2d | Q16513 | Ser/thr protein kinase |
| RanBP3 | O75759 | Nuclear export |
| Ref-1a | P27695 | DNA repair |
| Rho-GDI 2d | P52566 | Actin dynamics |
| SMRTb | Q9Y618 | Chromatin structure |
| SRP54 | P13624 | Signal sequence recognition |
| Symplekind | Q92797 | Tight junction/RNA maturation |
| TEF-1 | P28347 | Transcriptional enhancer |
| TOP IIα | P11388 | DNA structure |
| Decreased | ||
| ABRd | Q12979 | GTPase activating protein |
| AF6/afadind | P55196 | Tight/adherens junction |
| CA150 | O14776 | Transcription/splicing regulator |
| CDC37 | Q16543 | Protein targeting |
| Contactin/F3d | Q12860 | Cell adhesion |
| DHFR | P00374 | Folate metabolism |
| E1A BP | Q09472 | Transcription co-activator |
| E2F-1 | Q01094 | Transcription factor |
| EBP50d | Q9JJ19 | Actin scaffolding protein |
| GSPT2 | Q9NY44 | Translation termination |
| Rab 4 | P20338 | Endocytosis/vesicle trafficking |
| SCP3 | P70281 | Chromosome alignment |
| SRPK1a | Q12890 | Localization of splicing factors |
Proteins identified in related injury models
Proteins involved in associated pathways
Proteins previously implicated in TBI
Novel candidates potentially involved in structural remodeling
Candidate verification
To independently validate some of the antibody array results, we randomly chose two candidate proteins (AF6, CA150) for western blot analyses. To test selection criteria robustness, glutamine synthetase and neurogenin-3 were also tested because, unlike CA150 and AF6, they met only one analysis methodology criteria and therefore were not considered potential candidates. Figure 1B-D shows representative western blots and summary results for the expression levels of AF6, CA150, and glutamine synthetase. Neurogenin-3 expression was not quantifiable, suggesting its array signal may have resulted from non-specific binding. Also consistent with exclusion as a candidate, glutamine synthetase expression level was not significantly different between sham and 24 h TBI groups (Fig. 1B). However, western blot analysis found significantly decreased expression of both AF6 (Fig. 1C) and CA150 (Fig. 1D) 24 h after injury, consistent with the Ab array data. These results suggest the proteins included in Table 1 are viable candidates with altered expression levels after TBI.
Time course and localization of COMT expression after injury
Since a number of studies have indicated that altered catecholamine signaling may contribute to TBI-associated cognitive dysfunction, COMT was selected for further examination [15–17,20,30]. As shown in figure 2A, analysis of 24 h cytosolic extracts showed a mean increase in soluble COMT expression after injury, similar to the results obtained from the Ab array.
Fig. 2.
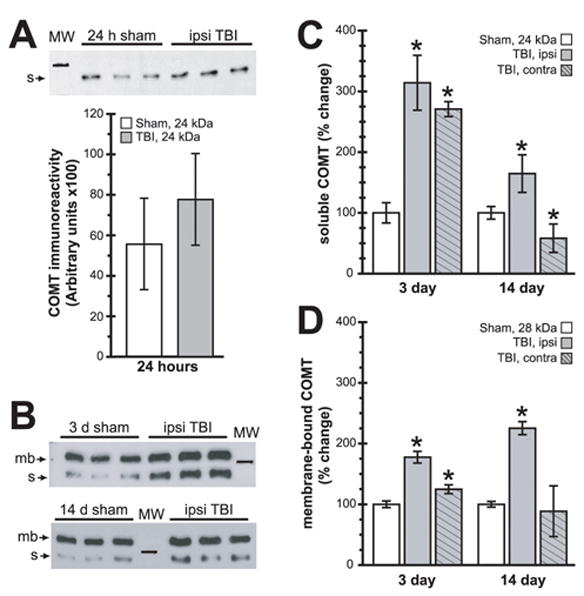
Ipsilateral hippocampal COMT expression levels are chronically altered after TBI. (A) Representative soluble COMT immunoreactivity western blot images detected in 24 h sham and TBI cytosolic extracts, with the summary results shown below. (B) Representative western blot images of total protein extracts from 3 d and 14 d samples detecting both soluble (s, 24 kDa) and membrane-bound (mb, 28 kDa) COMT isoforms. (C) Summary results of changes in ipsi- and contralateral hippocampal soluble COMT immunoreactivity. (D) Summary results of changes in ipsi- and contralateral hippocampal membrane-bound COMT immunoreactivity. Symbols are as follows: open bars-sham; ; shaded, no hatching-ipsilateral; shaded, hatched-contralateral. Marker in (A–B) is 25 kDa. Asterisks (*) indicate p<0.05.
COMT is expressed as soluble (S) and membrane-bound (MB) isoforms that are derived from a single gene, though expression is regulated by independent promoters [19]. Therefore, we generated additional total protein extracts to assess possible differential regulation of COMT isoforms. We selected 3 d and 14 d post-injury since these times have been previously demonstrated to exhibit TBI-associated behavioral effects. As shown by the representative blots and summary data (Fig. 2), analysis of 3 and 14 d hippocampal total protein extracts showed significant alterations in both S- and MB-COMT isoform expression. Summary results of S-COMT showed significantly elevated ipsilateral expression at both 3 d and 14 d post-TBI. Interestingly, contralateral S-COMT was differentially regulated, with increased expression at 3 d but decreased expression at 14 d (Fig. 2C). Ipsilateral MB- COMT was significantly elevated at both 3 and 14 days post-TBI, while contralateral expression was increased only at 3 d (Fig. 2D).
Immunohistochemical identification of COMT-expressing cells
COMT expression has been reported in a wide variety of CNS cell types, including neurons, astrocytes, microglia, vascular endothelium, and ependymal cells. Immunohistochemical staining of uninjured sham sections indicated broadly distributed low-level COMT immunoreactivity throughout the hippocampus (not shown). The most striking change in COMT localization following TBI was a large increase in intensely labeled COMT-positive cells throughout the ipsilateral injured hippocampus observed at both 3 and 14 days post-injury. In order to identify this cell population, we performed double immunohistochemical staining (Fig. 3A) using 14 d post-injury tissue sections. The intense COMT immunoreactivity did not co-localize with cells expressing NF-H (neuron), GFAP (astrocyte), GalC (oligodendrocyte, not shown), GAD65/67 or parvalbumin (inhibitory interneuron, not shown). However, we detected co-localization between COMT immunoreactivity and Iba1, which detects both quiescent and activated microglia.
Fig. 3.
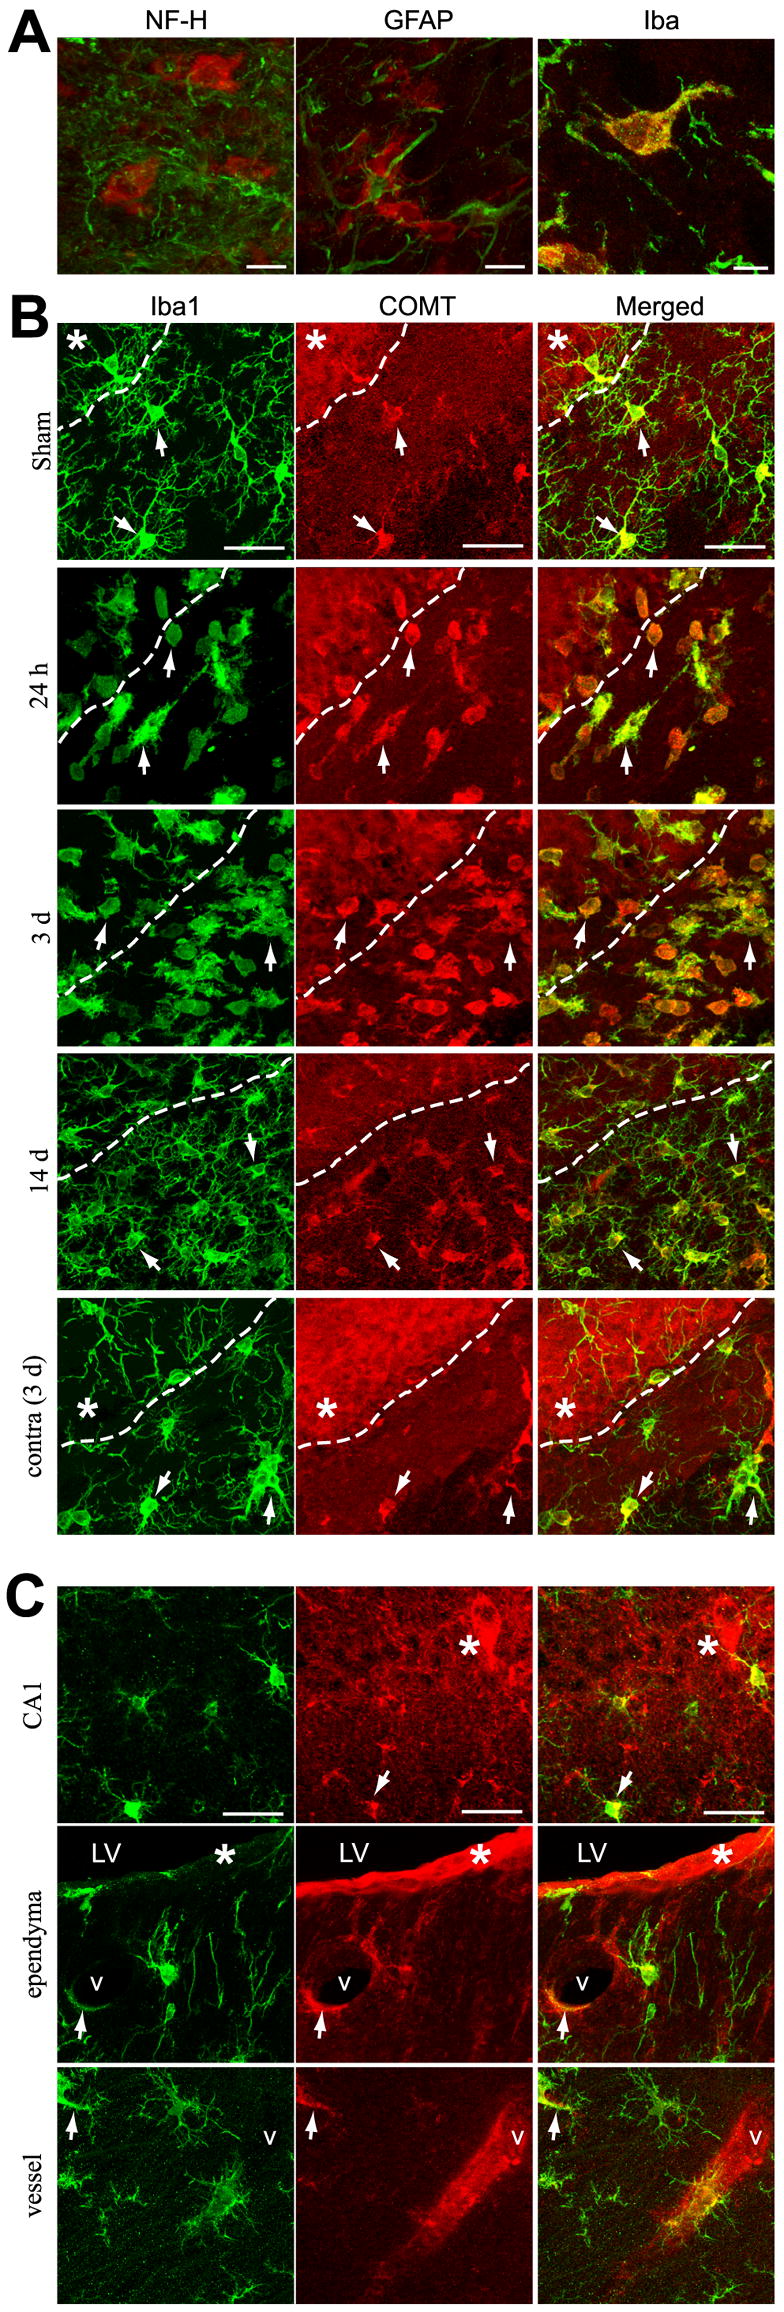
Increased COMT immunoreactivity in the injured hippocampus co-localizes with the microglia marker Iba1. (A) Representative high magnification confocal images demonstrating COMT immunoreactivity (red) in the ipsilateral hippocampi of 14 d TBI animals co-labeled (green) with (left) NF-H, (middle) GFAP, or (right) Iba1. (B) Representative confocal images showing Iba1 immunoreactivity (left, green), COMT immunoreactivity (middle, red) and merged images (right) at various times after injury. Dashed line delineates the margin between the dentate granule cell layer (upper, left) and the hilus (bottom, right). (C) Representative images of COMT-Iba1 co-localization in the CA1, but separate staining in the lateral ventricle (LV) and hippocampal blood vessel (v). Arrows indicate representative co-labeled cells, asterisks indicate no co-labeling. Areas with overlapping immunoreactivity appear yellow. The scale bars in (A) and (B–C) represent 10 and 30 μm, respectively.
To further investigate the changes in COMT expression, we co-labeled sections from various time points post-TBI with anti-COMT and -Iba1 antibodies. Control sections incubated without primary antibodies had no detectable signal (not shown). Sham sections showed evenly distributed ramified Iba1-positive microglia with low level COMT expression (Fig. 3B). Within 24 h after injury, there is an apparent increase in Iba1+/COMT+ activated (amoeboid) microglia throughout the ipsilateral hippocampus. By 3 d post-TBI, when western blots detected the largest increase in COMT expression, there is a substantial increase in ispilateral hippocampal Iba1+ amoeboid microglia also expressing intense COMT immunoreactivity. In contrast, there was no noticeable increase in either the number or activation state of contralateral hippocampal microglia, indicating the changes in COMT expression are largely confined to the ipsilateral hemisphere. Fourteen days after injury, the Iba1+ microglial population in the ipsilateral hippocampus remained significantly elevated, though the co-localized COMT staining intensity appeared reduced, consistent with the western blot data.
DISCUSSION
Protein discovery using 2-D gel and mass spectrometry proteomic approaches have aided in deciphering the complex biochemical changes following TBI. [6,11,12]. These approaches, although informative, require specialized expertise and equipment. Antibody arrays, however, provide a target-directed methodology that facilitates high-throughput screening of large numbers of known or suspected candidate proteins. The antibody array analysis presented in this study identified 41 candidates whose hippocampal expression levels were significantly altered 24 h after injury, indicating the complexity of the brain’s response to TBI.
Previous studies of individually selected proteins, as well as global gene chip analysis, have indicated the involvement of many different proteins in TBI pathophysiology (for review, see [5]). Although some candidates may also appear within DNA microarray data sets, literature searches revealed at least 9 of the candidates in Table 1 have been specifically implicated in injury models or injury-activated pathways. For instance, the increased hypoxia-inducible transcription factor (Hif-1α) protein after TBI is consistent with altered Hif-1α mRNA after TBI [24], and increased protein expression after ischemic and brain hemorrhage injury [13,22]. Gao et al. recently reported a significant decrease in H3 histone acetylation levels after TBI [9]. This is consistent with increased SMRT expression, a central component of a co-repressor complex that recruits histone deacetylase to the promoter regions of genes [23]. These data, in conjunction with our confirming altered AF6 and CA150 expression (Fig. 1), indicate a high-throughput characterization of protein expression approach using Ab arrays may successfully identify potential candidates involved in TBI pathophysiology.
In the present study, the selection of COMT for a more detailed analysis was guided by a number of previous studies that have implicated catecholamine signaling in the behavioral sequelae of TBI [4,20,21]. Following their release, catecholamines are either taken up by specific transporters and/or are metabolized by monoamine oxidase or COMT. Transporter-mediated termination of catecholamine signaling plays a prominent role in structures such as the striatum, whereas in structures such as the prefrontal cortex that express low transporter levels, inactivation through metabolism may play a more prominent role [14,26]. An increased role for COMT after injury is consistent with the reported decrease in dopamine transporter (DAT) as early as 7 d post-injury, and increases in the levels of TH protein and TH fibers in the frontal cortex [16,28,29]. Western blot data (Fig. 2) indicated significant changes in COMT isoform expression occurred in both hemispheres at both 3 and 14 d post-TBI. These data may reflect changes in COMT expression in a wide variety of cell types, including vascular endothelial, microglial and neuronal cell types. Our double immunohistochemical-labeling experiments (Fig. 3) indicate that at all time points post-injury, microglia in the ipsilateral injured area exhibit enhanced COMT expression. In addition, increased COMT immunoreactivity in the dentate gyrus, hilus, and fiber tracts was also observed. Interestingly, recent research has shown that microglia express dopamine receptor mRNA, and their migration can be stimulated by the application of dopamine, the D1 receptor agonist dihydrexidine, or the D2 receptor agonist quinpirole [8]. It is possible that increased dopamine release after injury [20] might serve as a chemotactic signal to trigger the recruitment of microglia to distressed regions.
Since scavenging is one of the primary microglia roles in the CNS, enhanced microglia COMT expression may aid in removing and metabolizing catecholamines from damaged areas. Alternatively, the increased COMT immunoreactivity detected in the activated microglia (Fig. 3) might arise from phagocytic activity as they clean the debris from the dead and dying cells in the injured hippocampus. However, elevated COMT immunoreactivity is still associated with microglia at 14 days post-injury. This would indicate that intrinsically up-regulated COMT expression in microglia is a more likely explaination, since phagocytosed COMT would not be expected to remain stable over long periods. Additional experiments are needed to determine the exact mechanism (transcription, translation, or protein stability) through which microglia regulates COMT expression, and its consequences following TBI.
In conclusion, the present study demonstrates the potential of Ab arrays to explore the complex pathophysiology of CNS injury. In addition to corroborating previous studies, the antibody array identified many novel candidate proteins. For instance, 10 of the 41 candidates possess functions related to actin dynamics, remodeling, or cell adhesion. Since blood-brain barrier integrity is compromised following TBI, defining the changes that occur in tight junction proteins (e.g. AF6, symplekin) or signaling proteins that regulate actin dynamics (e.g. PRK2, ILK, ABR, Rho-GDI 2) may be critical to understanding the mechanisms underlying blood-brain barrier dysfunction. Some of these candidates may also be involved structural remodeling after TBI. The identification of altered COMT expression, in addition to other novel candidates, may be useful for developing therapies to improve TBI outcome.
Acknowledgments
We would like to thank Melanie Moody and Min Zhang for surgical assistance, Anthony Moore for critical comments, and Dr. Ray Grill for confocal assistance. Research supported by National Institutes of Health grants NS35457, NS049160.
Abbreviations
- Ab
antibody
- COMT
catechol O-methyl transferase
- Hif-1α
hypoxia-inducible factor 1alpha
- Iba1
ionized calcium-binding adaptor molecule 1
- SMRT
silencing mediator of retinoic acid and thyroid hormone receptor
- TBI
traumatic brain injury
- TH
tyrosine hydroxylase
Footnotes
Publisher's Disclaimer: This is a PDF file of an unedited manuscript that has been accepted for publication. As a service to our customers we are providing this early version of the manuscript. The manuscript will undergo copyediting, typesetting, and review of the resulting proof before it is published in its final citable form. Please note that during the production process errors may be discovered which could affect the content, and all legal disclaimers that apply to the journal pertain.
References
- 1.Akil M, Kolachana BS, Rothmond DA, Hyde TM, Weinberger DR, Kleinman JE. Catechol-O-methyltransferase genotype and dopamine regulation in the human brain. J Neurosci. 2003;23:2008–2013. doi: 10.1523/JNEUROSCI.23-06-02008.2003. [DOI] [PMC free article] [PubMed] [Google Scholar]
- 2.Anderson K, Potter A, Baban D, Davies KE. Protein expression changes in spinal muscular atrophy revealed with a novel antibody array technology. Brain. 2003;126:2052–2064. doi: 10.1093/brain/awg208. [DOI] [PubMed] [Google Scholar]
- 3.Breitling R, Armengaud P, Amtmann A, Herzyk P. Rank products: a simple, yet powerful, new method to detect differentially regulated genes in replicated microarray experiments. FEBS Lett. 2004;573:83–92. doi: 10.1016/j.febslet.2004.07.055. [DOI] [PubMed] [Google Scholar]
- 4.Clifton GL, Ziegler MG, Grossman RG. Circulating catecholamines and sympathetic activity after head injury. Neurosurgery. 1981;8:10–14. doi: 10.1227/00006123-198101000-00003. [DOI] [PubMed] [Google Scholar]
- 5.Dash PK, Kobori N, Moore AN. A molecular description of brain trauma pathophysiology using microarray technology: an overview. Neurochem Res. 2004;29:1275–1286. doi: 10.1023/b:nere.0000023614.30084.eb. [DOI] [PubMed] [Google Scholar]
- 6.Denslow N, Michel ME, Temple MD, Hsu CY, Saatman K, Hayes RL. Application of proteomics technology to the field of neurotrauma. J Neurotrauma. 2003;20:401–407. doi: 10.1089/089771503765355487. [DOI] [PubMed] [Google Scholar]
- 7.Egan MF, Goldberg TE, Kolachana BS, Callicott JH, Mazzanti CM, Straub RE, Goldman D, Weinberger DR. Effect of COMT Val108/158 Met genotype on frontal lobe function and risk for schizophrenia. Proc Natl Acad Sci U S A. 2001;98:6917–6922. doi: 10.1073/pnas.111134598. [DOI] [PMC free article] [PubMed] [Google Scholar]
- 8.Farber K, Pannasch U, Kettenmann H. Dopamine and noradrenaline control distinct functions in rodent microglial cells. Mol Cell Neurosci. 2005;29:128–38. doi: 10.1016/j.mcn.2005.01.003. [DOI] [PubMed] [Google Scholar]
- 9.Gao WM, Chadha MS, Kline AE, Clark RS, Kochanek PM, Dixon CE, Jenkins LW. Immunohistochemical analysis of histone H3 acetylation and methylation-Evidence for altered epigenetic signaling following traumatic brain injury in immature rats. Brain Res. 2006;1070:31–34. doi: 10.1016/j.brainres.2005.11.038. [DOI] [PMC free article] [PubMed] [Google Scholar]
- 10.Gogos JA, Morgan M, Luine V, Santha M, Ogawa S, Pfaff D, Karayiorgou M. Catechol-O-methyltransferase-deficient mice exhibit sexually dimorphic changes in catecholamine levels and behavior. Proc Natl Acad Sci U S A. 1998;95:9991–9996. doi: 10.1073/pnas.95.17.9991. [DOI] [PMC free article] [PubMed] [Google Scholar]
- 11.Haskins WE, Kobeissy FH, Wolper RA, Ottens AK, Kitlen JW, McClung SH, O'Steen BE, Chow MM, Pineda JA, Denslow ND, Hayes RL, Wang KK. Rapid discovery of putative protein biomarkers of traumatic brain injury by SDS-PAGE-capillary liquid chromatography-tandem mass spectrometry. J Neurotrauma. 2005;22:629–644. doi: 10.1089/neu.2005.22.629. [DOI] [PubMed] [Google Scholar]
- 12.Jenkins LW, Peters GW, Dixon CE, Zhang X, Clark RS, Skinner JC, Marion DW, Adelson PD, Kochanek PM. Conventional and functional proteomics using large format two-dimensional gel electrophoresis 24 hours after controlled cortical impact in postnatal day 17 rats. J Neurotrauma. 2002;19:715–740. doi: 10.1089/08977150260139101. [DOI] [PubMed] [Google Scholar]
- 13.Jiang Y, Wu J, Keep RF, Hua Y, Hoff JT, Xi G. Hypoxia-inducible factor-1alpha accumulation in the brain after experimental intracerebral hemorrhage. J Cereb Blood Flow Metab. 2002;22:689–696. doi: 10.1097/00004647-200206000-00007. [DOI] [PubMed] [Google Scholar]
- 14.Karoum F, Chrapusta SJ, Egan MF. 3-Methoxytyramine is the major metabolite of released dopamine in the rat frontal cortex: reassessment of the effects of antipsychotics on the dynamics of dopamine release and metabolism in the frontal cortex, nucleus accumbens, and striatum by a simple two pool model. J Neurochem. 1994;63:972–979. doi: 10.1046/j.1471-4159.1994.63030972.x. [DOI] [PubMed] [Google Scholar]
- 15.Kline AE, Massucci JL, Marion DW, Dixon CE. Attenuation of working memory and spatial acquisition deficits after a delayed and chronic bromocriptine treatment regimen in rats subjected to traumatic brain injury by controlled cortical impact. J Neurotrauma. 2002;19:415–425. doi: 10.1089/08977150252932370. [DOI] [PubMed] [Google Scholar]
- 16.Kobori N, Clifton GL, Dash PK. Enhanced catecholamine synthesis in the prefrontal cortex after traumatic brain injury: implications for prefrontal dysfunction. J Neurotrauma. 2006;23:1094–1102. doi: 10.1089/neu.2006.23.1094. [DOI] [PubMed] [Google Scholar]
- 17.Kobori N, Dash PK. Reversal of brain injury-induced prefrontal glutamic acid decarboxylase expression and working memory deficits by D1 receptor antagonism. J Neurosci. 2006;26:4236–4246. doi: 10.1523/JNEUROSCI.4687-05.2006. [DOI] [PMC free article] [PubMed] [Google Scholar]
- 18.Lipsky RH, Sparling MB, Ryan LM, Xu K, Salazar AM, Goldman D, Warden DL. Association of COMT Val158Met genotype with executive functioning following traumatic brain injury. J Neuropsychiatry Clin Neurosci. 2005;17:465–471. doi: 10.1176/jnp.17.4.465. [DOI] [PubMed] [Google Scholar]
- 19.Lundstrom K, Tenhunen J, Tilgmann C, Karhunen T, Panula P, Ulmanen I. Cloning, expression and structure of catechol-O-methyltransferase. Biochim Biophys Acta. 1995;1251:1–10. doi: 10.1016/0167-4838(95)00071-2. [DOI] [PubMed] [Google Scholar]
- 20.Massucci JL, Kline AE, Ma X, Zafonte RD, Dixon CE. Time dependent alterations in dopamine tissue levels and metabolism after experimental traumatic brain injury in rats. Neurosci Lett. 2004;372:127–131. doi: 10.1016/j.neulet.2004.09.026. [DOI] [PubMed] [Google Scholar]
- 21.McIntosh TK, Yu T, Gennarelli TA. Alterations in regional brain catecholamine concentrations after experimental brain injury in the rat. J Neurochem. 1994;63:1426–1433. doi: 10.1046/j.1471-4159.1994.63041426.x. [DOI] [PubMed] [Google Scholar]
- 22.Mu D, Jiang X, Sheldon RA, Fox CK, Hamrick SE, Vexler ZS, Ferriero DM. Regulation of hypoxia-inducible factor 1alpha and induction of vascular endothelial growth factor in a rat neonatal stroke model. Neurobiol Dis. 2003;14:524–534. doi: 10.1016/j.nbd.2003.08.020. [DOI] [PubMed] [Google Scholar]
- 23.Privalsky ML. The role of corepressors in transcriptional regulation by nuclear hormone receptors. Annu Rev Physiol. 2004;66:315–360. doi: 10.1146/annurev.physiol.66.032802.155556. [DOI] [PubMed] [Google Scholar]
- 24.Rall JM, Matzilevich DA, Dash PK. Comparative analysis of mRNA levels in the frontal cortex and the hippocampus in the basal state and in response to experimental brain injury. Neuropathol Appl Neurobiol. 2003;29:118–131. doi: 10.1046/j.1365-2990.2003.00439.x. [DOI] [PubMed] [Google Scholar]
- 25.Redell JB, Moore AN, Dash PK. Expression of the prodynorphin gene after experimental brain injury and its role in behavioral dysfunction. Exp Biol Med (Maywood ) 2003;228:261–269. doi: 10.1177/153537020322800304. [DOI] [PubMed] [Google Scholar]
- 26.Sesack SR, Hawrylak VA, Matus C, Guido MA, Levey AI. Dopamine axon varicosities in the prelimbic division of the rat prefrontal cortex exhibit sparse immunoreactivity for the dopamine transporter. J Neurosci. 1998;18:2697–2708. doi: 10.1523/JNEUROSCI.18-07-02697.1998. [DOI] [PMC free article] [PubMed] [Google Scholar]
- 27.Srivastava M, Eidelman O, Jozwik C, Paweletz C, Huang W, Zeitlin PL, Pollard HB. Serum proteomic signature for cystic fibrosis using an antibody microarray platform. Mol Genet Metab. 2006;87:303–310. doi: 10.1016/j.ymgme.2005.10.021. [DOI] [PubMed] [Google Scholar]
- 28.Yan HQ, Kline AE, Ma X, Hooghe-Peters EL, Marion DW, Dixon CE. Tyrosine hydroxylase, but not dopamine beta-hydroxylase, is increased in rat frontal cortex after traumatic brain injury. Neuroreport. 2001;12:2323–2327. doi: 10.1097/00001756-200108080-00009. [DOI] [PubMed] [Google Scholar]
- 29.Yan HQ, Kline AE, Ma X, Li Y, Dixon CE. Traumatic brain injury reduces dopamine transporter protein expression in the rat frontal cortex. Neuroreport. 2002;13:1899–1901. doi: 10.1097/00001756-200210280-00013. [DOI] [PubMed] [Google Scholar]
- 30.Zhu J, Hamm RJ, Reeves TM, Povlishock JT, Phillips LL. Postinjury administration of L-deprenyl improves cognitive function and enhances neuroplasticity after traumatic brain injury. Exp Neurol. 2000;166:136–152. doi: 10.1006/exnr.2000.7484. [DOI] [PubMed] [Google Scholar]