

Abstract
PURPOSE
Choroidal melanoma is the most common primary ocular cancer among the adult population. Patient survival has been linked to the periodic acid-Schiff base (PAS)–positive vascular patterns in the tumors. The presence of PAS-positive loops or cross-linking parallel channels is a marker of an aggressive tumor. The purpose of this study was to develop new xenograft models of human choroidal melanoma that predictably demonstrate the PAS staining patterns associated with nonaggressive and aggressive tumors in humans.
METHODS
Three human choroidal melanoma cell lines (C918, M619, and OCM-1) were used. C918 and M619 are considered aggressive, based on their ability to form PAS-positive channels in vitro. The nonaggressive OCM-1 cells do not form these channels. C918, M619, and OCM-1 spheroids were grown and implanted in the suprachoroidal space of 20, 17, and 16 WAG/RijHs-rnu nude rats, respectively. Tumors were grown for 1 to >4 weeks, and histology was performed to evaluate tumor growth and determine PAS labeling patterns.
RESULTS
Growth of C918, M619, and OCM-1 xenografts were histologically verified in 20/20, 15/17, and 16/16 rats, respectively. PAS staining revealed loops and cross-linking parallel channels, typical of aggressive tumors in patients, in 90% of C918 and 100% of M619 xenografts. Only 4 of 16 OCM-1 xenografts showed PAS-positive loops. The rest showed no PAS staining or only perivascular staining, indicative of nonaggressive tumors.
CONCLUSIONS
It is possible to grow human choroidal melanoma orthotopic xenografts in nude rats that reproduce the PAS staining patterns associated with aggressive and nonaggressive choroidal melanomas in patients.
The annual incidence of intraocular melanoma in the Western world is approximately six cases per million,1 making it the most common intraocular malignancy, accounting for 70% of all primary eye cancers.2 One of the most striking characteristics of human choroidal melanomas is the presence of vascular channels that stain positively with periodic acid-Schiff (PAS) base. The pattern of these PAS-positive channels has been shown to correlate strongly with patient prognosis.3–8 The presence of closed vascular loops, series of loops (networks), and cross-linking parallel channels is linked to poor survival. It was initially proposed that these PAS-positive patterns identified blood vessels formed by tumor-initiated angiogenesis.3,4 Later Maniotis et al.9 and Folberg et al.10 reported that these PAS-positive patterns were not typical blood vessels derived by angiogenesis from preexisting vessels, but were actually extracellular matrix-lined channels produced by the tumor cells themselves via a process called vasculogenic mimicry.
Recently Mueller et al.11–14 and Schaller et al.15 have been able to visualize and identify these vascular patterns in patients with choroidal melanoma, by using simultaneous confocal fluorescein angiography, indocyanine green angiography, or a combination of the two. This may make it feasible in the future to direct individual patient treatment based on the tumor vascular pattern. To develop better therapies designed for these specific tumor types, it is important to generate animal models that mimic the PAS staining patterns found in patients. Such models may also provide a better understanding of differences between aggressive and nonaggressive choroidal melanomas.
Others have implanted human choroidal melanomas into the suprachoroidal space of experimental animals,16 but none of these models duplicated the PAS staining patterns of aggressive and nonaggressive tumors. Recently, Mueller et al.17 injected human choroidal melanoma OCM-1 cells into the sub-retinal space of the eyes of SCID mice. The resultant tumors showed “the matrix-associated microcirculatory patterns of aggressive primary human uveal melanomas,” but there was no mention of tumors that showed the patterns associated with nonaggressive tumors.
The purpose of the present study was to develop new orthotopic human choroidal melanoma xenograft models that reproduce the PAS staining patterns associated with aggressive and nonaggressive choroidal melanomas in patients. We hypothesized that implanting three dimensional (3-D) aggregates of known aggressive and nonaggressive human choroidal melanoma cell lines into the choroids of athymic rats would result in the growth of tumors that demonstrate the PAS staining patterns associated with aggressive and nonaggressive tumors in patients. We injected tumor spheroids formed from two aggressive (C918 and M619) and one nonaggressive (OCM-1) human choroidal melanoma cell lines into the suprachoroidal space of nude, athymic rats. Eyes were harvested after 1 to >4 weeks of growth. The presence of a tumor was verified histologically, and PAS staining patterns were identified. Histologic cell type, maximum tumor area, and mitotic index were also determined.
MATERIALS
Animals
The mutant rat strain WAG/RijHs-rnu was used in this study for several reasons. First, these rats are athymic, which permitted the xenotrans-plantation of human tumor tissue into the choroid. Second, they are albino, which allowed normal choroidal vessels and tumor vessels to be viewed with epifluorescence.18,19 The WAG/RijHs-rnu rats were bred and housed in the Department of Laboratory Animal Resources (DLAR) facility at Wayne State University. All procedures were in accordance with the ARVO Statement for the Use of Animals in Ophthalmic and Vision Research and were approved by the Wayne State University Animal Investigation Committee.
Human Choroidal Melanoma Cell Lines
Three different human choroidal melanoma cell lines were used in this study: OCM-1, C918, and M619. OCM-1 was generously supplied by June Kan-Mitchell at Wayne State University. The latter two cell lines were kindly supplied by Mary Hendrix and Karla Daniels (University of Iowa). All three cell lines were maintained in RPMI medium, with 10% fetal bovine serum (FBS) and antibiotic.
The OCM-1 cells were originally cultured from a human choroidal melanoma specimen in 1985. In vitro tests have shown that the OCM-1 cells have poor invasive potential and do not form vascular channels in three dimensional cultures (i.e., they do not exhibit vasculogenic mimicry).9 For these reasons, OCM-1 has been characterized as a noninvasive and poorly aggressive (nonaggressive) human choroidal melanoma cell line.9,20
The C918 and M619 cells were derived from patient tumors at the University of Iowa in the 1990s.21,22 Both cell lines have demonstrated a high invasive potential and the ability to form vascular channels via vasculogenic mimicry in 3-D culture.9 Therefore, C918 and M619 cells have been designated highly invasive, metastatic, and aggressive.9,20
Growth of Tumor Spheroids
Tumor spheroids are 3-D aggregations of tumor cells that have been used as a model of tumor parenchyma for decades.23,24 Spheroids have also been implanted subcutaneously in brain or in fat pads, to initiate solid tumor growth in laboratory animals.25–27 In this study, spheroids were grown by using a modified version of the method described by Yuhas et al.28 Agar (1%) was prepared in RPMI medium by sterilization for 30 minutes. While still hot, 20 mL of 1% agar was poured into the bottom of sterile 100 × 20-mm plastic Petri dishes. To initiate spheroid growth, 5 × 10⁶ cells in 20 mL of RPMI, FBS, and antibiotic were placed in each agar-coated Petri dish. The dishes were then placed in the incubator. Spheroids were implanted into the choroid when they were 200 to 500 μm in diameter.
Orthotopic Xenograft Model: Injection of Choroidal Melanoma Spheroids into Choroid
Tumor implantation was performed under sterile conditions in a BSL2 safety hood in the Wayne State DLAR facility. Rats were anesthetized with a ketamine–xylazine mixture (70/8 mg/kg IP), and proparacaine HCl (0.5%) was applied topically to the right eye as a local anesthesia. The rat was placed under an operating microscope, and a suture was tied through the upper eyelid to expose the globe. An incision was made in the conjunctiva to expose a portion of the sclera. Approximately five tumor spheroids were pulled into a 5-μL glass syringe (model #65RN; Hamilton Co., Reno, NV) equipped with a three-fourths-inch long, beveled, 32-gauge needle (catalog #0160832, point style 4; Hamilton Co.). It was necessary to take up only a volume of spheroids and media of 1 μL or less. The tip of the needle was inserted into the sclera, and the 1-μL volume was injected into the suprachoroidal space. Antibiotic ointment was applied, and the rat was allowed to recover on the heating blanket before being returned to its cage. C918, M619, and OCM-1 spheroids were implanted in the right eyes of 20, 17, and 16 rats, respectively.
After 4 to 41 days, the rats were euthanatized with an overdose of pentobarbital sodium, and the eyes were enucleated and fixed overnight in 10% neutral buffered formalin. The cornea and lens were then removed, and the eye cups were fixed for another 6 hours in formalin and another hour in a postfixative (PenFix; Richard-Allan Scientific, Kalamazoo, MI). They were refrigerated in 70% ethanol until they could be further processed. Eye cups were dehydrated through a series of increasing alcohols, cleared (Clear-Rite 3; Richard-Allan Scientific, Kalamazoo, MI), and embedded in paraffin. In most rats, pieces of liver were processed in an identical fashion.
Hematoxylin and Eosin Staining and Tumor Growth Evaluation
Serial sections were cut from each paraffin block, and three to five 10-μm sections were placed on an individual lysine-coated slide. Every other slide was stained with hematoxylin and eosin (H&E), with a standard protocol. Slides were viewed on a microscope (Axiophot; Carl Zeiss Meditec, Inc. Thornwood, NY), and tumor-containing sections were photographed with a digital camera and software (Axiocam; Carl Zeiss Meditec, Inc.). Coded tumor sections were examined for histologic cell type (spindle cell, epithelioid, or mixed cell), extent of scleral involvement, and extent of retinal penetration in a blinded fashion by one of the authors (RDB). Tumor size was assessed by measuring tumor area on the digitized images of the H&E sections using image-analysis software (ScionImage; Scion Corp., Frederick, MD). The area was measured from multiple sections for each tumor, and the maximum area was used to characterize the size of each tumor.
Mitotic indices were determined on H&E-stained sections of all 21 tumors that had maximum areas of 1.5 mm3 or greater. Smaller tumors were not analyzed, because areas of the tumor that filled the microscopic field could not be routinely located. Slides were coded by an individual not associated with the study and were evaluated in a blinded fashion by one of the authors (RDB). Tumor sections were viewed under a high-power (40×) objective that yielded an overall magnification of 400×. The resultant microscopic field had a diameter of 467 μm and an area of 0.171 mm2. Forty different high-power fields were viewed, and the total number of mitotic figures were counted. The mitotic index was expressed as the number of mitoses per square millimeter.
PAS Base Staining
Once the tumor was identified in H&E sections, at least one of the neighboring slides was stained with PAS. PAS staining of the choroidal melanoma xenografts was performed, using the procedure developed by Folberg et al.,3 which involves staining tumor sections with periodic acid-Schiff reagent without hematoxylin staining. Slides were viewed on the microscope (Axiophot; Carl Zeiss Meditec, Inc.) through a green filter to enhance contrast. The criteria set forth by Folberg et al. were used to determine the presence of the nine PAS-positive patterns, including microvascular loops, networks, and cross-linking parallel channels.3–5 Slides were coded by an individual not associated with the study and were evaluated in a blinded fashion in triplicate by one of the authors (RDB). The assessment that was noted in at least two of the three evaluations was taken as the final PAS staining pattern.
RESULTS
Growth of Human Choroidal Melanoma Xenografts
Tumor spheroids were successfully grown from C918, M619, and OCM-1 human choroidal melanoma cells (Fig. 1). OCM-1 spheroids typically grew as collections of loosely packed, large cells, whereas the spheroids formed by the aggressive cell lines (C918 and M619) were composed of tightly packed, small cells.
FIGURE 1.
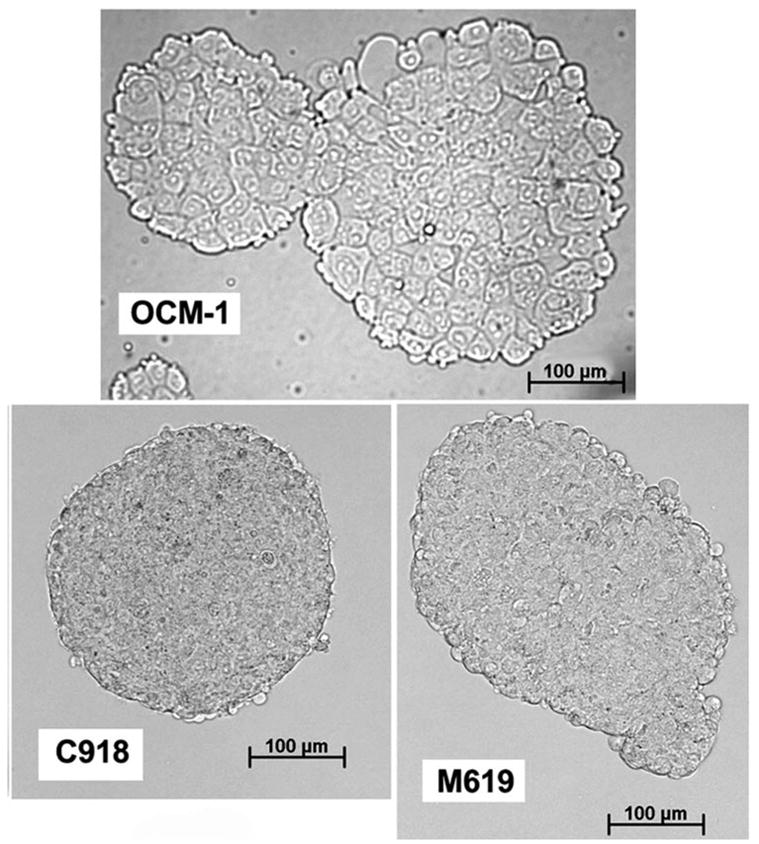
Spheroids grown from each of the three cell lines (6–8 days of growth). All images were taken at the same magnification.
The implantation of tumor spheroids into the suprachoroidal space resulted in the successful growth of orthotopic xenografts with all three cell lines (Fig. 2). Tumor growth could be histologically verified in all 20 eyes implanted with C918 spheroids, 15 of 17 eyes implanted with M619 spheroids, and all 16 eyes implanted with OCM-1 spheroids. The only eyes in which tumors were not found were examined 8 and 14 days after implantation.
FIGURE 2.
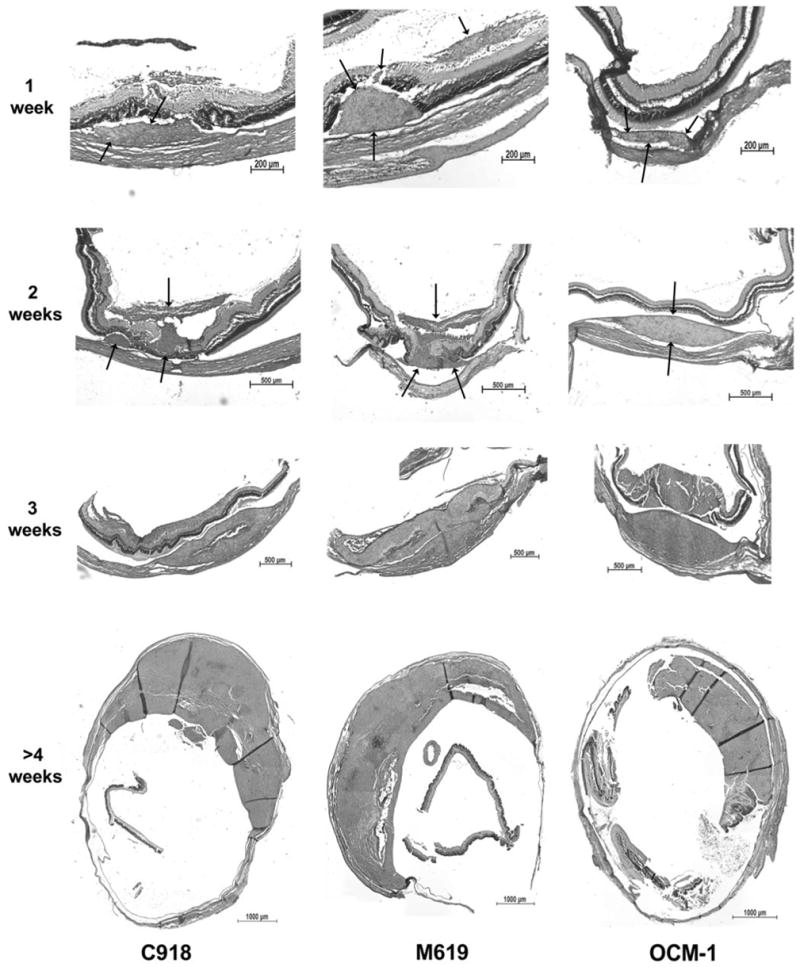
H&E sections of choroidal melanoma xenografts grown from 1 to >4 weeks. Arrows: location of the tumor at 1 and 2 weeks. Not until 3 weeks is there significant scleral involvement. In some cases, the tumors penetrated the retina and grew into the vitreous.
All three tumor types were primarily comprised of tightly packed epithelioid cells (Fig. 3, center), although spindle cells could be found in some of the tumors. Such xenografts were designated as mixed-cell tumors. The areas of spindle cells were sometimes located in swirling patterns or often along the edge of tumors that had penetrated into the vitreous humor. Eleven of the 20 C918 tumors were classified as epithelioid, whereas the other nine were mixed cell (Table 1). The M619 tumors were dominated by epithelioid tumors (11/15), whereas only five of the 16 OCM-1 xenografts were classified as pure epithelioid. Thus, a higher proportion of the OCM-1 xenografts tended to be mixed-cell tumors compared with the C918 and M619 groups, but a χ2 test revealed that this difference did not reach statistical significance (P = 0.062).
FIGURE 3.
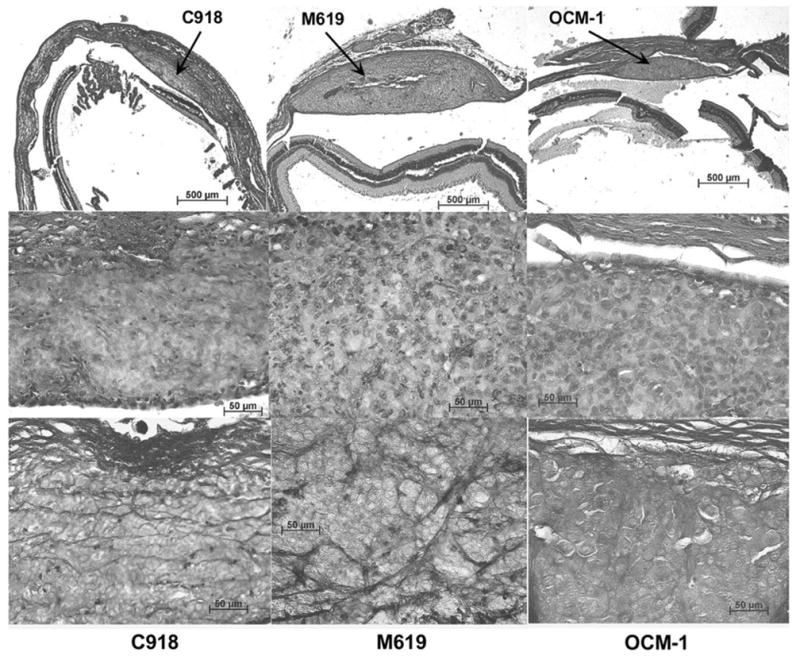
H&E sections of choroidal melanoma xenografts grown for 2 weeks at low (top) and high (middle) magnifications. Bottom row: PAS staining of the same tumors. The C918 tumor (left) is characterized by cross-linking parallel channels. The M619 tumor (center) shows PAS-positive loops and arcs. The OCM-1 tumor (right) presents no PAS staining (silent pattern).
TABLE 1.
Histologic Cell Type and Mitotic Indices of Xenografts as a Function of Tumor Cell Line Implanted and PAS Staining Pattern
| Tumor Cell Line
|
PAS Staining Pattern
† |
||||
|---|---|---|---|---|---|
| Histologic Cell Type | C918 | M619 | OCM-1 | Loops or Cross-Linking Parallel Channels | Normal |
| Epithelioid | 11 | 11 | 5 | 24 | 3 |
| Mixed cell | 9 | 4 | 11 | 13 | 11 |
| Total tumors | 20 | 15 | 16 | 37 | 14 |
| Mitotic Index (mitoses/mm2) | 2.22 ± 1.09* | 4.21 ± 2.51 | 4.95 ± 1.44 | 3.38 ± 2.02 | 4.95 ± 1.70 |
| n | 7 | 6 | 8 | 15 | 6 |
The mitotic index is expressed as the mean ± SD, and n is the number of tumors for which the mitotic index was determined (maximum area, >1.5 mm2).
Mitotic index was significantly different from OCM-1 value (Mann-Whitney rank sum test, P = 0.002).
The Fisher exact test showed a significant difference between epithelioid and mixed cell tumors with respect to PAS-staining pattern (P = 0.011).
Little necrosis was noted in the tumors until they reached a large size after 3 to 4 weeks. By 3 weeks, 3 of 11 tumors had necrotic regions. After more than 4 weeks of growth, 8 of the 10 tumors showed evidence of some necrosis, but necrotic regions never dominated the tumor (Fig. 2, >4 weeks).
The overall growth rates are summarized in Figure 4, which shows the maximum area for each tumor as a function of days of growth. The growth rates were compared by ANCOVA of the regression slopes of the semilogarithmic plots of the data (ln area versus time).29 There was no significant difference in the slopes (F = 0.2138, P = 0.808), indicating no difference in the growth rates among the three tumors. In addition, the maximum areas for tumors after 2 weeks of growth were compared. The mean ± SD maximum tumor areas of the C918, M619, and OCM-1 xenografts after 2 weeks were 0.611 ± 0.392 (n = 7), 0.950 ± 0.805 (n = 8), and 0.629 ± 0.593 (n = 8) mm2, respectively. Kruskal-Wallis one-way ANOVA showed that there was no difference among the groups (P = 0.685).
FIGURE 4.

Growth curves for all three human choroidal melanoma cell lines. Maximum tumor area (mm2) was determined from measurements of multiple H&E-stained sections. Curves are monoexponential fits of the data with t = days of tumor growth. C918: area = 0.073e0.148t, n = 20, r2 = 0.689; M619: area = 0.101e0.128t, n = 14, r2 = 0.656; OCM-1: area = 0.047e0.150t, n = 17, r2 = 0.667; mean of all tumors: area = 0.080e0.148t, n = 12, r2 = 0.923.
The mitotic index of the large tumors (maximum area, >1.5 mm2) grown from each cell line (Table 1) was determined. Kruskal-Wallis one-way ANOVA showed that there was a significant difference among the groups (P = 0.027). Mann-Whitney rank sum tests revealed that there was no difference between the mitotic indices for the M619 and OCM-1 tumors (P = 0.852) or the indices for the M619 and C918 tumors (P = 0.181). The mitotic index of the C918 tumors, however, was significantly lower than that of the OCM-1 tumors (P = 0.002).
All tumors grew within the suprachoroidal space, although they gradually extended beyond this region. In this model, there was little scleral involvement up to 2 weeks after tumor implantation. Twenty-one (72%) of 29 tumors remained within the confines of the sclera up to this time point. After 3 weeks of tumor growth, 9 of 11 tumors had either infiltrated or penetrated the sclera. If the tumors were allowed to grow for more than 4 weeks, 8 of 11 tumors showed scleral penetration, and a portion of the sclera was obliterated (Fig. 2, >4 weeks).
Sections were also examined for regions where the tumor had penetrated the retina and grew along the vitreous surface. Examples of such tumors are shown in Figure 2. After 1 and 2 weeks of growth, 38% and 57% of the tumors had penetrated into the vitreous humor, respectively. By 3 weeks or more, 20 of 22 xenografts had reached the vitreous humor, and the retina was often obliterated near the tumor.
We found no evidence of metastases in any of the liver samples we sectioned. We did extensive sectioning of the liver pieces from animals that had grown tumors for more than 4 weeks and found no histologic evidence of metastatic lesions.
PAS-Positive Vascular Patterns in Choroidal Melanoma Xenografts
Most of the tumors were characterized by the presence of one of the four following PAS patterns: loops, cross-linking parallel channels, silent (no PAS staining), or normal (tumor cells growing around normal choroidal vessels). In a few cases, straight or parallel PAS-stained vessels, indicative of nonaggressive tumors, were also noted. Because these tumors also showed normal choroidal vessels, they were included in the “normal” group. Networks and arcs were also found in some of the tumors showing loops or cross-linking, parallel channels. Based on these findings, the tumors were grouped into one of three PAS staining patterns: silent or normal, loops/networks, or cross-linking parallel channels.
Representative sections from tumors grown for either 2 weeks or for more than 4 weeks are shown in Figures 3 and 5, respectively. C918 xenografts typically showed heavy, randomly oriented staining with many cross-linking parallel channels (Figs. 3, 5) and some loops (Fig. 5), which are markers of tumor aggressiveness in patients.4,5 M619 xenografts primarily demonstrated PAS-positive loops (Figs. 3, 5). The OCM-1 tumors usually showed no PAS staining (silent pattern, Fig. 3) or some perivascular staining around normal choroidal vessels (normal pattern, Fig. 5, bottom).
FIGURE 5.
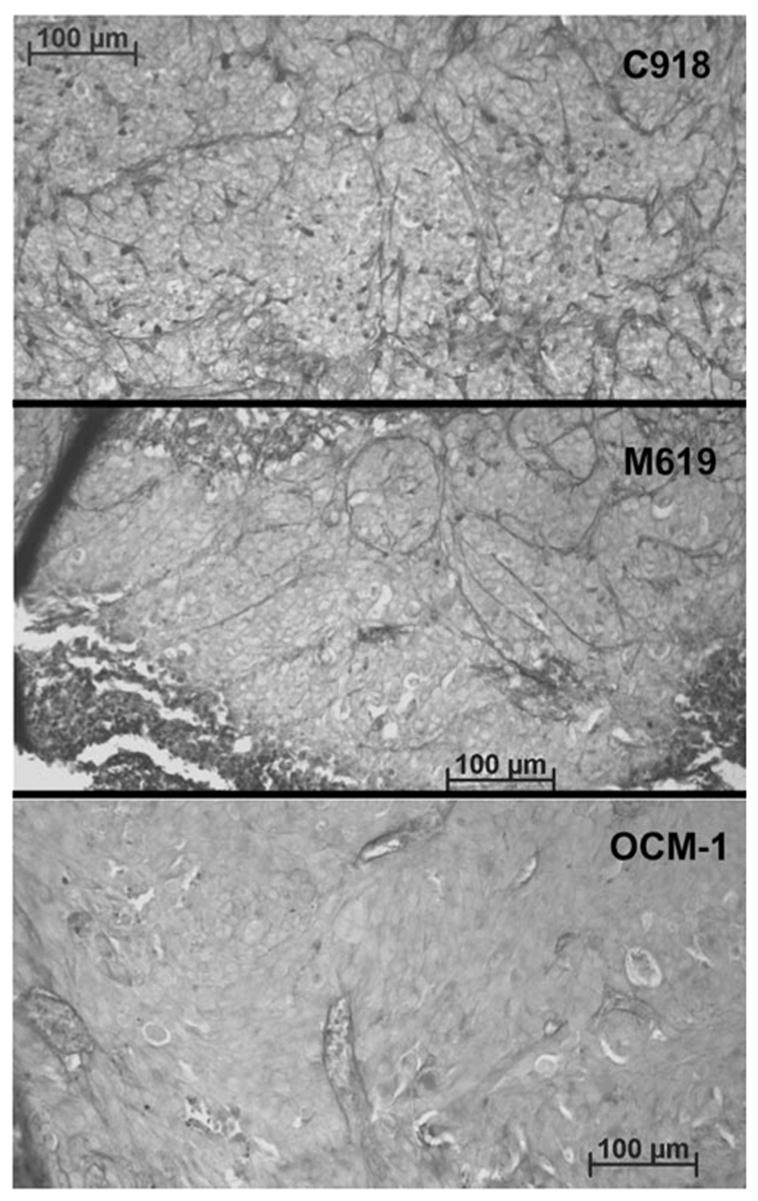
Examples of PAS staining in tumors after >4 weeks of growth. PAS staining appears as dark lines in these gray-scale images. The C918 tumor (top) was characterized by small loops and some cross-linking parallel channels. The M619 tumor (center) showed large PAS-positive loops. The OCM-1 tumor (bottom) presented only perivascular staining.
The data for all the tumors are summarized in Figure 6. The C918 tumors were typically characterized by the presence of cross-linking parallel channels, and only 2 of 20 tumors lacked the staining patterns associated with aggressive tumors. All the M619 tumors showed one of the two patterns associated with aggressiveness, and most presented loops or networks. In contrast, the OCM-1 tumors were dominated by the absence of PAS-staining or perivascular staining of normal choroidal vessels. Twelve (75%) of the 16 tumors showed these patterns of staining, whereas the other four presented PAS-positive loops.
FIGURE 6.
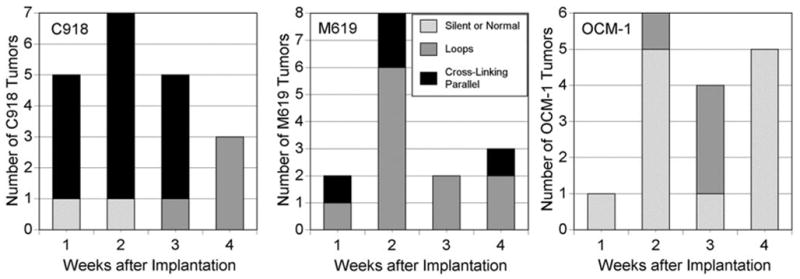
Summary of PAS staining patterns in three different orthotopic choroidal melanoma xenografts: C918, M619, and OCM-1.
There was a relationship between the PAS-staining pattern and the histologic cell type of the tumor (mixed cell or pure epithelioid; Table 1). Twenty-four of the tumors containing PAS-positive loops or cross-linking parallel channels were strictly epithelioid, whereas 13 were designated as mixed-cell type. The tumors showing silent or normal PAS patterns were mostly of the mixed-cell type (11 mixed cell and 3 epithelioid). A Fisher exact test determined that these groups were significantly different (P = 0.011), indicating that pure epithelioid tumors had a higher probability of displaying PAS-positive loops and/or cross-linking parallel channels than did mixed-cell tumors.
Mitotic index was examined as a function of PAS staining pattern as well (Table 1). The mitotic index of all tumors presenting PAS-positive loops/networks or cross-linking parallel channels was 3.38 ± 2.02 mitoses/mm2 (mean ± SD, n = 15). Those tumors with silent or normal PAS patterns had a mitotic index of 4.95 ± 1.70 mitoses/mm2 (n = 6). The Mann-Whitney rank sum test showed no difference between these groups (P = 0.094).
DISCUSSION
Tumor Model
Since 1980, numerous attempts have been made to develop orthotopic models of human choroidal melanoma by implanting human choroidal melanoma tissue into the suprachoroidal space of an animal.16 In most of these earlier studies, either the immunosuppressed rabbit30–34 or the immunocompromised mouse16,17,35–37 was used as the animal model. Each of these animal models has strengths and weaknesses. The chief advantage of the rabbit model is the ability to use a larger eye that simplifies tumor implantation, permits longer tumor growth and observation time, and allows improved in vivo visualization of the tumor. Its major disadvantage is that the rabbit’s immune system must be suppressed with cyclosporine to avoid rejection of the tumor tissue. Unfortunately, there can be significant toxicity and animal death associated with the drug.31,32 The chief benefit of using immunocompromised mice lies in the ability to grow human tumors without the need for immunosuppression. Another advantage of using the mouse is the wide availability of antibodies for immunohistochemical studies. The most obvious limitation of the model is the small size of the eye, which makes tumor implantation more difficult and limits the techniques that can be used to visualize the tumor. In this study, we chose to use the nude rat for several reasons. First, like the immunocompromised mouse, it can accept human tumor tissue without the need for immunosuppression. Second, the slightly larger size of the eye makes implantation of the tumor less complicated and permits in vivo observation of the tumor (e.g., quantification of blood flow on an intravital microscope).18 There are several disadvantages of the nude rat model compared with the nude mouse model. There are fewer antibodies available against the rat, and a nude rat is much more expensive than a nude mouse.
Two important variables in the development of any animal model of choroidal melanoma are the nature of the transplanted tumor tissue and the implantation technique. The most direct source of tumor tissue has been the use of fresh pieces of human choroidal melanoma from patient specimens. They have been implanted in the posterior segment of nude mice, and tumors were successfully grown.35,36 In most studies, a suspension of human choroidal melanoma cells grown in tissue culture has served as the donor tissue that was injected into the suprachoroidal space transsclerally.16,17,30–33,37 We attempted direct injection of a cell suspension into the nude rat suprachoroidal space in an early version of this current model, but leakage from the wound resulted in significant extraocular growth. Another approach has been to grow pieces of human choroidal melanomas in a donor animal and implant them in the suprachoroidal space of an immunosuppressed rabbit32,34 or nude rat.18 In two of those studies, the donor tumor was grown subcutaneously,18,32 whereas in the other it was grown in the anterior chamber.34 In all three studies, orthotopic tumors could be grown, but the success rate was not as high as desired. It is possible that the small pieces of tumor chosen for implantation into the choroid did not contain a sufficient volume of viable cells. In addition to the low success rate, there was also concern with the use of subcutaneously grown tumors as the donor tissue in two cases. Intermediate growth of the tumor cells in the skin might have significantly altered their properties.
Because of these issues with other methods of implantation, we chose to use a modification of a technique previously used to grow tumors at other sites.25–27 Tumor spheroids were grown in vitro and served as the donor tissue that was implanted into the suprachoroidal space. The major advantage of this technique is that a large number of tumor cells can be injected in a relatively small volume (1 μL). In addition, there is very little or no leakage of tumor cells from the injection site, as can occur when a tumor cell suspension is injected. These are the same advantages achieved by implanting pieces of donor tumor, but it is not necessary to subject the tumor cells to an intermediate growth period in a donor animal.
Growth of Human Choroidal Melanoma Xenografts
Spheroids could be grown as donor tissue from all three cell lines (Fig. 1). Recently, spheroids from these same three cell lines were grown on agar placed on a rotary shaker.38 The aggressive lines (C918 and M619) formed 1- to 10-mm diameter, dense aggregates in 2 to 3 days, whereas the nonaggressive OCM-1 cells formed only small, loose associations.38 The nature of the spheroids was similar in both studies, but the spheroids grew much more quickly in the shaken system. This faster growth rate was most likely a result of better nutrient availability and perhaps increased spheroid aggregation.
The technique of implanting spheroids in the suprachoroidal space to grow orthotopic choroidal melanoma xenografts was very successful. Tumors could be histologically verified in 51 of 53 eyes implanted with spheroids. The tumors grew fairly rapidly, reaching a maximum area of 2.78 ± 2.22 mm2 (mean ± SD, n = 11) by 3 weeks (Fig. 4). There was no difference in the growth rates of the tumors, despite a difference in mitotic indices. Specifically, the OCM-1 xenografts had a significantly higher mitotic index than the tumors grown from the C918 line. This may seem somewhat surprising, because OCM-1 is classified as a “nonaggressive” cell line.9,20 It should be noted, however, that in vitro aggressiveness refers to the ability of the cell line to form vasculogenic channels in vitro and to invade extracellular matrices, not necessarily to its growth rate. Because tumor growth is a balance between cell proliferation and cell death, the similarity in growth rates suggests that the OCM-1 cells may have a higher apoptotic rate as well as a higher mitotic index compared to the C918 tumors. It is also possible that the duration of mitosis is longer in the OCM-1 cells compared to the C918 cells, even though the overall cell cycling time is the same. If this were true, then the chances of observing a dividing cell would be greater in the OCM-1 tumor, even though the growth rates were the same.
All the tumors contained some epithelioid cells and more than half of them were purely epithelioid (Table 1). There was no statistically significant relationship between the implanted cell line and the histologic cell type of the resultant tumor, although the OCM-1 xenografts tended to have more of the mixed-cell phenotype (Table 1). These results generally agree with previous studies. Although the OCM-1 cells appear spindle-shaped in tissue culture, they do not result in spindle-cell tumors. When OCM-1 cells were orthotopically implanted into immunosuppressed rabbits, they generated tumors that were predominantly epithelioid in nature.30 Orthotopic OCM-1 xenografts grown in SCID mice were described as mixed-cell tumors.17
Necrotic areas were present in some of the larger tumors, but most of the xenografts showed no necrosis. This agrees with the pattern found in human choroidal melanoma, in which two-thirds of all medium-sized tumors show no necrosis.39
The technique of injecting spheroids into the suprachoroidal space was effective at limiting extraocular growth of the tumors. The fact that scleral involvement was a function of tumor growth time strongly suggests that most injections resulted in deposition of the spheroids into the suprachoroidal space rather than outside the eye. Up to 2 weeks of growth, 72% of the tumors remained within the confines of the sclera, indicating that subsequent scleral involvement was a result of tumor growth rather than extension of the tumor along the site of injection. Whereas the technique limited most of the tumors to the eye, there was some significant retinal involvement in tumors that had grown for 1 week (38%). Although some of this may have been attributable to fast tumor growth, a portion may have been caused by injection of some spheroids into the retina or vitreous. We believe this factor could be minimized through more experience with the injection technique.
PAS-Positive Vascular Patterns in Choroidal Melanoma Xenografts
As hypothesized, the aggressive cell lines (C918 and M619) primarily produced xenografts that demonstrated PAS-positive patterns associated with aggressive tumors in patients (Fig. 6).4,5 Twelve of 16 OCM-1 xenografts were characterized by the absence of PAS-staining or perivascular staining around large blood vessels (Fig. 6). These patterns have been associated with increased survival in patients.4,5 When OCM-1 tumors were grown in the choroids of SCID mice, PAS-positive loops and networks, indicative of an aggressive phenotype, were always found in the xenografts.17 The reason for the difference in PAS staining of OCM-1 xenografts in the two studies may be related to the different animal models used, the difference in the method of implanting OCM-1 cells (cells versus spheroids), or phenotypical differences in the OCM-1 cells used.
It is unclear why the OCM-1 xenografts demonstrated the aggressive phenotype in four of 16 tumors. The cause of this variability in PAS staining pattern in the same animal model using spheroids from the same cell line may have multiple causes and requires future investigation. One possible explanation is that we selected spheroids that were composed of cells that had mutated into a more aggressive phenotype in culture. Unfortunately, spheroids were not routinely saved from each transplant, because correlating spheroid characteristics with xenograft staining patterns for individual rats was not an original goal of this study. An alternative explanation is that the spheroids were similar when implanted, but altered microenvironmental conditions within the suprachoroidal space caused a mutation or selected for a more aggressive phenotype some time during in vivo growth. Delineation of the factors involved in determining the ultimate phenotype of the OCM-1 xenografts requires a prospective study, in which the characteristics of specific sets of OCM-1 spheroids can be correlated with the PAS staining patterns in the tumors grown from them.
There were also two C918 tumors that failed to show the PAS staining patterns associated with the aggressive phenotype. It is possible that we selected spheroids that had grown from cells with a less aggressive phenotype and that the spheroids maintained this phenotype during growth. Another explanation is that the tumors may have shown the aggressive PAS patterns had they been allowed to grow longer. The C918 tumor that showed a silent PAS pattern after 7 days of growth was one of the smallest of all 20 C918 tumors grown (maximum area of 0.090 mm2). The other PAS-negative C918 tumor had grown for 14 days, but it was also small (maximum area of 0.594 mm2).
In this study, histologic cell type was linked to the PAS staining pattern. Mixed-cell tumors were associated with the silent or normal PAS staining pattern, while purely epithelioid tumors were more likely to present PAS-positive loops or parallel cross-linking channels (Table 1). This is somewhat different from the relationship found in choroidal melanomas in patients, where the presence of any epithelioid cells has been linked to the expression of PAS-positive loops and cross-linking parallel channels.4 Thus, human tumors with the mixed-cell phenotype have been associated with aggressive PAS staining patterns. Despite this difference, both results point to the importance of epithelioid cells in the expression of PAS-positive loops and cross-linking parallel channels.
There was no difference between the mitotic indices of tumors presenting with PAS-positive loops and/or parallel cross-linking channels and those with silent or normal patterns (Table 1). This was mainly the result of the high mitotic indices of the OCM-1 tumors that expressed PAS-positive loops, which indicates that the tumor cell line was the major determinant of mitotic index, not the PAS staining pattern.
Possible Prognostic Factors in Choroidal Melanoma Xenografts
This study was not specifically designed to correlate the PAS-positive patterns in the xenografts with the extent of metastasis or rat survival. Its purpose was to develop new xenograft models of human choroidal melanoma that predictably demonstrate the PAS staining patterns associated with nonaggressive and aggressive tumors in human patients. Nevertheless, we histologically examined the livers of rats that had borne tumors for more than 30 days. We could find no evidence of metastases in the livers excised at the time of enucleation. Mueller et al.17 were also unable to verify the presence of metastases in lungs or livers of SCID mice that had borne intrachoroidal OCM-1 xenografts for 21 days. Because only portions of the livers were fixed and sectioned, it is possible that we simply missed the micrometastases that might have been present. Alternatively, it may be that we did not wait long enough for the metastatic lesions to become established. In a nude mouse model of metastatic human choroidal melanoma, livers have typically been examined 49 to 74 days after intraocular implantation of the cells.37,40,41 Therefore, metastatic lesions could perhaps be found in this model if the tumors were allowed to grow longer or the rats were followed after enucleation of the tumor-bearing eye.37 Studies to correlate the PAS staining pattern with the extent of metastatic disease in this model are currently under way.
In some studies, mitotic index has been identified as a contributing prognostic indicator in choroidal melanoma by multivariate analysis.4,42,43 The criterion for prognostic significance was usually the presence of at least one mitosis per 40 HPFs (≥0.025 mitosis/HPF)4 or at least 0.1 mitosis/HPF.42–44 In the present study, all three tumors had very high mitotic rates. The C918 xenografts had the lowest mean mitotic index of 2.22 mitoses/mm2 or 0.38 mitosis/HPF, far above the cutoff for poor prognosis in humans. None of the 21 tumors examined had a mitotic index below 0.1 mitosis/HPF. The high mitotic rates were not unexpected, since growing cells in tissue culture tends to be selective of more mitotically active cells. Because all three tumors were very mitotically active and grew rapidly (Fig. 4), we would not expect mitotic index to be the key determinant of rat survival in these xenograft models.
The other possible prognostic indicator evaluated in the study was histologic cell type. In general, the presence of epithelioid cells is associated with a poorer prognosis.45 In our current model, epithelioid cells were present in all the xenografts, although areas of spindle cells were found in some of the tumors. Therefore, the presence of epithelioid cells would not be a discriminating parameter in predicting survival in this model. However, there has been a report that the extent of epithelioid cell involvement, expressed as the number of epithelioid cells per HPF, is a strong predictor of survival in patients.44 Because lower epithelioid cell counts were associated with better prognosis in patients, there is a possibility that the presence of the mixed-cell phenotype in the xenografts will be correlated with better rat survival.
SUMMARY
In this study, we have shown that it is possible to grow human choroidal melanoma orthotopic xenografts in nude rats that reproduce the expected PAS staining patterns seen in aggressive and nonaggressive choroidal melanomas in patients. Whether the correlation between the PAS staining patterns and metastatic disease or survival holds true in this rat model remains to be determined. In the meantime, these models can be used to study the nature of the PAS-positive patterns in vivo. In addition, differences in gene or protein expression could be correlated with PAS staining patterns. The availability of these experimental tumors should result in a better understanding of the nature of the different PAS-positive vascular patterns.
Acknowledgments
The authors thank June Kan-Mitchell for generously providing the OCM-1 cells and Mary Hendrix and Karla Daniels for kindly supplying the C918 and M619 cells.
Footnotes
Disclosure: R.D. Braun, None; A. Abbas, None
Supported by National Eye Institute Grant EY11634 (RDB) and National Eye Institute Departmental Core Grant P30EY04068.
References
- 1.Egan KM, Seddon JM, Glynn RJ, Gragoudas ES, Albert DM. Epidemiologic aspects of uveal melanoma. Surv Ophthalmol. 1988;32:239–251. doi: 10.1016/0039-6257(88)90173-7. [DOI] [PubMed] [Google Scholar]
- 2.Sahel JA, Albert DM. Intraocular melanomas. Cancer Treat Res. 1993;65:161–199. doi: 10.1007/978-1-4615-3080-0_7. [DOI] [PubMed] [Google Scholar]
- 3.Folberg R, Pe’er J, Gruman LM, et al. The morphologic characteristics of tumor blood vessels as a marker of tumor progression in primary human uveal melanoma: a matched case-control study. Hum Pathol. 1992;23:1298–1305. doi: 10.1016/0046-8177(92)90299-i. [DOI] [PubMed] [Google Scholar]
- 4.Folberg R, Rummelt V, Parys-Van Ginderdeuren R, et al. The prognostic value of tumor blood vessel morphology in primary uveal melanoma. Ophthalmology. 1993;100:1389–1398. doi: 10.1016/s0161-6420(93)31470-3. [DOI] [PubMed] [Google Scholar]
- 5.Folberg R, Chen X, Boldt HC, et al. Microcirculation patterns other than loops and networks in choroidal and ciliary body melanomas. Ophthalmology. 2001;108:996–1001. doi: 10.1016/s0161-6420(01)00541-3. [DOI] [PubMed] [Google Scholar]
- 6.McLean IW, Keefe KS, Burnier MN. Uveal melanoma: comparison of the prognostic value of fibrovascular loops, mean of the ten largest nucleoli, cell type, and tumor size. Ophthalmology. 1997;104:777–780. doi: 10.1016/s0161-6420(97)30234-6. [DOI] [PubMed] [Google Scholar]
- 7.Makitie T, Summanen P, Tarkkanen A, Kivela T. Microvascular loops and networks as prognostic indicators in choroidal and ciliary body melanomas. J Natl Cancer Inst. 1999;91:359–367. doi: 10.1093/jnci/91.4.359. [DOI] [PubMed] [Google Scholar]
- 8.Sakamoto T, Sakamoto M, Yoshikawa H, et al. Histologic findings and prognosis of uveal malignant melanoma in Japanese patients. Am J Ophthalmol. 1996;121:276–283. doi: 10.1016/s0002-9394(14)70275-2. [DOI] [PubMed] [Google Scholar]
- 9.Maniotis AJ, Folberg R, Hess A, et al. Vascular channel formation by human melanoma cells in vivo and in vitro: vasculogenic mimicry. Am J Pathol. 1999;155:739–752. doi: 10.1016/S0002-9440(10)65173-5. [DOI] [PMC free article] [PubMed] [Google Scholar]
- 10.Folberg R, Hendrix MJ, Maniotis AJ. Vasculogenic mimicry and tumor angiogenesis. Am J Pathol. 2000;156:361–381. doi: 10.1016/S0002-9440(10)64739-6. [DOI] [PMC free article] [PubMed] [Google Scholar]
- 11.Mueller AJ, Bartsch DU, Folberg R, et al. Imaging the microvasculature of choroidal melanomas with confocal indocyanine green scanning laser ophthalmoscopy. Arch Ophthalmol. 1998;116:31–39. doi: 10.1001/archopht.116.1.31. [DOI] [PubMed] [Google Scholar]
- 12.Mueller AJ, Freeman WR, Folberg R, et al. Evaluation of microvascularization pattern visibility in human choroidal melanomas: comparison of confocal fluorescein with indocyanine green angiography. Graefes Arch Clin Exp Ophthalmol. 1999;237:448–456. doi: 10.1007/s004170050260. [DOI] [PubMed] [Google Scholar]
- 13.Mueller AJ, Bartsch DU, Schaller U, Freeman WR, Kampik A. Imaging the microcirculation of untreated and treated human choroidal melanomas. Int Ophthalmol. 2001;23:385–393. doi: 10.1023/a:1014471118208. [DOI] [PubMed] [Google Scholar]
- 14.Mueller AJ, Freeman WR, Schaller UC, Kampik A, Folberg R. Complex microcirculation patterns detected by confocal indocyanine green angiography predict time to growth of small choroidal melanocytic tumors: MuSIC Report II. Ophthalmology. 2002;109:2207–2214. doi: 10.1016/s0161-6420(02)01266-6. [DOI] [PubMed] [Google Scholar]
- 15.Schaller UC, Mueller AJ, Bartsch DU, Freeman WR, Kampik A. Choroidal melanoma microcirculation with confocal indocyanine green angiography before and 1 year after radiation brachytherapy. Retina. 2000;20:627–632. doi: 10.1097/00006982-200011000-00007. [DOI] [PubMed] [Google Scholar]
- 16.Grossniklaus HE, Dithmar S, Albert DM. Animal models of uveal melanoma. Melanoma Res. 2000;10:195–211. [PubMed] [Google Scholar]
- 17.Mueller AJ, Maniotis AJ, Freeman WR, et al. An orthotopic model for human uveal melanoma in SCID mice. Microvasc Res. 2002;64:207–213. doi: 10.1006/mvre.2002.2398. [DOI] [PubMed] [Google Scholar]
- 18.Braun RD, Abbas A, Bukhari SO, Wilson W., III Hemodynamic parameters in blood vessels in choroidal melanoma xenografts and rat choroid. Invest Ophthalmol Vis Sci. 2002;43:3045–3052. [PMC free article] [PubMed] [Google Scholar]
- 19.Braun RD, Dewhirst MW, Hatchell DL. Quantification of erythrocyte flow in the choroid of the albino rat. Am J Physiol. 1997;272:H1444–H1453. doi: 10.1152/ajpheart.1997.272.3.H1444. [DOI] [PubMed] [Google Scholar]
- 20.Hendrix MJ, Seftor EA, Meltzer PS, et al. Expression and functional significance of VE-cadherin in aggressive human melanoma cells: role in vasculogenic mimicry. Proc Natl Acad Sci USA. 2001;98:8018–8023. doi: 10.1073/pnas.131209798. [DOI] [PMC free article] [PubMed] [Google Scholar]
- 21.Hendrix MJ, Seftor EA, Seftor RE, et al. Biologic determinants of uveal melanoma metastatic phenotype: role of intermediate filaments as predictive markers. Lab Invest. 1998;78:153–163. [PubMed] [Google Scholar]
- 22.Daniels KJ, Boldt HC, Martin JA, Gardner LM, Meyer M, Folberg R. Expression of type VI collagen in uveal melanoma: its role in pattern formation and tumor progression. Lab Invest. 1996;75:55–66. [PubMed] [Google Scholar]
- 23.Mueller-Klieser WF, Sutherland RM. Influence of convection in the growth medium on oxygen tensions in multicellular tumor spheroids. Cancer Res. 1982;42:237–242. [PubMed] [Google Scholar]
- 24.Sutherland RM, Sordat B, Bamat J, Gabbert H, Bourrat B, Mueller-Klieser W. Oxygenation and differentiation in multicellular spheroids of human colon carcinoma. Cancer Res. 1986;46:5320–5329. [PubMed] [Google Scholar]
- 25.Gilead A, Neeman M. Dynamic remodeling of the vascular bed precedes tumor growth: MLS ovarian carcinoma spheroids implanted in nude mice. Neoplasia. 1999;1:226–230. doi: 10.1038/sj.neo.7900032. [DOI] [PMC free article] [PubMed] [Google Scholar]
- 26.Goldbrunner RH, Bernstein JJ, Plate KH, Vince GH, Roosen K, Tonn JC. Vascularization of human glioma spheroids implanted into rat cortex is conferred by two distinct mechanisms. J Neurosci Res. 1999;55:486–495. doi: 10.1002/(SICI)1097-4547(19990215)55:4<486::AID-JNR8>3.0.CO;2-A. [DOI] [PubMed] [Google Scholar]
- 27.Torres Filho IP, Hartley-Asp B, Borgstrom P. Quantitative angiogenesis in a syngeneic tumor spheroid model. Microvasc Res. 1995;49:212–226. doi: 10.1006/mvre.1995.1017. [DOI] [PubMed] [Google Scholar]
- 28.Yuhas JM, Li AP, Martinez AO, Ladman AJ. A simplified method for production and growth of multicellular tumor spheroids. Cancer Res. 1977;37:3639–3643. [PubMed] [Google Scholar]
- 29.Dowdy SM, Wearden S. Statistics for Research. New York: John Wiley & Sons; 1983. p. 537. [Google Scholar]
- 30.Liggett PE, Lo G, Pince KJ, Rao NA, Pascal SG, Kan-Mitchell J. Heterotransplantation of human uveal melanoma. Graefes Arch Clin Exp Ophthalmol. 1993;231:15–20. doi: 10.1007/BF01681695. [DOI] [PubMed] [Google Scholar]
- 31.Hu LK, Huh K, Gragoudas ES, Young LH. Establishment of pigmented choroidal melanomas in a rabbit model. Retina. 1994;14:264–269. doi: 10.1097/00006982-199414030-00014. [DOI] [PubMed] [Google Scholar]
- 32.Mueller AJ, Folberg R, Freeman WR, et al. Evaluation of the human choroidal melanoma rabbit model for studying microcirculation patterns with confocal ICG and histology. Exp Eye Res. 1999;68:671–678. doi: 10.1006/exer.1998.0650. [DOI] [PubMed] [Google Scholar]
- 33.Blanco G, Saornil AM, Domingo E, et al. Uveal melanoma model with metastasis in rabbits: effects of different doses of cyclosporine A. Curr Eye Res. 2000;21:740–747. [PubMed] [Google Scholar]
- 34.Bonicel P, Michelot J, Bacin F, et al. Establishment of IPC 227 cells as human xenografts in rabbits: a model of uveal melanoma. Melanoma Res. 2000;10:445–450. doi: 10.1097/00008390-200010000-00006. [DOI] [PubMed] [Google Scholar]
- 35.Albert DM, Wagoner MD, Moazed K, Kimball GP, Gonder JR. Heterotransplantation of human choroidal melanoma into the athymic “nude” mouse. Invest Ophthalmol Vis Sci. 1980;19:555–559. [PubMed] [Google Scholar]
- 36.Heegaard S, Spang-Thomsen M, Prause JU. Establishment and characterization of human uveal malignant melanoma xenografts in nude mice. Melanoma Res. 2003;13:247–251. doi: 10.1097/00008390-200306000-00004. [DOI] [PubMed] [Google Scholar]
- 37.Apte RS, Niederkorn JY, Mayhew E, Alizadeh H. Angiostatin produced by certain primary uveal melanoma cell lines impedes the development of liver metastases. Arch Ophthalmol. 2001;119:1805–1809. doi: 10.1001/archopht.119.12.1805. [DOI] [PubMed] [Google Scholar]
- 38.Maniotis AJ, Chen X, Garcia C, et al. Control of melanoma morphogenesis, endothelial survival, and perfusion by extracellular matrix. Lab Invest. 2002;82:1031–1043. doi: 10.1097/01.lab.0000024362.12721.67. [DOI] [PubMed] [Google Scholar]
- 39.COMS. Histopathologic characteristics of uveal melanomas in eyes enucleated from the collaborative ocular melanoma study COMS report no. 6. Am J Ophthalmol. 1998;125:745–766. doi: 10.1016/s0002-9394(98)00040-3. [DOI] [PubMed] [Google Scholar]
- 40.Ma D, Luyten GP, Luider TM, Niederkorn JY. Relationship between natural killer cell susceptibility and metastasis of human uveal melanoma cells in a murine model. Invest Ophthalmol Vis Sci. 1995;36:435–441. [PubMed] [Google Scholar]
- 41.Ma D, Gerard RD, Li XY, Alizadeh H, Niederkorn JY. Inhibition of metastasis of intraocular melanomas by adenovirus-mediated gene transfer of plasminogen activator inhibitor type 1 (PAI-1) in an athymic mouse model. Blood. 1997;90:2738–2746. [PubMed] [Google Scholar]
- 42.McLean MJ, Foster WD, Zimmerman LE. Prognostic factors in small malignant melanomas of choroid and ciliary body. Arch Ophthalmol. 1977;95:48–58. doi: 10.1001/archopht.1977.04450010050004. [DOI] [PubMed] [Google Scholar]
- 43.Mooy CM, Luyten GP, de Jong PT, et al. Immunohistochemical and prognostic analysis of apoptosis and proliferation in uveal melanoma. Am J Pathol. 1995;147:1097–1104. [PMC free article] [PubMed] [Google Scholar]
- 44.Seddon JM, Albert DM, Lavin PT, Robinson N. A prognostic factor study of disease-free interval and survival following enucleation for uveal melanoma. Arch Ophthalmol. 1983;101:1894–1899. doi: 10.1001/archopht.1983.01040020896012. [DOI] [PubMed] [Google Scholar]
- 45.Mooy CM, De Jong PT. Prognostic parameters in uveal melanoma: a review. Surv Ophthalmol. 1996;41:215–228. doi: 10.1016/s0039-6257(96)80024-5. [DOI] [PubMed] [Google Scholar]