Abstract
Aim
To investigate the relationship between optic disc area and axial length in normal eyes of white and black people.
Methods
Consecutive eligible normal subjects were enrolled. Ocular biometry was obtained using A‐scan ultrasonography, and reliable images of the optic disc were obtained using a confocal scanning laser ophthalmoscope. The relationship between optic disc area and axial length was assessed using univariate and multivariate models.
Results
281 eyes of 281 subjects were enrolled. Black subjects (n = 157) had significantly larger discs (mean (SD) disc area, 2.12 (0.5) mm2) than white subjects (n = 124; 1.97 (0.6) mm2; t test, p = 0.02). Optic disc area increased with axial length (Pearson's correlation coefficient, r = 0.13, p<0.035) for the entire study population. Multivariate regression models including race, disc area and axial length showed that a significant but weak linear relationship exists between axial length and disc area (partial correlation coefficient 0.14; p<0.024), and with race and disc area (partial correlation coefficient 0.19; p<0.017) when adjusted for the effects of other terms in the model.
Conclusion
Increased disc area is associated with longer axial length measurements and African ancestry. This may have implications for pathophysiology and risk assessment of glaucoma.
Morphological characteristics of the optic disc are routinely assessed during glaucoma screening, diagnosis and longitudinal disease management. Controversy remains over the importance of optic disc size as an independent risk factor for the onset and progression of glaucomatous optic neuropathy.1 The optic disc area is significantly larger in eyes with high myopia compared with those with emmetropia and hyperopia.1,2,3,4,5,6 There is a possible link between open‐angle glaucoma and myopia, but the mechanism responsible for this relationship is still unknown.7,8
Further, black people are known to have relatively larger discs compared with white people,9,10,11,12,13,14 and there is a higher prevalence of primary open‐angle glaucoma with higher rates of blindness in the first group.7,15,16,17
The purpose of this study was to assess optic disc topography and axial length in a population of black and white normal subjects, and to determine whether optic disc area is related to axial length.
Methods
This study was approved by the Institutional Review Board for Human Research of the New York Eye and Ear Infirmary and by the University of Alabama at Birmingham Human Subjects Committee, and all subjects provided signed informed consent. Consecutive eligible volunteers underwent complete ophthalmologic examination including slit‐lamp biomicroscopy, intraocular pressure (IOP) measurement, stereoscopic fundus examination, simultaneous stereoscopic photographs of the optic disc (Nidek 3‐Dx Stereo disc camera, Nidek, Fremont, California, USA), bilateral standard, achromatic 24‐2 perimetry using the Swedish interactive thresholding algorithm testing strategy (Humphrey Field Analyzer II, Carl Zeiss Meditec, Dublin, California, USA), ocular biometry (A‐scan, A 2500, Sonomed, Lake Success, New York, USA) and confocal scanning laser ophthalmoscopy (Heidelberg Retina Tomograph II (HRT II), Heidelberg Engineering, Dossenheim, Germany).
Eligible subjects were aged ⩾18 years, had a normal ophthalmic examination including a best corrected visual acuity of ⩾20/40, refractive error < 5D sphere and <3D cylinder, normal slit lamp biomicroscopy and IOP <22 mm Hg. Achromatic perimetry was unremarkable and reliable (⩽33% false positives, 33% false negatives and 33% fixation losses, pattern standard deviation within 95% normal limits and glaucoma hemifield test results normal). Subjects with a history of intraocular surgery, other intraocular disease and diseases affecting the visual field or colour vision were excluded. Racial groups were defined by self‐report, determined by an interviewer‐administered questionnaire defining self‐described race as African‐American, Caucasian, or other. Only those from the first two races were eligible for the study.
The HRT II confocal scanning laser ophthalmoscope employs a diode laser (670 nm wavelength) to produce three‐dimensional measurements of optic disc topography on the basis of reflectance from the retinal and optic disc surfaces. It provides topographic measurements of the optic nerve and peripapillary retina. The topographic image is derived from 32–64 transverse optical section images taken at consecutive focal depth planes.
Although pupil dilation is often not required, all subjects were imaged after dilation. Keratometry measurements were used to correct for magnification error. Three 15° images of one eye were obtained in sequence per imaging session automatically by the instrument. A mean topography image adjusted for alignment and rotation was created automatically with the existing software and used for all analyses. Good image quality was evaluated by an experienced operator who outlined the disc margin while viewing the respective stereoscopic photograph, and was defined as follows: acquisition sensitivity <90%, topography standard deviation (SD) <40 μm, more than three quarters of the disc within the target circle, minimal movement during the acquisition movie, no floaters over the disc, and good imaging clarity and exposure. The HRT II software was used to calculate disc area during image analysis.
One eye was randomly selected for the statistical analyses performed using SPSS for Windows V.13.0 and SAS for window V.9.0. Student's t test was used for comparison of characteristics between black and white subjects, with respect to continuous variables such as age, axial length and disc area. Spearman's partial correlations were calculated from general linear models to determine whether a significant independent linear relationship exists between axial length and disc area, controlling for the influences of race; p<0.05 was considered significant.
Results
A total of 281 eyes of 281 eligible subjects (124 (44%) white subjects and 157 (56%) black subjects) were enrolled. Their mean (SD, range) age was 42.6 (12.7, 18–77) years, mean (SD, range) axial length was 23.67 (0.9, 21.68–27.36) mm and mean (SD, range) disc area was 2.05 (0.5, 0.95–4.8) mm2. Table 1 gives the distributions for age, axial length and disc area for the whole study group, for black and white subjects.
Table 1 Distribution of age, axial length and disc area of the entire study population (n = 281) comprising black (n = 157) and white (n = 124) subjects.
| All | Black subjects (B) | White subjects (W) | p Value (t test) B v W | ||||
|---|---|---|---|---|---|---|---|
| Mean (SD) | Range | Mean (SD) | Range | Mean (SD) | Range | ||
| Age (years) | 42.6 (12.7) | 18–77 | 43.9 (13) | 19–77 | 41 (12.2) | 18–69 | 0.06 |
| Axial length (mm) | 23.67 (0.9) | 21.68–27.36 | 23.6 (0.8) | 21.72–25.82 | 23.7 (0.9) | 21.68–27.36 | 0.4 |
| Disc area (mm2) | 2.05 (0.5) | 0.95–4.8 | 2.12 (0.5) | 1.15–3.95 | 1.97 (0.6) | 0.95–4.8 | 0.02 |
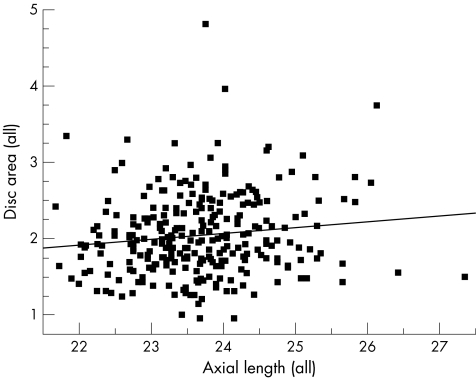
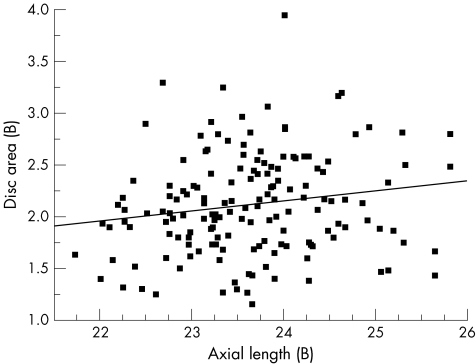
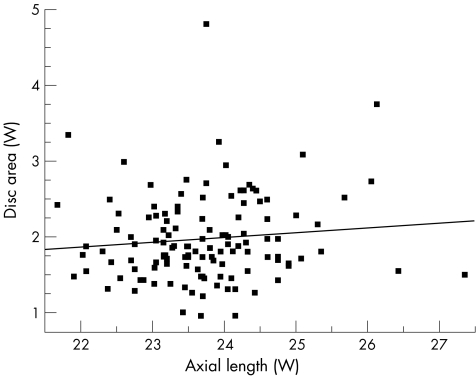
Univariate regression models showed that optic disc area increased with axial length (Pearson's correlation coefficient r = 0.13, p<0.035), for the entire study population (n = 281; fig 1). As a separate group, black subjects presented a similar significant correlation between axial length and disc area (r = 0.17, p<0.037; fig 2). Among white subjects the correlation between axial length and disc area did not reach significance (r = 0.1, p<0.250; fig 3).
Figure 1 Scatter plot showing the relationship between disc area and axial length for the entire study population (n = 281); r = 0.13, p<0.035.
Figure 2 Scatter plot showing the relationship between disc area and axial length in black (B) subjects (n = 157); r = 0.17, p<0.037.
Figure 3 Scatter plot showing the relationship between disc area and axial length in white (W) subjects (n = 124); r = 0.1, p<0.25.
Multiple linear regression models including race, disc area and axial length showed that a significant but weak linear relationship exists between axial length and disc area (partial correlation coefficient 0.14; p<0.024), and with race and disc area (partial correlation coefficient 0.19; p<0.017) when adjusted for the effects of other terms in the model.
Discussion
We were able to show a significant and positive correlation between axial length and disc area assessed with HRT II in the normal eyes of black and white subjects. Increased disc area was associated with longer axial length measurements and African ancestry.
Previous reports assessing the relationship between disc area and myopia vary. Disc area increased with increasing myopia in highly myopic eyes (>–8.00 D) of both normal white subjects and those with glaucoma whose optic discs were evaluated with stereophotographs, but not in highly myopic eyes.5,6,18 In a population‐based study including normal white subjects and those with glaucoma, disc and rim area measured in projections of stereophotographs had a negative correlation with refractive error even in patients with lower myopia.3 Optic disc and rim areas measured with the Rodenstock Optic Disc Analyzer in normal eyes of white subjects correlated with axial length.19
Many investigators, in both selected cohorts and population‐based studies, have reported that there is no significant difference in rim area between black and white subjects.10,11,13,14 In the only study that found smaller rim area in black subjects, the investigators evaluated the optic disc of ocular hypertensives using HRT,9 in contrast with the other studies that evaluated normal subjects. Some of the subjects in the first study may have presented early structural damage,20 which probably accounts for the discrepancy in results. These studies found that black subjects have a larger disc area than white subjects.9,10,11,13,14 The relationship between these anatomical differences in optic disc structure between black and white subjects and the more aggressive disease seen in black populations is unclear.7,15,16 There is a biomechanical disadvantage of the larger disc.
The role of optic disc size in glaucoma is still unclear. There are several studies supporting the theory that a larger disc may impart a greater risk for developing and progressing with glaucomatous damage. Jonas et al21,22 have reported a higher susceptibility for neuroretinal rim loss in areas with a longer distance to the exit of the central retinal vessels than in areas with a short distance. Also, computational finite element models developed using idealised posterior scleral shells suggested that a larger disc and consequent larger lamina cribrosal surface area would undergo greater displacement in the presence of increased IOP.10 In highly myopic eyes the lamina cribrosa is thinner and its posterior surface is more exposed to the cerebrospinal fluid space, which may increase the translaminar pressure gradient at a given IOP.23 Black subjects are known to have larger discs and a worse natural history of glaucoma than white subjects.7,15,16 In contrast with the supporting evidence, there are reports that (1) optic nerve fibres are more crowded and are thus possibly more susceptible to mechanical deformation in small discs24; (2) small discs have a smaller anatomical reserve because they contain fewer axons25; and (3) optic disc size is not associated with the frequency of progression of glaucomatous visual field defect.26
According to a cross‐sectional study with magnetic resonance imaging analysis of normal living eyes with myopia and emmetropia grouped by refractive correction, eyes with myopia have greater dimensions (length, width and height), predominantly in length, than those with emmetropia.27 The differences in length, height and width significantly correlated with best sphere correction, suggesting that an eye with myopia, while developing, grows in all directions.27 The relative weakness of axial length as a predictor for disc area may be explained by the variable patterns of eye growth associated with myopia, as a long eye may have a small disc if its width and height do not increase as much as its length.
In summary, both axial length and race have a significant but weak independent correlation with disc area. Further investigation taking into consideration the differences in patterns of eye expansion could contribute to the elucidation of differences in disc morphology and therefore in susceptibility to glaucomatous damage between black and white subjects.
Abbreviations
HRT II - Heidelberg Retina Tomograph II
IOP - intraocular pressure
Footnotes
Funding: This work was supported in part by The Jane Banks Research Fund, The New York Glaucoma Research Institute, New York, NY and grant number K23‐EY 13959‐01.
Competing interests: None declared.
This work was presented in part at the annual meeting of the Association for Research in Vision and Ophthalmology 2005.
References
- 1.Jonas J B, Budde W M, Panda‐Jonas S. Ophthalmoscopic evaluation of the optic nerve head. Surv Ophthalmol 199943293–320. [DOI] [PubMed] [Google Scholar]
- 2.Jonas J B, Gusek G C, Naumann G O. Optic disk morphometry in high myopia. Graefe's Arch Clin Exp Ophthalmol 1988226587–590. [DOI] [PubMed] [Google Scholar]
- 3.Ramrattan R S, Wolfs R C, Jonas J B.et al Determinants of optic disc characteristics in a general population: The Rotterdam Study. Ophthalmology 19991061588–1596. [DOI] [PubMed] [Google Scholar]
- 4.Chihara E, Chihara K. Covariation of optic disc measurements and ocular parameters in the healthy eye. Graefe's Arch Clin Exp Ophthalmol 1994232265–271. [DOI] [PubMed] [Google Scholar]
- 5.Jonas J B, Dichtl A. Optic disc morphology in myopic primary open‐angle glaucoma. Graefe's Arch Clin Exp Ophthalmol 1997235627–633. [DOI] [PubMed] [Google Scholar]
- 6.Jonas J B. Optic disk size correlated with refractive error. Am J Ophthalmol 2005139346–348. [DOI] [PubMed] [Google Scholar]
- 7.Lotufo D, Ritch R, Szmyd L., Jret al Juvenile glaucoma, race, and refraction. JAMA 1989261249–252. [PubMed] [Google Scholar]
- 8.Mitchell P, Hourihan F, Sandbach J.et al The relationship between glaucoma and myopia: the Blue Mountains Eye Study. Ophthalmology 19991062010–2015. [DOI] [PubMed] [Google Scholar]
- 9.Zangwill L M, Weinreb R N, Berry C C.et al Racial differences in optic disc topography: baseline results from the confocal scanning laser ophthalmoscopy ancillary study to the ocular hypertension treatment study. Arch Ophthalmol 200412222–28. [DOI] [PubMed] [Google Scholar]
- 10.Chi T, Ritch R, Stickler D.et al Racial differences in optic nerve head parameters. Arch Ophthalmol 1989107836–839. [DOI] [PubMed] [Google Scholar]
- 11.Varma R, Tielsch J M, Quigley H A.et al Race‐, age‐, gender‐, and refractive error‐related differences in the normal optic disc. Arch Ophthalmol 19941121068–1076. [DOI] [PubMed] [Google Scholar]
- 12.Beck R W, Messner D K, Musch D C.et al Is there a racial difference in physiologic cup size? Ophthalmology 198592873–876. [DOI] [PubMed] [Google Scholar]
- 13.Girkin C A, McGwin G, Jr, Xie A.et al Differences in optic disc topography between black and white normal subjects. Ophthalmology 200511233–39. [DOI] [PubMed] [Google Scholar]
- 14.Tsai CZ L, Gonzales C, Irak I.et al Ethnic differences in optic nerve head topography. J Glaucoma 19954248–257. [PubMed] [Google Scholar]
- 15.Sommer A, Tielsch J M, Katz J.et al Racial differences in the cause‐specific prevalence of blindness in east Baltimore. N Engl J Med 19913251412–1417. [DOI] [PubMed] [Google Scholar]
- 16.Sommer A. Glaucoma risk factors observed in the Baltimore Eye Survey. Curr Opin Ophthalmol 1996793–98. [DOI] [PubMed] [Google Scholar]
- 17.Tielsch J M, Sommer A, Katz J.et al Racial variations in the prevalence of primary open‐angle glaucoma. The Baltimore Eye Survey. JAMA 1991266369–374. [PubMed] [Google Scholar]
- 18.Jonas J B, Dichtl A, Budde W M.et al Optic disc morphology in pigmentary glaucoma. Br J Ophthalmol 199882875–879. [DOI] [PMC free article] [PubMed] [Google Scholar]
- 19.Tsai C S, Ritch R, Shin D H.et al Age‐related decline of disc rim area in visually normal subjects. Ophthalmology 19929929–35. [DOI] [PubMed] [Google Scholar]
- 20.Cioffi G A, Liebmann J M. Translating the OHTS results into clinical practice. J Glaucoma 200211375–377. [DOI] [PubMed] [Google Scholar]
- 21.Jonas J B, Fernandez M C. Shape of the neuroretinal rim and position of the central retinal vessels in glaucoma. Br J Ophthalmol 19947899–102. [DOI] [PMC free article] [PubMed] [Google Scholar]
- 22.Jonas J B, Budde W M, Nemeth J.et al Central retinal vessel trunk exit and location of glaucomatous parapapillary atrophy in glaucoma. Ophthalmology 20011081059–1064. [DOI] [PubMed] [Google Scholar]
- 23.Jonas J B, Berenshtein E, Holbach L. Lamina cribrosa thickness and spatial relationships between intraocular space and cerebrospinal fluid space in highly myopic eyes. Invest Ophthalmol Vis Sci 2004452660–2665. [DOI] [PubMed] [Google Scholar]
- 24.Jonas J B, Schmidt A M, Muller‐Bergh J A.et al Human optic nerve fiber count and optic disc size. Invest Ophthalmol Vis Sci 1992332012–2018. [PubMed] [Google Scholar]
- 25.Quigley H A, Coleman A L, Dorman‐Pease M E. Larger optic nerve heads have more nerve fibers in normal monkey eyes. Arch Ophthalmol 19911091441–1443. [DOI] [PubMed] [Google Scholar]
- 26.Jonas J B, Martus P, Horn F K.et al Predictive factors of the optic nerve head for development or progression of glaucomatous visual field loss. Invest Ophthalmol Vis Sci 2004452613–2618. [DOI] [PubMed] [Google Scholar]
- 27.Atchison D A, Jones C E, Schmid K L.et al Eye shape in emmetropia and myopia. Invest Ophthalmol Vis Sci 2004453380–3386. [DOI] [PubMed] [Google Scholar]


