

Abstract
The farnesoid X receptor (FXR) controls the synthesis and transport of bile acids. Mice lacking expression of FXR, designated Fxr-null, have elevated levels of serum and hepatic bile acids and an increase in bile acid pool size. Surprisingly, at 12 months of age, male and female Fxr-null mice had a high incidence of degenerative hepatic lesions, altered cell foci and liver tumors including hepatocellular adenoma, carcinoma and hepatocholangiocellular carcinoma, the latter of which are rarely observed in mice. At 3-months, Fxr-null mice had increased expression of the proinflammatory cytokine IL-1β mRNA and elevated β-catenin and its target gene c-myc. They also had increased cell proliferation as revealed by increased PCNA mRNA and BrdU incorporation. These studies reveal a potential role for FXR and bile acids in hepatocarcinogenesis.
Keywords: farnesoid X receptor, c-Myc, Il-1β, β-catenin, PCNA, bromodeoxyuridine
Introduction
The farnesoid X receptor (FXR, NR1H4), a member of the nuclear receptor superfamily, controls the synthesis and transport of bile acids in liver and gut [1]. In response to bile acid binding, it positively regulates a number of genes in these tissues that serve to decrease cellular levels of bile acids. In mice, FXR induces the small heterodimer partner (SHP) in liver which downregulates Cyp7a1 and Cyp8b1 genes encoding enzymes that synthesize bile acids from cholesterol, and the Na+-taurocholate pump (NTCP) that transport bile acids from the serum to the liver. It also controls transporters such as the bile salt export pump (BSEP) that transport bile acids from the liver into the bile canaliculi. In the gut, FXR induces the ileal bile acid binding protein (IBABP) and the organic solute and steroid transporter (OST) α/β transporter that serve to transport bile acids from the gut to the circulation where they are transported back to the liver. In addition, in response to bile acids, FXR activates fibroblast growth factor 15/19 (FGF15/19) gene; increased FGF15/19 is transported to the liver where, through the FGFR4 receptor signal transduction pathway, it induces expression of NTCP and downregulates the Cyp7a1 and Cyp8b1 genes [1].
Studies on the Fxr-null mice revealed that FXR is central to control of bile acid homeostasis and enterohepatic circulation of bile acids [2]. Due to the absence of FXR expression, the Fxr-null mice accumulate high hepatic levels of bile acids resulting in steatosis, one of the pathologies of cholestasis in humans. These mice also have elevated serum bile acids, cholesterol and triglycerides, that latter of which contribute to insulin resistance [3,4]. A consequence of hepatosteatosis is liver cell injury that can result in increased oxidative stress and hepatocyte proliferation that can possibly lead to liver cancer. Indeed, in the present study, the Fxr-mice were found to spontaneously develop hepatocellular lesions, adenomas and carcinomas. This was due in part to increased cell proliferation and expression of cytokines and oncogenes.
Materials and methods
Mice
Wild-type and strain-matched Fxr-null mice on a C57NL/6N mixed background were maintained in the NCI vivarium with food and water provided ad libitum. Mice were killed by carbon dioxide asphyxiation. All animal studies were carried out in accordance with Institute of Laboratory Animal Resources (ILAR) guidelines and approved by the National Cancer Institute Animal Care and Use Committee.
Pathology
Histological analysis was carried out on livers of 3-month-old and 12-month-old Fxr-null mice. Tissues were carefully investigated for the existence of tumors after being weighed, and small portions of liver tissues without any macroscopic nodules were snap frozen in liquid nitrogen and stored at −80 °C until further analysis. The remaining liver tissues were fixed in 10% phosphate-buffered formalin, embedded in paraffin, and prepared for routine hematoxylin and eosin staining for histological examination. Serial sections of the liver tumor were also stained by Masson’s Trichrome staining to detect collagen.
RNA analysis
RNA was extracted from liver using TRIzol reagent (Invitrogen, Carlsbad, CA). Quantitative real-time PCR (qPCR) was performed using cDNA generated from 1μg total RNA with SuperScript III Reverse Transcriptase kit (Invitrogen). Primers were designed for qPCR using the Primer Express software (Applied Biosystems), and sequences are available upon request (Supplementary Table). qPCR reactions were carried out using SYBR green PCR master mix (Applied Biosystems) in an ABI Prism 7900HT Sequence Detection System (Applied Biosystems, Foster City, CA). Values were quantified using the Comparative CT method, and samples normalized to β-actin.
Western blot analysis
Total cell extracts were prepared from frozen livers by homogenizing in lysis buffer (20 mM MOPS pH 7.0, 0.5% Triton X-100, 1 mM EDTA, 1 mM EGTA, 1 mM DTT, 1 mM PMSF, 30mM Na3VO4, 1 mM NaF, 20 mM Na4O7P2, protease inhibitors (Complete protease inhibitor cocktail, Roche)). The protein concentration of the total extracts was determined by Bradford method (Bio-rad Protein assay reagent) using bovine serum albumin as standard. For immunoblot analysis, 25 μg of proteins were electrophoresed on 10% SDS-PAGE and transferred onto nitrocellulose membranes blocking in TBS containing 0.5% Tween 20 (Sigma) and 3% non-fat dry milk for 1 h at room temperature. Membrane was overnight incubated with primary antibodies diluted in the blocking buffer: c-myc (9E10) (1:500, sc-40, Santa Cruz), beta-catenin (1:1000, C7270, Sigma), GAPDH (1:1000, Chemicon) at 4 °C and anti-mouse horseradish peroxidase-conjugated IgG (Jackson ImmunoResearch) for 1 h at room temperature. Immunoreactive bands were identified with chemiluminescence detection system, as described by the manufacturer's protocol (PerkinElmer Lab.).
Hepatocyte proliferation
For the BrdU incorporation study, mice were anesthetized with 2.5% avertin and implanted subcutaneously with an osmotic pump (Alzet model 2001, DURECT Corporation, Cupertino, CA) containing 200 μl of 16 mg/ml BrdU (Sigma, St. Louis, MO). After 1 week of treatment, mice were killed by overexposure to carbon dioxide and livers were removed and fixed in 10% phosphate-buffered formalin (Fisher scientific, Fair Lawn, NJ). Serial sections were prepared for BrdU staining and Tunel assay. Sections from the duodenum were also obtained and fixed in 10% phosphate-buffered formalin in order to verify uniform flow of BrdU up to the time the animals were killed. Immunostaining for BrdU (DakoCytomation, Carpinteria, CA) was performed using monoclonal antibody labeled with biotin by the ARK kit (DakoCytomation, Carpinteria, CA) prior to application to tissues. In brief, sections were rinsed and incubated sequentially in primary antibody (diluted 1: 100 in PBS containing 1% BSA) for 2 h at room temperature, avidin-biotinylated peroxidase complex (Vector Laboratory, Burlingame, CA) in PBS for 30 min. The bound antibody was visualized by 3,3′-diaminobenzidine (DAB) as a peroxidase substrate. Sections were rinsed in water, counterstained with Hematoxylin (Sigma), dehydrated, and mounted in permanent mounting medium. The proliferating cells were quantitated as number of brown color (i.e. BrdU incorporated) cells out of the total hematoxylin-stained cells (blue nuclei).
Tunel assay
Tunel assay was performed on serial sections obtained from BrdU study using DeadEnd Colorimetric Tunel System (Promega, WI) according to manufacturer’s protocol. Briefly, after deparaffinization, sections were treated with proteinase K (Sigma Chemical; St Louis, MO) in PBS (20 μg/ml) for 15 min at room temperature, fixed in 10% phosphate-buffered formalin for 5 min and incubated with biotinylated nucleotide in rTdT reaction buffer for 1 h at 37 °C. After terminating the reaction with 2X SSC for 15 min at room temperature, endogenous peroxidase activity was blocked using 3% H2O2 in distilled water for 10 min. Sections were incubated with Sterptavidin HRP (1:500 in PBS) for 30 min at RT and the bound conjugates were visualized by 3,3′-diaminobenzidine (DAB) as a peroxidase substrate counterstained with Hematoxylin (Sigma), dehydrated, and mounted in permanent mounting medium. Positively stained hepatocyte nuclei were counted in at least 10 randomly chosen fields (X200) from three mice. The Tunel positive nuclei were quantitated as a percentage of hematoxylin-stained nuclei (blue nuclei).
Bile acid analysis
For serum bile acid analysis, wild-type and Fxr-null mice were anesthetized with 2.5% avertin and trunk blood collected in a serum separator tube (Becton Dickinson, Franklin Lakes, NJ) and the serum was separated by centrifugation at 7,000 g for 5 min. For hepatic bile acid measurements, 0.1 g of liver, without macroscopic gross lesions, was homogenized in 70% ethanol, shaking incubated at 50 ºC for 2 h, and centrifuged at 10,000 rpm for 10 min. The supernatant was used for the bile acid assay. Total BA pool size was determined using liver, gallbladder and intestine with its contents. In brief, collected liver, gallbladder and intestine were weighed, freeze-dried and powered together and bile acid extract was prepared by shaking incubating in 70% ethanol at 50 ºC for 4 h followed by the same procedure for hepatic bile acid extract. The BA content of all samples was measured by colorimetric analysis using a BA analysis kit (Sigma, St. Louis, MO). The BA pool size was calculated based on the weight of BA pool tissues and normalized by body weight.
Statistical analysis
Variations in liver/body weight ratio, bile acid levels, gene expression and BrdU analysis between the different treatments or animal strains were evaluated with student t-test. Variations in the incidences of tumors were evaluated with One-way Fractorial ANOVA and Multiple Comparison tests. All the calculations for statistical analysis were performed using the Statview SE+ Graphics, version 5.0 (Abacus Concepts, Berkeley, CA).
Results
To verify the loss of FXR expression in the Fxr-null mice, FXR mRNA levels were analyzed in 3-month-old and 12-month-old wild-type and Fxr-null mice (Figure 1A). FXR mRNA expression in 12-month-old wild-type mice was less than 1/3 that of 3-month-old mice. No significant mRNA was detected in livers of Fxr-null mice or either age. As expected, expression of the FXR target gene Shp was high in young and old wild-type mice and low in the Fxr-null mice (Figure 1B). Conversely, levels of the SHP target gene Cyp7a1 was low in wild-type mice and high in Fxr-null mice with the 12-month-old mice showing twice the levels of Cyp7a1 mRNA than the 3-month-old null mice (Figure 1C).
Figure 1.
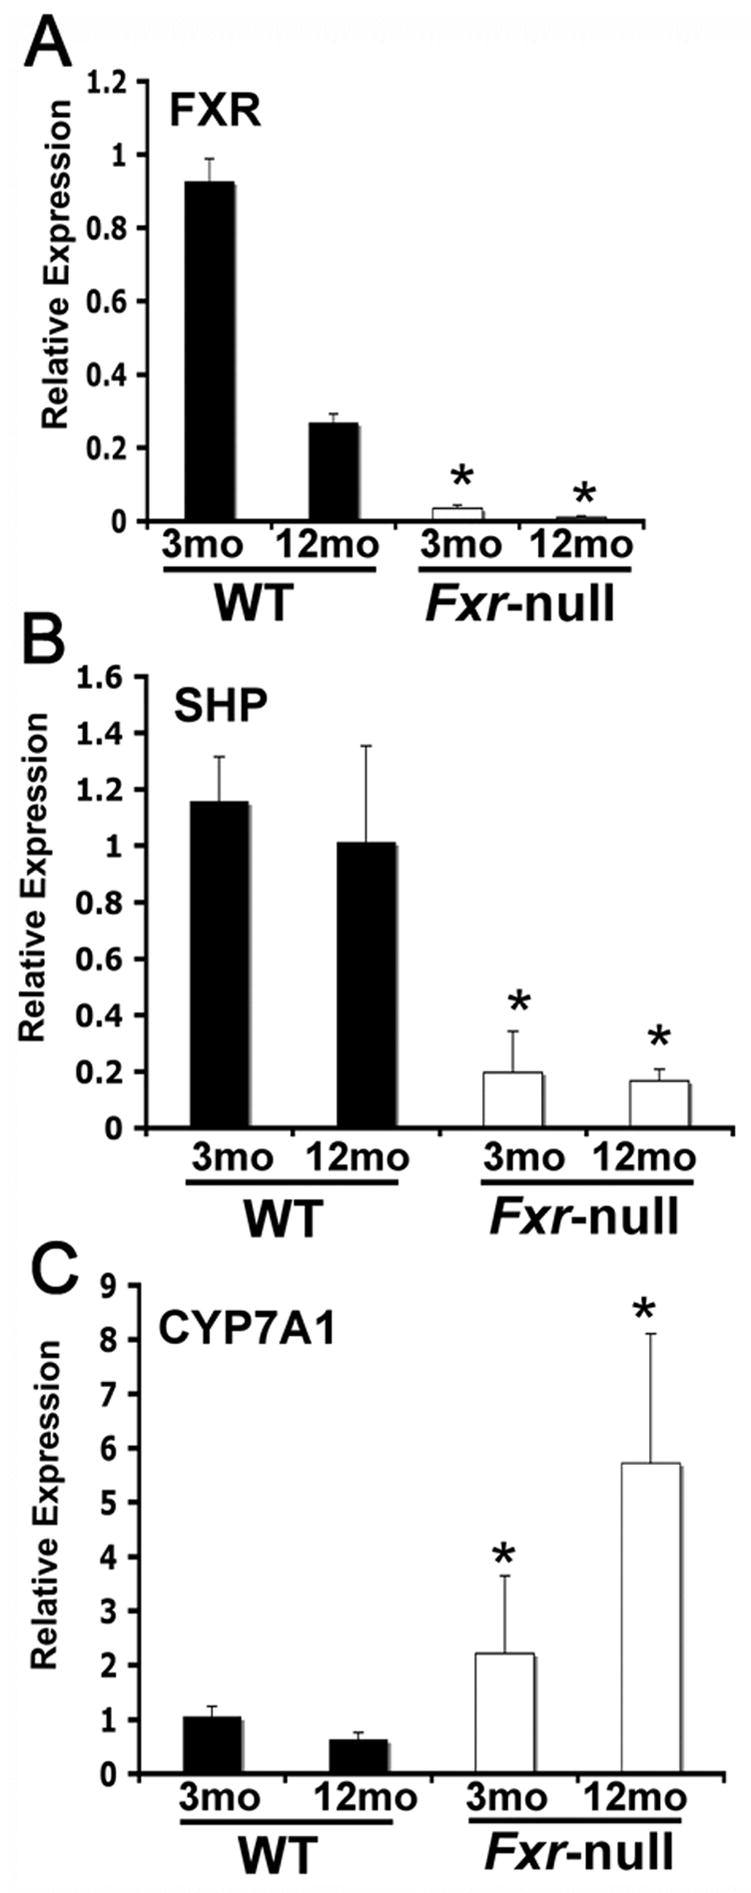
Gene expression analysis from liver tissue in 3-month-old (3mo) and 12-month-old (12mo) wild-type and Fxr-null mice. FXR, CYP7A1, and SHP mRNA expression was assessed by qPCR. Expression was normalized to β-actin and each bar represents the mean value ± S.D. (*)= p < 0.05 compared to livers from age-matched wild-type controls.
Body weights of Fxr-null mice were about 20% less than the corresponding wild-type mice regardless of the age (Figure 2A), whereas the liver size, as a percentage of body weight of the Fxr-null mice, was higher than wild-type mice only in 12 month-old Fxr-null mice (Figure 2B). As expected, the serum bile acids were higher in young Fxr-null mice, as noted in an earlier study [2]. The serum bile acids levels in old Fxr-null mice was 5.6-fold higher than that of control wild-type mice (15.6 ± 3.8 vs. 91.5 ± 26.5 μM; p=0.03) and was about 3 times higher than in the serum of young Fxr-null mice (Figure 2C). Livers of the Fxr-null mice are constantly exposed to higher bile acids levels as indicated by the increased bile acid pool size in the 3-month-old Fxr-null mice (Figure 2D). Most importantly hepatic bile acid levels were twice as high in 12-month-old Fxr-null mice reaching levels of up to 300 μM/g liver tissue (Figure 2E).
Figure 2.
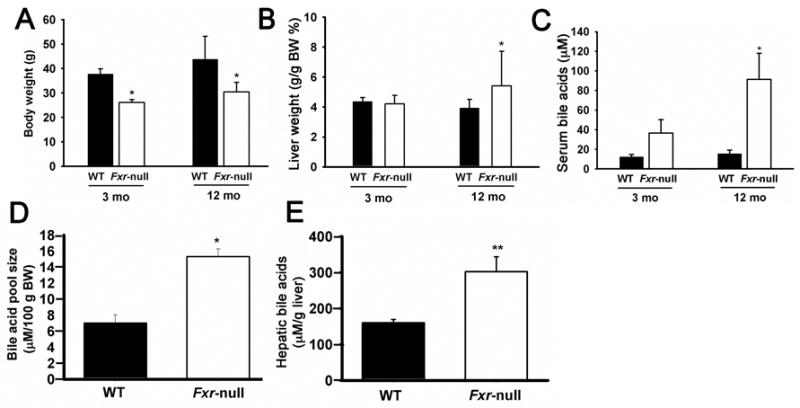
Body weights, liver weights and bile acid levels in wild-type and Fxr-null mice. Body weights and liver weights were determined in 3-month-old and 12-month-old wild-type (WT) and Fxr-null mice. Serum and bile acid pool size determined in 3-month-old (3mo) and serum and liver bile acids determined 12-month-old (12mo) wild-type (WT) and Fxr-null mice. (*)= p < 0.05
Both male and female Fxr-null mice killed at 12-months of age were found to have liver lesions (Table 1). Fxr-null livers exhibited macroscopic gross lesions (Figure 3a) and histological analysis revealed that in most 12-month-old mice, degenerative lesions were found that consisted of hypertrophic and eosinophilic hepatocytes accompanied by proliferating oval cells and lipid disposition (Figure 3b, 3g). Hepatocellular adenomas were observed in a number of mice characterized as well-circumscribed lesions composed of well-differentiated hepatocytes (Figure 3c). Hepatocellular carcinoma (Figure 3d) and mixed tumors that consisted of hepatocellular and cholangiocellular components were also found in a few mice (Figure 3e). Mixed tumor involved a fibrous stroma as noted by Masson’s Trichrome staining (Figure 3f) and immune cell infiltration, ductule formation, and fibrosis (Figure 3h). Of 53 mice, 64 % of mice had preneoplastic foci, 36% had adenomas and 6% had hepatocellular carcinomas; 9% had mixed hepatocellular carcinomas, hepatocholangiocellular carcinoma (Table 1). A total tumor incidence of 38% was found in the 12-month-old Fxr-null mice. In the control wild-type mice, no foci or tumors were noted. Similar percentages of foci and tumors were found in males and female mice. These data indicated that absence of FXR resulted in hepatic carcinogenesis.
Table 1.
Incidence of liver lesions
| Strain | Gender | Mice # | Preneoplastic foci (%) | Adenoma | HCC | Mixed HCC | Total tumor incidence |
|---|---|---|---|---|---|---|---|
| WT | Male | 16 | 0 (0) | 0 (0) | 0 (0) | 0 (0) | 0 (0) |
| Female | 16 | 0 (0) | 0 (0) | 0 (0) | 0 (0) | 0 (0) | |
| Total | 32 | 0 (0) | 0 (0) | 0 (0) | 0 (0) | 0 (0) | |
| Fxr-null | Male | 31 | 19 (61)** | 10 (32)* | 2 (6.5) | 3 (9.7) | 10 (32)* |
| Female | 22 | 15 (68)** | 9 (41)* | 1 (4.5) | 2 (9.1) | 10 (45)** | |
| Total | 53 | 34 (64)** | 19 (36)** | 3 (5.7) | 5 (9.4) | 20 (38)** |
HCC; Hepatocellular carcinoma
P<0.05 compared with different genotype
P<0.05 compared with different genotype
No difference was seen among the different genders
Figure 3.

Representative photomicrographs of liver lesions from 12 month-old Fxr-null mice. (a) Representative Fxr-null liver with macroscopic gross lesion. (b) Toxic lesions including hypertrophic and eosinophilic hepatocytes accompanied by fat disposition, were detected in most Fxr-null mouse livers to various extents. Altered cell foci (arrows) were detected at a high incidence in this group regardless of the gender (original magnification X100). (c) Representative photomicrograph of a hepatocellular adenoma (arrow) which was characterized as well-circumscribed lesions composed of well-differentiated hepatocytes, compressing adjacent parenchyma without normal lobular architecture (original magnification X100). (d) Photomicrograph of hepatocellulr carcinoma (original magnification X400) (e) Photomicrograph of mixed tumor (original magnification X100). Histologically, this tumor consisted of hepatocellular (left side) and cholangiocellular (right side) components, and involved increased fibrous stroma detected by Masson’s Trichrome staining (f; original magnification X40). The hepatocellular component showed a trabecular growth pattern and consisted of moderately differentiated neoplastic hepatocytes, and cholangiocellular components showed poorly formed tubular structures lined by low cuboidal cells. Based on these findings, this mixed tumor was diagnosed as a hepatocholangiocellular carcinoma. (g) Oval cell proliferation (arrows) and ductules (original magnification X200). (h) Mixed tumor with inflammatory cell infiltration, ductules formation, and fibrosis (original magnification X200)
To investigate the mechanism contributing to the formation of liver tumors in Fxr-null mice, the expression of genes involved in inflammation and cell proliferation was analyzed in non-neoplastic hepatic parenchyma. In addition, the cell proliferative gene β-catenin and its target gene c-myc were also examined in young and aging Fxr-null mice. Among the cytokines examined (IFNγ, IL-1β, IL-2, IL-6, IL-10, IL-12p35, IL-12p40, IL-23p19, iNOS, MCP-1 and TNFα) (data not shown), only IL-1β mRNA levels were increased in 3-month-old and 12-month-old Fxr-null mice as compared to wild-type mice (Figure 4A). The oncogene c-myc mRNA was also elevated Fxr-null mice with higher levels noted in younger mice. The protein level of c-myc was accordingly increased in Fxr-null mice at both ages (Figure 4B). β-Catenin was increased about 30% over controls in 3-month-old mice; levels more than double in 12-month-old Fxr-null mice as compared to age-matched wild-type mice (Figure 4A). Nonetheless, the protein level of β-Catenin did not show detectable differences analyzed using total liver protein extract.
Figure 4.

(A) Gene expression analysis from liver tissue in 3-month-old (3mo) and 12-month-old (12mo) wild-type and Fxr-null mice. IL-1β, C-Myc, β-catenin and PCNA mRNA expression was assessed by qPCR. Expression was normalized to β-actin and each bar represents the mean value ± S.D. (*)= p < 0.05 compared to livers from age-matched wild-type controls. (B) Western blot analysis of c-myc and β-catenin was performed using total protein extract from livers without macroscopic gross lesions. GAPDH was used as an equal loading control. Bars at the right side indicate positions of size markers (Bio-rad Pre-stained SDS-PAGE standard low range).
Due to the critical role of c-myc in cell proliferation, PCNA expression was examined. Indeed, PCNA mRNA was markedly elevated in 3-month-old Fxr-null mice in non-neoplastic hepatic parenchyma (Figure 4A). In 12-month-old Fxr-null mice, PCNA mRNA expression was signficantly decreased. A decrease was also noted in 12-month-old wild-type mice as compared to 3-month-old wild-type mice. To confirm the extent of cell proliferation, BrdU incorporation was assessed in 3-month-old and 12-month-old wild-type and Fxr-null mice (Figure 5A and 5B). A marked increase in labeled nuclei was found in 3-month old Fxr-null mice compared to age-matched wild-type mice. There was also an increase in BrdU incorporation in 12-month-old Fxr-null mice compared to controls, albeit the extent of labeling was very low (Figure 5B). Incorporation of BrdU into intestinal epithelial cells did not differ between the 3-month-old wild-type and Fxr-null mice indicating that BrdU content was similar between the two lines (data not shown).
Figure 5.

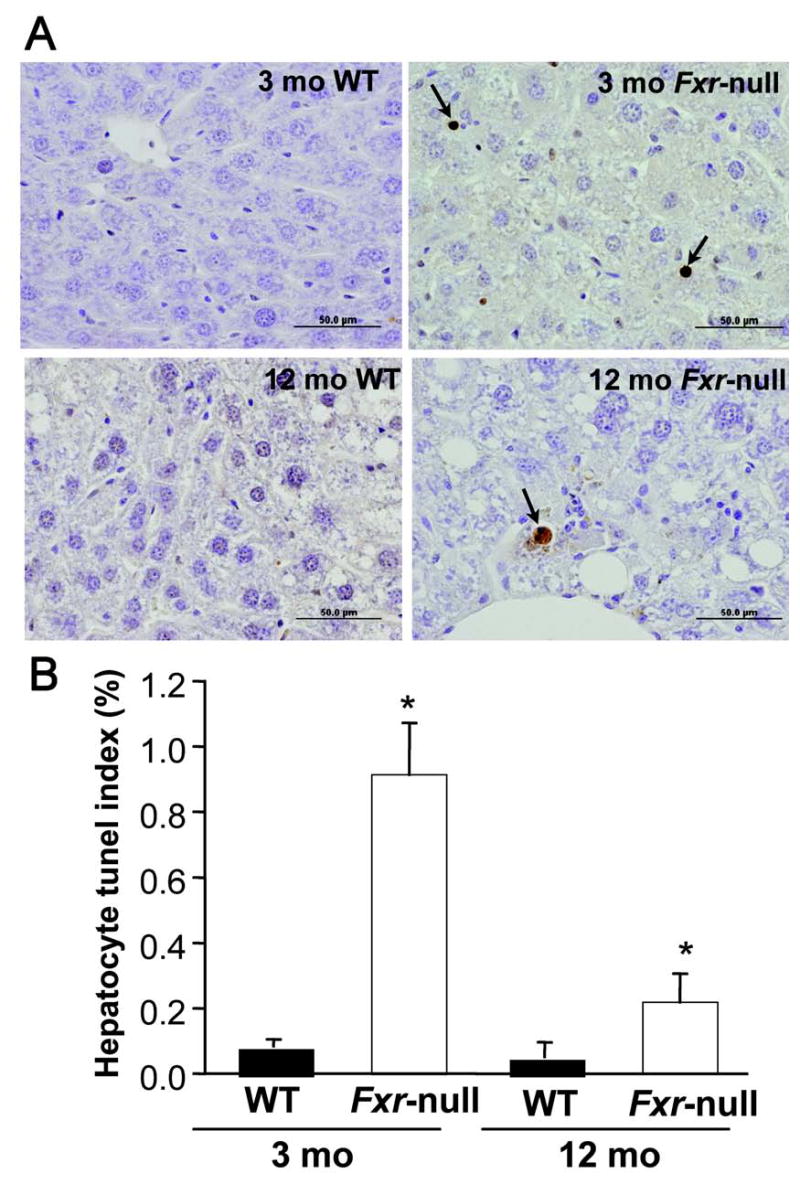
Induction of hepatocyte proliferation and increase in hepatocyte Tunel index in Fxr-null mice. (A) Immunohistochemistry of BrdU-labeled hepatocyte nuclei from livers of 3-month-old (3mo) and 12-month-old (12mo) wild-type (WT) and Fxr-null mice. (B) Quantitation of BrdU labeling index from livers of 3-month-old (3mo) and 12-month-old (12mo) wild-type (WT) and Fxr-null mice. (C) Immunohistochemistry of Tunel positive hepatocyte nuclei from livers of 3-month-old (3mo) and 12-month-old (12mo) wild-type (WT) and Fxr-null mice. (D) Quantitation of hepatocyte Tunel index from livers of 3-month-old (3mo) and 12-month-old (12mo) wild-type (WT) and Fxr-null mice. Quantitation was done by counting at least 10 randomly chosen fields (X200) from three mice livers. Each bar represents the mean value ± S.D. (*)= p < 0.05 compared to livers from age-matched wild-type controls.
Hepatocyte apoptosis was evaluated by Tunel assay using a serial section from BrdU study (Figure 5C and 5D). There was about 10-fold increase in Tunel positive hepatocytes in 3 month-old Fxr-null mouse liver compared to in age-matched wild-type mice (Figure 5D). In 12 month-old Fxr-null mice, the incidence of tunel positive hepatocytes was decreased compared to 3 month-old Fxr-null mice and was about 3-fold higher than in age-matched wild-type controls.
Discussion
Mice lacking expression of FXR were found to develop toxic liver lesions and liver tumors at 12 months of age with a high incidence of 38% of mice having liver tumors. Since all mice were killed at 12 months of age, the possibility remains that the incidence would have approached 100% in older mice. In this experiment, two major histological types of tumor were detected, hepatocellular adenoma/carcinoma and hepatochorangiocellular carcinoma. Hepatocellular adenoma/carcinoma is a very common liver tumor in mice and in B6C3H mice can arise spontaneously at an incidence of up to 40% in a 2-years bioassay [5]. On the other hand, hepatocholangiocellular carcinoma is a very rare tumor and the spontaneous incidence of this tumor is reported to be less than 0.5% in over 1300 animals while in Fxr-null mice, the incidence was 9% as mixed HCC [6]. Carcinogens were also reported to induce this type of tumor, but the incidence is very low compared with that found in the present study [7]. Although it was speculated that malignant hepatocytes have the potential for biliary differentiation [8], the pathogenesis of hepatocholangiocellular carcinoma is not well understood. However, it is of interest to note that old Fxr-null liver had proliferating oval cells. Oval cell proliferation normally occurs following severe, prolonged liver injury and is often seen in the preneoplastic stage in liver [9]. The elevated hepatic bile acids and the sustained chronic inflammation in the Fxr-null mice may have stimulated proliferation of hepatic progenitor cells/oval cells which later differentiate to hepatocytes or cholangiocytes, or they may induce undifferentiated stem cells to proliferate. Interestingly, hepatic fibrosis was observed in Fxr-null liver as shown by the heavy deposit of collagen thus indicating the involvement of activated hepatic stellate cells (HSCs), which produce extracellular matrix upon activation in liver fibrogenesis [10,11]. In addition to fibrogenesis, activated HSCs were suggested to induce tumor progression of neoplastic hepatocytes, and bile acids at cholestatic concentrations can induce HSCs proliferation via epidermal growth factor receptor [12]. Fibrogenesis in the Fxr-null liver can at least in part be attributed to the elevated hepatic bile acids, while a direct role for FXR in signaling in HSCs cannot be ruled out since FXR expression was detected in HSCs [13]. In the regard, investigations into whether FXR may be a potential therapeutic target for the treatment of cholestasis and fibrosis have gained interest [13–15].
Hepatocellular proliferation is a requirement for tumorigenesis. Indeed, livers of 3-month-old Fxr-null mice were found to be highly proliferative as revealed by increased PCNA expression and BrdU incorporation. The increased proliferation index was accompanied by an increase in mRNA and protein levels of the pro-oncogene c-myc in Fxr-null livers of both 3-month-old and 12-month-old mice. The parallel increase in the intact c-myc protein (~63 kDa, Figure 4B) and its degradation product (~41 kDa) [16] indicated that increased c-myc protein levels were due to an overall increase in c-myc protein not due to a different rate of degradation. To see if induction of c-myc is via β-catenin, β-catenin expression was analyzed. While expression levels of β-catenin mRNA were induced, its protein level did not show any detectable differences. This discrepancy may be attributed to post-transcriptional regulation of β-catenin.
A decrease in BrdU labeling index in the 12month-old Fxr-null mice was observed despite the higher serum bile acid levels. This may be due to the overall decrease in liver regenerative capacity by aging especially in the absence of tumors. Notably, a previous study revealed that treatment with the tumor promoter phenobarbital resulted in an initial increase in DNA labeling index but the labeling index did not further increase or returned to control levels after prolonged treatment of 4–8 weeks, while liver weights continued to increase during 5 weeks of treatment [17,18]. This implies that the BrdU labeling index may not be directly proportional to the duration of stimulation. Since the tumor regions of old Fxr-null livers were not examined, it remains a possibility that over time, the BrdU labeling index may have decreased despite continuous accumulation of hepatic bile acids via adaptive compensatory mechanisms. This possibility remains to be proven by further experimentation.
Unpublished data revealed that in urine of 12-month-old Fxr-null mice, bile acid levels were also mildly elevated consistent with a previous study done in young mice [2]. Interestingly, a Fxr-null mouse later diagnosed to carry an HCC showed remarkably higher urinary bile acid excretion among old Fxr-null mice. This suggests that elevated serum bile acids, especially in old mice, which correspond to increased urinary excretion, could be further enhanced by progression of hepatic disease.
The hepatocyte tunel positive index was increased about 10-fold in the 3-month-old Fxr-null liver compared to age-matched wild-type control while it was increased 3-fold in 12-month-old Fxr-null mouse liver compared to the same age control group. The Tunel index was significantly lowered in old-mice compared to young Fxr-null mice similar to the BrdU labeling index. Because the apoptotic bodies were not clearly seen in Tunel positive hepatocyte, the increased Tunel index in Fxr-null mice, especially in young mice probably represent not only apoptotic cell death but also other types of cell death [19].
The increased Tunel index in young Fxr-null mouse liver may in part explain the absence of obvious hepatomegaly in 3-month-old mice despite the higher proliferative activity. On the other hand, the contributions of apoptosis to tumorigenesis in the current study needs further examination because we cannot conclude that the increased Tunel index is indeed due to increased apoptosis although increase in both cell proliferation and cell death in early and later stages of hepatocarcinogenesis was reported in rat models and human livers [20]
Cytotoxic bile acid accumulation in liver of Fxr-null mice apparently contributed to the occurrence of toxic lesions and liver tumor. Bile acids function as intracellular signaling molecules in a variety of cells and change cellular functions such as proliferation, differentiation, secretion, and apoptosis [12,21–25], liver regeneration [26], and modulation of metabolic homeostasis [27].
Bile acids trigger proliferation of cholangiocyte, biliary epithelial cells in chronic cholestasis [28] and injure cholangiocytes in mice lacking canalicular phospholipid transporter due to the increased monomeric concentration of bile acids in the absence of phospholipids in bile [29,30]. The canalicular phospholipids transporter, MDR3 is positively regulated by FXR [31]. Combined with the elevated hepatic bile acids, the loss of adaptive regulation of phospholipids excretion in Fxr-null liver may have contributed to the mixed tumor, hepatocholangiocellular carcinoma formation in Fxr-null mice.
Interestingly, previous studies have shown that bile acids can increase IL-1β levels and elevated bile acid levels can induce hepatic inflammation [32]. While the expression of a large number of genes important for inflammation was measured, only IL-1β expression was increased significantly in Fxr-null mice. The specific increase in IL-1β mRNA observed in Fxr-null mice, may suggest a direct role for bile acid signaling in IL-1β regulation. Consistent with previous reports, IL-1β mRNA levels were elevated in young and old Fxr-null mice compared to age-matched wild-type controls. On the other hand, c-myc was suggested to mediate intestinal epithelial cell, IEC-6 cell, proliferation induced by bile acid treatment [25] and the activation of β-catenin was associated with promotion of tumor formation in intestine by bile acids [33,34].
It is also noteworthy that in a recent study mRNA and protein levels of IL-1β were induced by Myc activation in β cells and mediated angiogenesis induced by Myc activation [35]. Further studies are warranted to elucidate the underlying mechanism of c-myc induction and concomitant induction of IL-1β in Fxr-null mouse liver and their association with spontaneous hepatic tumor development in Fxr-null mice.
In conclusion, the present study proposes a mechanism where increased bile acid levels induce IL-1β. IL-1β is an important inflammatory signal that has been demonstrated to mediate cell proliferation, differentiation, and apoptosis [36]. Perhaps the alteration in these events mediated by IL-1β indirectly result in expression of β-catenin and c-myc, which eventually leads to tumorigenesis. While the mechanism for tumorigenesis in the Fxr-null mouse model remains to be defined, the causal relationship between inflammation and cancer has been well documented [37]. The present study identifies a novel role for FXR and hepatic bile acids as key mediators of inflammation-induced heptocarcinogenesis.
Supplementary Material
Figure 6.
Acknowledgments
This study was supported by the National Cancer Institute Intramural Research Program. We thank Reiko Kurotani for helpful suggestions.
References
- 1.Lee FY, Lee H, Hubbert ML, Edwards PA, Zhang Y. FXR, a multipurpose nuclear receptor. Trends Biochem Sci. 2006 doi: 10.1016/j.tibs.2006.08.002. [DOI] [PubMed] [Google Scholar]
- 2.Sinal CJ, Tohkin M, Miyata M, Ward JM, Lambert G, Gonzalez FJ. Targeted disruption of the nuclear receptor FXR/BAR impairs bile acid and lipid homeostasis. Cell. 2000;102:731–44. doi: 10.1016/s0092-8674(00)00062-3. [DOI] [PubMed] [Google Scholar]
- 3.Zhang Y, Lee FY, Barrera G, Lee H, Vales C, Gonzalez FJ, Willson TM, Edwards PA. Activation of the nuclear receptor FXR improves hyperglycemia and hyperlipidemia in diabetic mice. Proc Natl Acad Sci U S A. 2006;103:1006–11. doi: 10.1073/pnas.0506982103. [DOI] [PMC free article] [PubMed] [Google Scholar]
- 4.Cariou B, van Harmelen K, Duran-Sandoval D, van Dijk TH, Grefhorst A, Abdelkarim M, Caron S, Torpier G, Fruchart JC, Gonzalez FJ, Kuipers F, Staels B. The farnesoid X receptor modulates adiposity and peripheral insulin sensitivity in mice. J Biol Chem. 2006;281:11039–49. doi: 10.1074/jbc.M510258200. [DOI] [PubMed] [Google Scholar]
- 5.Ward JM, Goodman DG, Squire RA, Chu KC, Linhart MS. Neoplastic and nonneoplastic lesions in aging (C57BL/6N x C3H/HeN)F1 (B6C3F1) mice. J Natl Cancer Inst. 1979;63:849–54. doi: 10.1093/jnci/63.3.849. [DOI] [PubMed] [Google Scholar]
- 6.Haseman JK, Elwell MR, Hailey JR. Chapter 26, Neoplasm Incidences in B6C3F1 Mice: NTP Historical Data. Cache River Press; Vienna: 1999. [Google Scholar]
- 7.Frith CH, Ward JM, Turusov VS. Tumors of the liver. IARC Scientific Publications; Lyon: 1994. [PubMed] [Google Scholar]
- 8.Takahashi K, Viviano CJ, Elwell MR, Bakewell WE, Kuwahara M, Nakashima N, Blackwell BN, Maronpot RR. Bile duct-specific lectins, Dolichos biflorus agglutinin and peanut agglutinin, as probes in mouse hepatocarcinogenesis. Lab Invest. 1995;73:424–32. [PubMed] [Google Scholar]
- 9.Hsia CC, Evarts RP, Nakatsukasa H, Marsden ER, Thorgeirsson SS. Occurrence of oval-type cells in hepatitis B virus-associated human hepatocarcinogenesis. Hepatology. 1992;16:1327–33. doi: 10.1002/hep.1840160604. [DOI] [PubMed] [Google Scholar]
- 10.Reeves HL, Friedman SL. Activation of hepatic stellate cells--a key issue in liver fibrosis. Front Biosci. 2002;7:d808–26. doi: 10.2741/reeves. [DOI] [PubMed] [Google Scholar]
- 11.Mann DA, Smart DE. Transcriptional regulation of hepatic stellate cell activation. Gut. 2002;50:891–6. doi: 10.1136/gut.50.6.891. [DOI] [PMC free article] [PubMed] [Google Scholar]
- 12.Svegliati-Baroni G, Ridolfi F, Hannivoort R, Saccomanno S, Homan M, De Minicis S, Jansen PL, Candelaresi C, Benedetti A, Moshage H. Bile acids induce hepatic stellate cell proliferation via activation of the epidermal growth factor receptor. Gastroenterology. 2005;128:1042–1055. doi: 10.1053/j.gastro.2005.01.007. [DOI] [PubMed] [Google Scholar]
- 13.Fiorucci S, Rizzo G, Antonelli E, Renga B, Mencarelli A, Riccardi L, Orlandi S, Pruzanski M, Morelli A, Pellicciari R. A farnesoid x receptor-small heterodimer partner regulatory cascade modulates tissue metalloproteinase inhibitor-1 and matrix metalloprotease expression in hepatic stellate cells and promotes resolution of liver fibrosis. J Pharmaco Exp Ther. 2005;314:584–95. doi: 10.1124/jpet.105.084905. [DOI] [PubMed] [Google Scholar]
- 14.Liu Y, Binz J, Numerick MJ, Dennis S, Luo G, Desai B, MacKenzie KI, Mansfield TA, Kliewer SA, Goodwin B, Jones SA. Hepatoprotection by the farnesoid X receptor agonist GW4064 in rat models of intra- and extrahepatic cholestasis. J Clin Invest. 2003;112:1678–87. doi: 10.1172/JCI18945. [DOI] [PMC free article] [PubMed] [Google Scholar]
- 15.Fiorucci S, Antonelli E, Rizzo G, Renga B, Mencarelli A, Riccardi L, Orlandi S, Pellicciari R, Morelli A. The nuclear receptor SHP mediates inhibition of hepatic stellate cells by FXR and protects against liver fibrosis. Gastroenterology. 2004;127:1497–512. doi: 10.1053/j.gastro.2004.08.001. [DOI] [PubMed] [Google Scholar]
- 16.Miyamoto C, Chizzonite R, Crowl R, Rupprecht K, Kramer R, Schaber M, Kumar G, Poonian M, Ju G. Molecular cloning and regulated expression of the human c-myc gene in Escherichia coli and Saccharomyces cerevisiae: comparison of the protein products. Proc Natl Acad Sci U S A. 1985;82:7232–6. doi: 10.1073/pnas.82.21.7232. [DOI] [PMC free article] [PubMed] [Google Scholar]
- 17.Smith PF, O'Brien KA, Keenan KP. Evaluation of bromodeoxyuridine labeling in hepatomegaly produced by peroxisomal proliferation or P-450 induction in rodents. Prog Clin Biol Res. 1991;369:285–9. [PubMed] [Google Scholar]
- 18.Peraino C, Fry RJ, Staffeldt E. Reduction and enhancement by phenobarbital of hepatocarcinogenesis induced in the rat by 2-acetylaminofluorene. Cancer Res. 1971;31:1506–12. [PubMed] [Google Scholar]
- 19.Grasl-Kraupp B, Ruttkay-Nedecky B, Koudelka H, Bukowska K, Bursch W, Schulte-Hermann R. In situ detection of fragmented DNA (TUNEL assay) fails to discriminate among apoptosis, necrosis, and autolytic cell death: a cautionary note. Hepatology. 1995;21:1465–8. doi: 10.1002/hep.1840210534. [DOI] [PubMed] [Google Scholar]
- 20.Bursch W, Chabicovsky M, Wastl U, Grasl-Kraupp B, Bukowska K, Taper H, Schulte-Hermann R. Apoptosis in stages of mouse hepatocarcinogenesis: failure to counterbalance cell proliferation and to account for strain differences in tumor susceptibility. Toxicol Sci. 2005;85:515–29. doi: 10.1093/toxsci/kfi129. [DOI] [PubMed] [Google Scholar]
- 21.Alpini G, Glaser SS, Ueno Y, Rodgers R, Phinizy JL, Francis H, Baiocchi L, Holcomb LA, Caligiuri A, LeSage GD. Bile acid feeding induces cholangiocyte proliferation and secretion: evidence for bile acid-regulated ductal secretion. Gastroenterology. 1999;116:179–86. doi: 10.1016/s0016-5085(99)70242-8. [DOI] [PubMed] [Google Scholar]
- 22.Faubion WA, Guicciardi ME, Miyoshi H, Bronk SF, Roberts PJ, Svingen PA, Kaufmann SH, Gores GJ. Toxic bile salts induce rodent hepatocyte apoptosis via direct activation of Fas. J Clin Invest. 1999;103:137–45. doi: 10.1172/JCI4765. [DOI] [PMC free article] [PubMed] [Google Scholar]
- 23.Shiota G, Oyama K, Noguchi N, Takano T, Ito H, Kawasaki H. Oral administration of cholic acid promotes growth of liver tumors initiated by diethylnitrosamine in rats. Int J Oncol. 1999;15:259–65. doi: 10.3892/ijo.15.2.259. [DOI] [PubMed] [Google Scholar]
- 24.Alpini G, Baiocchi L, Glaser S, Ueno Y, Marzioni M, Francis H, Phinizy JL, Angelico M, Lesage G. Ursodeoxycholate and tauroursodeoxycholate inhibit cholangiocyte growth and secretion of BDL rats through activation of PKC alpha. Hepatology. 2002;35:1041–52. doi: 10.1053/jhep.2002.32712. [DOI] [PubMed] [Google Scholar]
- 25.Yamaguchi J, Toledo A, Bass BL, Celeste FA, Rao JN, Wang JY, Strauch ED. Taurodeoxycholate increases intestinal epithelial cell proliferation through c-myc expression. Surgery. 2004;135:215–21. doi: 10.1016/j.surg.2003.08.025. [DOI] [PubMed] [Google Scholar]
- 26.Huang W, Ma K, Zhang J, Qatanani M, Cuvillier J, Liu J, Dong B, Huang X, Moore DD. Nuclear receptor-dependent bile acid signaling is required for normal liver regeneration. Science. 2006;312:233–6. doi: 10.1126/science.1121435. [DOI] [PubMed] [Google Scholar]
- 27.Houten SM, Watanabe M, Auwerx J. Endocrine functions of bile acids. Embo J. 2006;25:1419–25. doi: 10.1038/sj.emboj.7601049. [DOI] [PMC free article] [PubMed] [Google Scholar]
- 28.Alpini G, Ueno Y, Glaser SS, Marzioni M, Phinizy JL, Francis H, Lesage G. Bile acid feeding increased proliferative activity and apical bile acid transporter expression in both small and large rat cholangiocytes. Hepatology. 2001;34:868–76. doi: 10.1053/jhep.2001.28884. [DOI] [PubMed] [Google Scholar]
- 29.Mauad TH, van Nieuwkerk CM, Dingemans KP, Smit JJ, Schinkel AH, Notenboom RG, van den Bergh Weerman MA, Verkruisen RP, Groen AK, Oude Elferink RP, et al. Mice with homozygous disruption of the mdr2 P-glycoprotein gene. A novel animal model for studies of nonsuppurative inflammatory cholangitis and hepatocarcinogenesis. Am J Pathol. 1994;145:1237–45. [PMC free article] [PubMed] [Google Scholar]
- 30.Elferink RP, Tytgat GN, Groen AK. Hepatic canalicular membrane 1: The role of mdr2 P-glycoprotein in hepatobiliary lipid transport. Faseb J. 1997;11:19–28. doi: 10.1096/fasebj.11.1.9034162. [DOI] [PubMed] [Google Scholar]
- 31.Huang L, Zhao A, Lew JL, Zhang T, Hrywna Y, Thompson JR, de Pedro N, Royo I, Blevins RA, Pelaez F, Wright SD, Cui J. Farnesoid X Receptor Activates Transcription of the Phospholipid Pump MDR3. J Biol Chem. 2003;278:51085–51090. doi: 10.1074/jbc.M308321200. [DOI] [PubMed] [Google Scholar]
- 32.Miyake JH, Wang SL, Davis RA. Bile acid induction of cytokine expression by macrophages correlates with repression of hepatic cholesterol 7alpha-hydroxylase. J Biol Chem. 2000;275:21805–8. doi: 10.1074/jbc.C000275200. [DOI] [PubMed] [Google Scholar]
- 33.Mahmoud NN, Dannenberg AJ, Bilinski RT, Mestre JR, Chadburn A, Churchill M, Martucci C, Bertagnolli MM. Administration of an unconjugated bile acid increases duodenal tumors in a murine model of familial adenomatous polyposis. Carcinogenesis. 1999;20:299–303. doi: 10.1093/carcin/20.2.299. [DOI] [PubMed] [Google Scholar]
- 34.Pai R, Tarnawski AS, Tran T. Deoxycholic Acid Activates {beta}-Catenin Signaling Pathway and Increases Colon Cell Cancer Growth and Invasiveness. Mol Biol Cell. 2004;15:2156–2163. doi: 10.1091/mbc.E03-12-0894. [DOI] [PMC free article] [PubMed] [Google Scholar]
- 35.Shchors K, Shchors E, Rostker F, Lawlor ER, Brown-Swigart L, Evan GI. The Myc-dependent angiogenic switch in tumors is mediated by interleukin 1beta. Genes Dev. 2006;20:2527–38. doi: 10.1101/gad.1455706. [DOI] [PMC free article] [PubMed] [Google Scholar]
- 36.Roy D, Sarkar S, Felty Q. Levels of IL-1 beta control stimulatory/inhibitory growth of cancer cells. Front Biosci. 2006;11:889–98. doi: 10.2741/1845. [DOI] [PubMed] [Google Scholar]
- 37.Karin M. NF-kappaB and cancer: mechanisms and targets. Mol Carcinog. 2006;45:355–61. doi: 10.1002/mc.20217. [DOI] [PubMed] [Google Scholar]
Associated Data
This section collects any data citations, data availability statements, or supplementary materials included in this article.