

Abstract
Genomes provide us with a blue print for the potential of a cell. However, the activity of a cell is expressed in its proteome. Full understanding of the complexity of cells demands a comprehensive view of the proteome; its interactions, activity states and organization. Comprehensive proteomic approaches applied to peroxisomes have yielded new insights into the organelle and its dynamic interplay with other cellular structures. As technologies and methodologies improve proteomics hold the promise for new discoveries of peroxisome function and a full description of this dynamic organelle.
Keywords: peroxisome, proteome, mass spectrometry, protein quantification, protein localization, in silico prediction
Introduction
Ideally, proteomics studies should provide a comprehensive list of the relevant protein players (in the system of focus), their abundance (in absolute terms), their activity states (reflected in post translational states and interactions) and a quantitative measure of their dynamic changes. Current technologies provide some foothold into reaching these goals, but much remains to be accomplished. New advances in mass spectrometry, in silico methodologies, and biochemical and reporter assays have led to large data sets of the proteins expressed in cells, their post translational states and their membership in organelles and complexes. Here we focus on the impact these methods have had on the fields of peroxisome biogenesis and function. Arguably, focusing on a dynamic, cellular subsystem like the peroxisome not only allows us to have a realistic goal of obtaining a comprehensive list of players, but it also allows us to develop methods to understand their dynamic interplay.
In silico proteomics
Experimental proteomics has become intertwined with computational approaches to both de-convolute data generated from mass spectrometry experiments, and to combine and analyze large scale datasets to make predictions regarding the potential nature of the proteome. For the peroxisome field, many of these studies make use of comparative genomics, the end result being a prediction regarding the potential status of a given protein as a peroxisomal protein. Cells utilize two known peptide signals, PTS1 (peroxisomal targeting signal 1) and PTS2, to localize proteins to the peroxisomal matrix (see chapter 3.1). PTS1 is a three amino acid, variable motif found at the extreme C-terminus of peroxisomal matrix proteins, that is generally described by the consensus sequence serine-lysine-leucine (SKL) [1]. Emmanuelsson and colleagues combined machine-learning techniques to do PTS1 domain-based cross-species comparisons across eight eukaryotic genomes [2]. The proteins that were selected were predicted to be neither secreted nor transmembrane proteins, and contained a variant of PTS1. An interesting aspect of this study was an analysis of the nine amino acids that immediately precede PTS1. This 9-mer was analysed by machine learning pattern recognition techniques to establish another criteria by which the authors could exclude false positives. Looking at genomes from yeast to humans under stringent criteria, the analysis generated a core of approximately 60 proteins that are predicted to be peroxisomal in most of the genomes. Using more relaxed criteria, their analysis yielded a data set of 277 putative peroxisomal proteins for Sacchromyces cerevisiae and 1,427 for humans. Clustering was then used to organize the data sets, and a clustering cutoff imposed to improve the accuracy of their predictions. In the end this groups’ analysis identified 21 of the known yeast peroxisomal matrix proteins and predicted 430 peroxisomal proteins over 8 different genomes, many of which lack localization annotations. The localizations of these unknown proteins remain to be demonstrated experimentally.
Schonbach’s group also utilized the presence of a PTS1 motifs to predict peroxisomal proteins [3]. A Genbank dataset of 177,765 mRNA transcripts was pared down to 241 candidates by a Fuzzpro search for C-terminally located (S/A)KL motifs. After removing redundant sequences and matching to Locuslink accession numbers, 85 candidates remained plus an additional 30 candidates that could not be matched by accession number. The 85 candidates were curated by Medline searches and both sets of candidates were curated by experts, resulting in the identification of 117 transcripts known to encode 21 different peroxisomal enzymes across the human, mouse, rat, and guinea pig genomes. They also identified 15 novel peroxisomal proteins. These genes included an alcohol dehydrogenase superfamily member that may function as an antioxidant, and a putative peptidase with protease-related domains. Interestingly, these studies identified Scarb1 as a putative peroxisomal protein. Scarb1 is thought to function in the uptake of high density lipoprotein lipid and is known to interact with Pex5 [4].
Groups studying peroxisomes in plants have also used the presence of peroxisomal targeting signals to predict peroxisomal components of the proteome. Nishimura’s group used the PTS1 or PTS2 to identify putative peroxisomal proteins in Arabidopsis thaliana. Using variants of the canonical PTSs they were able to identify 182 proteins with PTS1 motifs and 74 with PTS2 motifs [5]. These predictions were validated by expression arrays, revealing organ specific differentiation of peroxisomes. Similarly, Reumann used a scheme whereby all known PTS1 and PTS2 targeted peroxisomal matrix proteins were retrieved from protein databases of different plant species [6]. Within these data A. thaliana orthologues were identified and those orthologues with high sequence similarity to proteins known to have non-peroxisomal localizations were excluded. This set of proteins was used to query the nonredundant database and the database of expressed sequence tags (ESTs) at the NCBI. This analysis led to the defining of 9 major PTS1 tripeptides, all variants of the canonical SKL motif, and two major variants of the PTS2 motif that can be used to screen proteomes for peroxisomal matrix proteins. Again the sequences adjacent to the PTS peptides were found to contain conserved residues, in particular proline and basic amino acid residues that confer on overall net charge to the region, that are predictive for a protein with a PTS localizing to peroxisomes. This group went on to establish a database AraPerox (http://www.araperox.uni-goettingen.de/) with information on the subcellular targeting predictions, homology, and in silico expression analyses of putative peroxisomal proteins in A. thaliana [7]. Relying strictly on the presence of a consensus peroxisomal targeting signal as a predictor of peroxisomal localization has limitations. These signals can be masked by protein conformation, or multimer formation, or proteins could be subjected to post translational modification to inactivate, or remove the PTS. In addition, proteins that do not have an evident PTS can be imported into peroxisomes by other means, for example, by yet undiscovered PTSs, or by piggy-backing on other proteins recognized by the peroxisomal targeting and import apparatus.
Such in silico predictions, stemming from sequenced genomes can extend beyond inventories of the organelle. In the case of Pujol’s group they used the proteomes and sequenced genomes of different organisms to investigate the origin of the organelle[8]. By comparison of the known peroxisomal proteomes from S. cerevisiae and humans, to the predicted proteomes based on the genomes of 19 different organisms, they established a high degree of similarity among membrane proteins and between components of the peroxisomal matrix import machinery and the secretory and proteasome systems. But these proteins had little similarity to bacteria or archea proteins. Based on the dictum that membranes arise from preexisting membranes, they concluded that these results do not support an endosymbiotic origin for the peroxisome. Rather, peroxisomes likely arise from internal membrane systems. Moreover, the authors present a phylogenetic tree in which a set of peroxins (Pex2p, Pex10p, Pex12p, Pex3p, Pex19p, Pex16p and Pex11p) appear to be sufficient to predict the presence of peroxisomes throughout the eukaryotic kingdom, with Pex3p, Pex19p, Pex10p and Pex12p representing a core of required proteins. By contrast, peroxisomal proteins that have overall homology to bacteria or archae or to proteins from organisms lacking peroxisomes such as Encephalitozoon cuniculi or Giardia lamblia, are likely usurped from other roles and are not good indicators of the presence of the organelle. Thus, by these criteria, while classically defined as an organelle containing enymes such as oxidases and catalases that catalyze the production and breakdown of hydrogen peroxide, perhaps it is time for a new definition of what constitutes a peroxisome.
High throughput localization studies
While no high throughput localization studies have been done that focus specifically on the peroxisomal proteome, the entire S. cerevisiae proteome has been interrogated via two genome-wide subcellular localization studies. The first study, by Kumar et al., was done by indirect immunofluorescence [9]. These studies made use of not only traditional plasmid-based tagging of 2,085 S. cerevisiae PCR amplified open reading frames (ORFs), but also employed random tagging of ORFs by transposon mutagenesis. In the latter approach, bacterial transposons were modified to carry a reporter, allowing for the selection of in-frame insertions. A search of the associated TRIPLES database, (http://ygac.med.yale.edu/triples/triples.htm) yields information on four peroxins (Pex1p, Pex5p, Pex8p, and Pex11p).
The second genome wide study was done by O’Shea’s group in which the genome was systematically tagged, one gene at a time, with green fluorescent protein (GFP) [10]. One obvious advantage of this approach is the assessment of the yeast proteome under live cell conditions. A search of the database (http://yeastgfp.ucsf.edu) that accompanies this study identifies 21 proteins with peroxisomal localization. This number is remarkable given that the cells were grown in glucose, a condition which does not induce peroxisome proliferation. Additionally, the GFP tags were integrated at the C-termini of the genes, so the C-terminally located PTS1 would not be available as a targeting signal, and as a result most of the peroxisomal matrix proteins were not detected. PTS2 bearing proteins Gpd1p and Ant1p were localized to the peroxisome by this method.
Peroxisomes are intimately involved in the metabolism, most notably the βoxidation of fatty acids. Natter et al [11] focused on a subset of the yeast proteome whereby 493 predicted lipid metabolism proteins, based on their annotation in the yeast databases, were tagged at their C-termini with GFP. Of the 29 proteins annotated in SGD as being peroxisomal matrix proteins, five were localized to peroxisomes. Interestingly, four of those proteins lack a PTS2, and, assuming the C-terminal position of GFP blocked putative PTS1 sequences, these localize to the peroxisome in a PTS1/PTS2 independent manner. In total, 17 known yeast peroxisomal proteins were localized to peroxisomes.
The localization data produced by both the O’Shea and Kohlwein groups localized many peroxisomal proteins (17 of 25) and a few of the peroxisomal matrix proteins (7 of 29) to peroxisomes. The paucity of peroxisomal proteins could be addressed by the generation of a localization dataset in which the genes are tagged N-terminally, to expose PTS1 signals, and the cells grown in a condition that will stimulate peroxisome induction, to increase chances of identification. For example Rho1p is a well characterized protein involved in the establishment of cell polarity and reorganization of the actin cytoskeleton (for a review see [12]). Careful examination of Rho1p under peroxisome inducing conditions showed localization of Rho1p to peroxisomes (see Figure 1) – a feature not revealed by genome-wide screens. A large scale analysis under conditions that induce peroxisomes holds promise of identifying many more peroxisomal proteins and yielding a more comprehensive picture of the yeast peroxisomal proteome.
Figure 1.
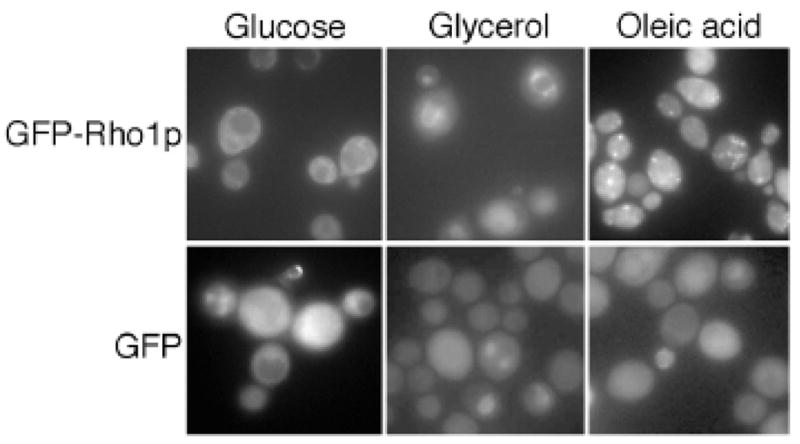
GFP fluorescent localization of Rho1p is altered in three different carbon sources. In glucose grown S. cerevisiae cells, Rho1p appears to be cytoplasmic, in glycerol there is GFP signal in what appears to be the endoplasmic reticulum. In oleic acid, a condition which induces peroxisomes, Rho1p localizes to subcellular foci, which co-localize with peroxisomes. Figure taken from [45].
Interactome Studies
High throughput interaction studies have the potential to identify new interactions between peroxisomal proteins and by association, new potential functions and functional relationships. The two most comprehensive experimental approaches have been the use of global systematic, mass spectrometry (MS) analyses of immunoisolated protein complexes, and global two hybrid studies.
Comprehensive MS studies by Gavin et al and Ho et al revealed numerous components of the yeast interactome. The S. cerevisiae strains used by Gavin et al in their MS studies were generated by genomically integrating a cassette that contained two epitope tags, the tandem affinity purification (TAP) tags. This allowed for an initial isolation of tagged proteins using one tag, wash and release, then a second isolation using the other tag. The TAP protein assemblies were then identified by MS. Through this method, Gavin et al identified 1,440 distinct proteins in 232 protein complexes[13], while in a later study Gavin et al, were able to repeatedly identify 491 complexes, of which 275 novel [14]. In the Gavin et al papers, there is an under representation of peroxisomal proteins. This is understandable since peroxisomes are dynamic organelles, and these experiments were done under conditions in which peroxisomal genes are known to be repressed [15].
By using a different approach Ho et al [16], were able to bypass the expression problem associated with peroxisomal proteins. This group chose a set of 725 bait proteins, representing numerous functional classes such as signaling molecules and DNA repair proteins. These proteins were overexpressed by means of a GAL1 or tet promoter, and immunopurified via the plasmid encoded FLAG tag. Rather than tandem affinity purifications, these purifications were done a single step. The proteins were run on gels, the bands cut out, and the co-precipitating proteins identified by MS. Once nonspecific proteins were removed from the data sets, 3,617 interactions involving 1,578 different proteins were identified from a core of 493 bait proteins. The 1,578 interacting proteins represent 25% of the yeast proteome. At least six different peroxisomal proteins are present in these data, though the functional relevance of many of these interactions is unclear.
Large potential interaction maps have also been generated by two hybrid studies. The two hybrid method also bypasses the problem of a lack of expression of peroxisomal proteins in non-peroxisome proliferating conditions. Two hybrid studies done by Uetz et al yield 957 potential interactions between 1,004 proteins [17] while Ito et al, also used the same approach to identify 4,549 putative interactions between 3,278 proteins in S. cerevisiae [18]. Both these studies detected numerous interactions between peroxisomal proteins and other proteins. Ito et al detect interactions with at least 19 different peroxisomal proteins, though many of the interactions are difficult to understand in light of our current knowledge. The interactions detected by Uetz et al do correspond with many known peroxisomal interactions. A search of the word “pex” in the ‘Pathcalling Yeast Interaction’ database (http://portal.curagen.com), yields 9 peroxisomal proteins, with numerous interactions. For example Pex14p, which has two Pex5p and one Pex7p interacting domains [19], is involved in the import of proteins into the peroxisomal matrix and has six interactions which include both Pex5p and Pex7p. Pex5p in turn has four interactions and Pex7p has five interactions, including Pex14p. Conversely a matrix enzyme such as Pot1p appears to be a network “dead end”, connected only to Pex7p. While interesting, there are a number of known interactions that are not detected.
Of course, a constant problem with high throughput studies is the validation of the data. While the studies by both Gavin et al and Ho et al were able to validate numerous interactions, there were nonspecific interactions and failure to detect some known interactions [20]. Still one should not trivialize the value of these high throughput interaction studies. Granted in both the TAP and two hybrid studies a false negative is a missed interaction, but with respect to the two hybrid studies, once the auto-activating constructs have been removed from the data, the question of what exactly a false positive is becomes more philosophical. If two proteins are annotated as belonging to different cellular compartments does it mean there is no possibility for interaction? Perhaps these data can be viewed as a framework for interactions that have yet to be uncovered by other means.
A focused interaction matrix of 12 human peroxins (Pex2, 3, 5, 7, 10, 11α , 11β , 12, 13, 14, 16, and 19) was done by Fransen et al in both yeast two hybrid and bacterial two hybrid systems [21]. While complementary, each assay yielded results unique to that system. For example in the yeast two hybrid system, Pex5p and Pex19p, when fused to the binding domain, auto-activated the reporter, while known interactions between Pex7p-Pex5p, Pex12p-Pex5p,10p, and Pex14p-Pex14,19p were not identified [22]. In contrast, in the bacterial system, neither Pex5p nor Pex19p displayed this self activation while interactions could be detected between Pex14p-Pex14p, and Pex14p-Pex19p. Consistent between the two systems were interactions between Pex5p and Pex14p, and between Pex19p and Pex3p and Pex11β p, results that are in good agreement with previously published studies [23–32]. Interestingly this group also found that the use of fragments of Pex12p, Pex13p, and Pex14p yielded an additional 6 interactions in yeast and two interactions in the bacterial system. While these interactions may be artifacts, they may also result from the uncovering of an interaction motif. The interaction matrix done by Fransen et al is a nice approach to the problem of mapping interactions in the peroxisomal proteome. A focused two hybrid study of this nature of all the known peroxisomal proteins would be of great interest to the peroxisome community. An interaction map of yeast peroxisomal proteins would be a matrix of substantial size and would likely yield novel interactions.
Mass Spectometry
Mass spectrometry (MS) based proteomic approaches have been combined with a repertoire of techniques that can be used to improve the coverage of the peroxisomal proteome. These include different strategies to separate the proteins in a fraction (one and two dimensional gel electrophoresis, liquid chromatography), different ways to operate the mass spectrometer (single range, gas phase fractionation), and different methods of quantification (spot intensity, chemical labeling). Kikuchi et al used one dimensional gel electrophoresis to separate the proteins in a fraction of peroxisomal membranes from rat liver [33]. The membrane proteins were resolved by electrophoresis in a single dimension (size separation) and the lanes of each gel were cut into 64 evenly sized pieces. The proteins were trypsin digested, and the digested peptides were identified by liquid chromatography (LC) coupled tandem mass spectrometry (MS/MS) using data dependant peptide selection. Data dependant ion selection is a method which allows for computer controlled selection of ions with specific characteristics for collision induced dissociation (CID). For example, ions can be selected based on their intensity or m/z ratio. CID is a process in which peptide ions are accelerated by a high energy potential and fragmented by collision with an inert gas. CID in an integral part of MS/MS, a technique where in the first MS, a peptide ion with a specific m/z ratio is selected for CID, and fragmented. This MS/MS spectrum can be used by sequence database search algorithms to identify the sequence of the parent ion. Through the use of these MS techniques, Kikuchi et al identified a Lon protease, along with other proteins, in a peroxisomal fraction and showed by immunofluorescence microscopy that this protein is peroxisomal. Though comparatively low in coverage of the peroxisomal proteome, these experiments are excellent examples of the power of MS analysis to reveal new components of peroxisomal membrane.
Kikuchi et al also found that immunopurification of the membranes eliminated the majority of contamination from both the mitochondria and the endoplasmic reticulum (ER). The authors argue that, based on the decreased detection of several mitochondrial and cytoplasmic proteins after immunopurification, the peroxisomal membrane fraction is free of contaminants. The remaining proteins that have been previously annotated as belonging to the ER and mitochondrial may represent bona fide constituents of the peroxisome. For example the P450 cytochromes, which are major constituents of the ER, were not identified in the immunoisolated membranes while aldehyde dehydrogenase, another ER protein, was identified and may be a peroxisomal protein. Previous work done by immunoblotting, though inconclusive, also lends support to the idea that aldehyde dehydrogenase is a peroxisomal protein [34].
The earliest high throughput characterization of the yeast peroxisomal membrane proteome was also done by one-dimensional (1D) electrophoresis, cutting out bands on a gel, and identifying peptides by MS [35]. Cultures of S. cerevisiae were induced in oleate containing media and peroxisomes were isolated by differential centrifugation. An osmotic lysis was done to extract the peroxisomal membranes, reducing the quantity of peroxisomal matrix proteins that could mask the identification of the lower abundance proteins in the membrane. The extracted membranes were then resolved by 1D gel electrophoresis, and bands excised. The gel slices were processed and the peptides either applied to a matrix assisted laser desorption (MALDI) target or separated by liquid chromatography (LC) and ionized by electrospray ionization (ESI), then identified by MS. Using these techniques Schafer et al identified 30 peroxisomal proteins including all known peroxisomal integral membrane proteins, and most known peripheral membrane proteins. A group of 15 mitochondrial and cytoplasmic proteins were also identified. While mitochondrial proteins are common contaminants in peroxisomal fractions, both the cytoplasmic and mitochondrial proteins may have uncharacterized and perhaps dynamic peroxisomal association.
An enhancement to 1D electrophoresis is the use of a second dimension: two-dimensional (2D) electrophoresis. In the first dimension proteins are resolved by isoelectric focusing (IEF) and then the proteins are size separated in the second dimension. There are potential problems with this approach, in particular when analyzing membrane proteins. Hydrophobic proteins, such as peroxisomal membrane proteins, are heterogeneous and can focus over a wide pI range. Additionally membrane proteins are frequently insoluble in the buffers used for IEF and may precipitate. Despite some limitations, 2D electrophoresis has been used successfully for both mammalian and plant studies of peroxisomes [36, 37]. When Islinger et al [37] used 2D electrophoresis to study peroxisomal proteins from rat liver, they used a modified approach to enhance their ability to resolve and identify peroxisomal membrane proteins. Rather than using the traditional isoelectric focusing in the first dimension, Islinger et al used benzyldimethyl-n-hexadecylammoniumchloride (16-BAC) to separate proteins in the first dimension. Membrane proteins have increase solubility in 16-BAC, preventing precipitation and enhancing identification. Fifty of the most prominent spots on the gel were selected for identification by MALDI-TOF (time of flight) MS and from these, 17 proteins were identified. Again this group found that their enrichment excluded the P450 cytochromes but included aldehyde dehydrogenase and microsomal glutathione-S-transferase (mGST). They then demonstrated by subcellular fractionation, immunoelectron microscopy, and fluorescent colocalization, that mGST is a bona fide component of peroxisomes.
2D electrophoresis coupled with MS has also been used to characterize the proteome of Arabidopsis thaliana peroxisomes. Fukao et al [36] employed a unique method to isolate peroxisomes from cotyledons (the first leaves that appear from the germinating seed). The ability to purify sufficient a quantity and quality of peroxisomes had been a major barrier to the characterization of A. thaliana peroxisomes. By growing the cotyledons in dark for five days, then switching their growth to light for four days, glyoxysomes are completely converted to peroxisomes [38], allowing for the purification of a larger quantity and quality of peroxisomes. The purified peroxisomal fractions were resolved by 2D electrophoresis using IEF in the first dimension and size separation in the second dimension. After in-gel trypsin digestion, the proteins were identified by MALDI-TOF MS. In total, these analyses lead to the identification of 29 proteins. These included PTS1 containing proteins of the glycolate pathway, H2O2 scavenging pathway, and several uncharacterized proteins. Twelve proteins were identified without PTS1 or PTS1-like localization signals; one of these was ubiquitin. This is interesting in light of ubiquitin activity at the peroxisomes of the yeast S. cerevisiae where Pex4p and Pex10p mediate import to the peroxisome via a ubiquitin mediated mechanism [39]. Pex5p, which is the peroxisomal import receptor for PTS1 signals, has also been shown to be monoubiquintated [40, 41]. A similar approach was then used by the same group to characterize the proteome of glyoxysomes in A. thaliana [42].
Quite a different type of mass spectrometric analyses was done by Yi et al to study the peroxisome proteome in S. cerevisiae [43]. In these experiments, the isolated peroxisomal proteins were not first resolved by gel electrophoresis but rather, the proteins were digested, separated by liquid chromatography, and ionized by electrospray ionization before mass spectrometry (μ LC-ESI-MS/MS). Two additional features of these experiments were the use of data dependent ion selection, similar to Schafer et al [35], and the use of variable range gas phase fractionation (GPF). GPF is the use of iterative mass spectrometric analysis of a given sample over multiple, narrow mass to charge ratios rather than analyzing a sample over a single large range. The rationale behind this approach is that by focusing on narrow mass ranges, the MS has more time to sample peptides within this mass range during and ESI-MS/MS analysis. During ESI-MS/MS peptides are continuously eluting off of a reverse column and being sampled in real time by the mass spectrometer. Because the MS is typically programmed to select the most abundant ions for CID, GPF should permit the selection of less abundant ions within the defined mass range for CID. GPF has been shown to increase the number of protein identifications by increasing the number of distinct peptides identified. However, the use of GPF may result in a decrease in the number of times a specific peptide is identified. When these techniques were applied to the analysis of peroxisomal membranes, they proved to have a high identification yield. Yi et al identified 181 proteins, which included 46 known peroxisomal proteins. While sensitive enough to identify proteins with bipartite localizations, low abundance proteins, and proteins that only transiently associate with the peroxisome (for example Pex5p, which fits all three of these criteria), there was no quantification of relative protein amounts. With over 50% of the proteins identified by this technique previously annotated in the Sacchromyces cerevisiae Genome Database (SGD) as components of non-peroxisomal compartments, the issue of contamination from other organelles remained a significant shortcoming.
Quantification
When DeDuve initially began work on subcellular fractionation by centrifugation, it became readily apparent that absolute purification was a significant challenge. Instead one could enrich for an organelle and monitor this enrichment using marker enzymes. Co-purification of new proteins based on these markers then became a test for organellar localization of the proteins. As we continue subfractionating and analyzing fraction constituents, problems arise when annotating proteins with multiple localizations. In particular when samples are analyzed by MS it is problematic to differentiate those proteins that are low abundance contaminants from those proteins which have enriched specifically with a given fraction. The chemical characteristics of a peptide dictate, to a large extent, the detection of the peptide. MS is inherently poorly quantitative so methods have evolved to aid in the quantification of peptides in MS experiments.
Relative protein quantities can be determined before MS analysis. In both 1D and 2D gel electrophoresis, the gels can be stained and the intensity of the stain quantified by imaging and quantification software. Kikuchi et al [33] used both gel analysis and sequence coverage by MS to calculate relative protein amounts in their analysis of the proteome of rat liver peroxisomes. Sequence coverage, where gels are bypassed, counts both the number of different peptides from a protein and the number of times those peptides were identified, which can be used to generate an estimate of relative protein amounts. A similar quantification method exploits the use of spectral counts, where the intensity of the spectra is used to estimate quantities. As the mass spectra are acquired, they can be plotted over time and a curve drawn at the spectral peaks. The area under this curve is linearly related to the peptide amount [44]. The relative quantities of proteins in the organelle fraction are compared to a control fraction, such as a total cell lysate or a fraction enriched for a different cell compartment.
A third method to study relative protein quantities is the use of chemical labeling of peptides and comparison of different fractions. This was the method used by Marelli et al in their analysis of the peroxisomal proteome in S. cerevisiae [45]. The chemical labeling in these experiments was done using isotope-coded affinity tagging (ICAT). ICAT is a technique wherein two fractions can be differentiated by labeling the proteins in each, with chemically identical but isotopically different tags, allowing for the direct comparison of peptide pairs from differentially labeled fractions. The ICAT labeled fractions can then be purified by chromatography [46]. One of the advantages of ICAT is that the reagents are cysteine reactive, thus sample complexity is reduced by only having cysteine containing peptides in the MS analysis. Two different strategies were employed to optimize the correct identification of peroxisomal components. In the first approach (ICAT I), peroxisomes were compared to mitochondria. Both organelles were isolated from oleate induced cells by differential centrifugation and lysed. The membrane enriched fractions were then collected, differentially labeled using ICAT reagents, and analyzed by MS. In the second approach (ICAT II), only peroxisomes were isolated, but this time from a strain in which the peroxisomal membrane protein Pex11p had been tagged with protein A (Pex11pA). Again the organelles were lysed and membrane enriched fractions collected by centrifugation. The Pex11pA containing membranes were immunoisolated by chromatography on an IgG resin. The immunoisolated membranes were then compared to a peroxisomal membrane fraction using ICAT labeling and MS.
When the data from both ICAT experiments were analyzed, the results of the two different analyses were found to be complementary. ICAT I was of course better at identifying those proteins that are likely to be mitochondrial contaminants, but was unable to differentiate contaminants from proteins with bipartite localizations to both peroxisomes and mitochondria. This could be determined by comparison to the ICAT II data set. Those true bipartite proteins would be enriched in the affinity purified peroxisomal fraction. The increase in complexity of the protein mix that arises from the mixing of mitochondrial and peroxisomal membrane fractions also concomitantly decreased the number of proteins identified in the mass spectrometer in ICAT I. ICAT II was superior in this respect, as more peroxisomal proteins were identified in this less complex sample. One weakness of ICAT II is the potential for over representation of abundant proteins or nonspecific binding of proteins to the chromatography resin. However both these issues can be resolved by comparison to ICAT I.
A critical component to this study was the unbiased way in which the data were analyzed. For each protein the probability of enrichment in the peroxisomal membrane fraction was calculated. These calculations were based on the distributions of proteins that were previously known to be peroxisomal but were not modified to account for proteins that would normally be regarded as contaminants due to annotation to another cellular compartment. This allowed for the inclusion of proteins that may function in or at the peroxisome as well as at another location. It was through this type of mathematical modeling that several proteins with functions seemingly unrelated to peroxisomes, were predicted to also be components of peroxisomal function. These proteins were selected for further study and shown to be peroxisomal by both subcellular fractionation and Western blotting, and also by subcellular localization under peroxisome inducing conditions. Rho1p, a component of the secretory pathway, was shown to be recruited to peroxisomes during peroxisome induction and interact with Pex25p, regulating the state of actin assembly at the peroxisome. This is an excellent example of the power of proteomic analysis to provide an opportunity to learn new biology, in particular of proteins with multiple roles and dynamic localizations.
The use of chemical tagging approaches such as ICAT is a significant advancement in the ability to differentiate bona fide peroxisomal components from ever present mitochondrial and ER contaminants [47]. Since fractionation does not purify but rather enriches for a given organelle, it is critical to be able to resolve which peaks are enriching peptides and which are low abundance contaminants. The decision as to whether any given protein may be a peroxisomal component is confounded by the realization that many of these proteins are indeed part of the proteomes of more than one organelle. The combination of different labeling schemes that we employed in our analyses (mitochondria versus peroxisomes, then peroxisomes versus affinity-purified peroxisomal membranes) is also an important consideration in these types of experiments. A variant of ICAT, the isobaric Tag for Relative and Absolute Quantitation (iTRAQ), has great potential for this type of analysis. Where ICAT is cysteine reactive, iTRAQ is amine reactive. iTRAQ has not been applied to peroxisomal MS analyses but has been used for numerous other analyses from E. coli [48] to human fibroblasts [49]. Four different tags, of mass 114, 115, 116, 117 Da, are used to generate specific reporter ions when fragmented. Thus iTRAQ allows for four-plex analysis, compared with the duplex comparison that can be done with ICAT. The use of complementary data sets provides more parameters, aiding in the mathematical modeling of the data. This allows for greater confidence when annotating a peptide as peroxisomal or otherwise.
Dynamics
Peroxisomes are dynamic organelles whose components are differentially regulated in response to environmental stimuli [15, 50]. One way in which the dynamic peroxisomal proteome can be interrogated is by the use of metabolic labeling. This technique was first developed in the late nineties by several groups who used 15N labeling to do quantitative proteomics [44, 51]. A culture grown in isotope is “heavy”, with respect to a given isotope, and can be quantitatively compared to a “light” or normal culture. In this case every amino acid in the heavy culture is labeled and if the heavy/light pairs can be detected by the mass spectrometer, they can be quantified. This technique has since evolved into stable isotope labeling by amino acids in cell culture (SILAC). As the name implies, heavy (13C, 15N) amino acids such as L-lysine are provided to growing cultures in the media. This amino acid then becomes incorporated throughout the bulk of the proteome.
The main advantage of metabolic labeling over chemical labeling techniques such as ICAT or iTRAQ is the incorporation of the tag into living cells. Because the cells are differentially labeled before harvesting, the two different cell populations can be mixed. By mixing the cells populations before lysis, subcellular fractionation, or purification of the peroxisomal membranes, the quantification will not be affected by these steps. While this technique has yet to be applied to peroxisomes, it has been successfully applied to the study of lipid rafts. Foster et al [52] compared HeLa cells treated with cholesterol-disrupting drugs to untreated cultures. One of these cultures was grown in the presence of deuterium-labeled leucine while the other was not. The extracts from each culture were quantified by Coomassie blue stain and equal amounts of lysate, with respect to protein content, were mixed together. The lipid rafts were isolated by differential centrifugation and the isolated lipid raft proteins identified by LC-MS/MS. From these analyses, a quantifiable depletion of 241 proteins was detected in response to the cholesterol-disrupting drugs. Since its development this type of metabolic labeling has been used to study dynamic changes in protein phosphorylation [53], RNA binding proteins [54], prostate cancer [55], and other processes. The application of SILAC promises to be a general method for identifying dynamic changes in complexes or organelles, in response to a perturbate or through a developmental process.
As we are yet to fully enumerate bona fide versus contaminating proteins of the peroxisome, an added twist on SILAC is I-DIRT, which is described as a general method for discriminating between contaminants and true components of a given fraction [56]. This protocol also utilizes the stable incorporation of isotopically heavy amino acids into two strains grown under identical conditions. The heavy, wild type strain is mixed with a strain encoding a tagged protein of interest at a 1:1 ratio and the cells are cryogenically lysed. The tagged protein can then be immunoisolated, along with co-isolating proteins. Proteins that were specifically associated with the protein of interest should only be isotopically light since they were associated before thawing while non-specific proteins that associate after cell lysis, during the procedure, will be both heavy and light. This approach was used to study the yeast DNA polymerase ε complex. Though numerous proteins were identified, only three proteins (Dpb2p, Dpb3p, and Dpb4p) were determined, by their isotopic ratios, to have been specifically interacting with Pol2p prior to mixing in a stable complex. This approach should be readily applicable to large complexes or organelles that can be isolated by affinity chromatography.
Bottlenecks and Solutions
While critical improvements have been made in sample purification, operation of the mass spectrometer, use of quantitative procedures, and the analysis of the material, problems remain. Differential purification is a major bottleneck in the analysis of peroxisomal proteomes. In S. cerevisiae, forty grams of cells will yield less than 100 μg of purified peroxisomes and the isolation process is labor intensive. From the time the cells are harvested to where the peroxisome fraction can be recovered takes the better part of a day. One has to wonder how many dynamic interactions are missed due the length of time subcellular fractionation takes. The capture of these dynamic interactions is one of the areas where significant improvement can be made. One of the challenges in this approach will be to detect, isolate, and quantify peroxisomal subpopulations. Rapid isolation procedures and/or crosslinking can be envisaged as methods to maximize our ability to maintain and isolate separate populations prior to quantitative MS.
Immunopurification of the peroxisome using different peroxisomal targets, in combination with differential centrifugation and free flow electrophoresis, also has the potential to reveal subpopulations of the organelle [57–59]. Free flow electrophoresis is not generally the method of choice to resolve most organelles, due to the pI similarities between the various cell components. However, Völkl and co-workers used antibodies directed against the cytoplasmic domain of the peroxisomal membrane protein PMP70; this had the net effect of altering the pI so that the antibody decorated organelles could be separated from the main peak of organelles. Using this technique, they were able to sort not only peroxisomes, but were later able to extend the technique to isolate subpopulations of peroxisomes.
The challenge at the MS level will be the relative quantification of all the proteins in the complex fractions. In a technique such as electrospray ionization, a complex fraction is ionized into the MS, which now has to identify individual peptides in what is a very complex mix of peptides. Techniques that reduce sample complexity will aid in the identification of proteins in the sample. Both Yi and Marelli used reverse phase liquid chromatography to simplify complex mixtures of peptides. Reverse phase matrices are resins that are commonly used to separate peptides on the basis of hydrophobicity. Link et al [60] modified this procedure by integrating a second liquid chromatography step. Thus two dimensional liquid chromatography or multidimensional protein identification technology (MudPIT) was born. This protocol makes use to two different columns to provide even greater separation of peptides. The complex fraction of peptides is first bound on a strong cation exchange (SCX) column then serially eluted using increasing salt concentrations. The proteins eluted from the SCX column are then immobilized on a reverse phase column, the salts washed away and the peptides eluted using increasing concentrations of organic solvents. The now greatly simplified peptides fractions can be analyzed directly by MS/MS.
Post translational modifications are an important component to the understanding of proteomes. Studies have been done looking at many different types of modifications including glycosylation [61–63], sumoylation [64–67], and phosphorylation [68–70], both on small and global scales, in numerous organisms. When characterizing the proteome of S. cerevisiae peroxisome membranes, Shafer et al were able to identify, by MS, the phosphorylation site in the peroxisomal matrix protein Faa2p (long chain fatty acid CoA ligase 2), raising the possibility that this protein is regulated via phosphorylation events [35].
Perhaps the single biggest bottleneck in the whole of peroxisomal proteomics, and for that matter any global analysis is data validation. Most of the mass spectrometry papers that we have discussed attempt to validate at least some of those proteins predicted to be peroxisomal. It would be nice to see validation of these data sets in terms of functionality. While not exactly high throughput, Kunau’s group did an elegant characterization of peroxisomal protein import complexes and their major components, finding that Pex8p is a central component of both a Pex14p-Pex17p-Pex13p and a Pex2-Pex10p-Pex12p protein import complexes [71]. These types of experiments will be increasingly important as we acquire more data that require both validation and contextualization.
Part of validation and contextualization will be the integration of both multiple datasets and other data types. By incorporating microarray expression analyses, metabolite interactions, physical interaction data from multiple sources and localization data, we hope to develop a more complete picture of the network that forms the peroxisomal proteome (Figure 2).
Figure 2.
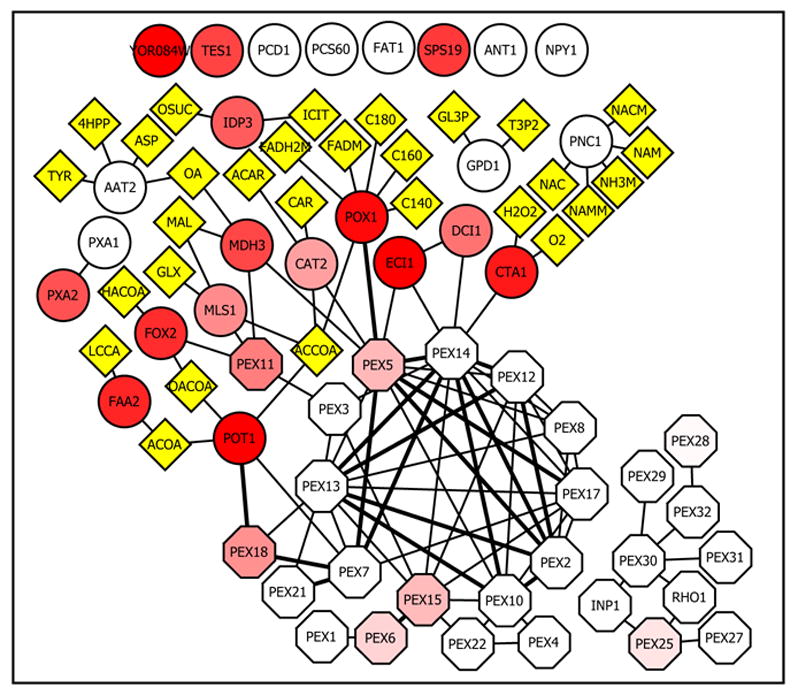
- 4HPP: 3-(4-Hydroxyphenyl) pyruvate
- ACAR: O-Acetylcarnitine
- ACCOA: Acetyl-CoA
- ACOA: Acyl-CoA
- ASP: L-Aspartate
- C140: Myristate
- C160: Palmitate
- C180: Stearate
- CAR: Carnitine
- FADH2M: reduced flavin adenine dinucleotide mitochondrial FADM: oxidized flavin adenine dinucleotide mitochondrial
- GL3P: Glycerol 3-Phosphate
- GLX: glyoxylate
- H2O2: Hydrogen Peroxide
- HACOA: (3S)-3-Hydroxyacyl-CoA
- ICIT: Isocitrate
- LCCA: Long Chain Carboxylic Acid
- MAL: Malate
- NAC: Nicotinate
- NACM: Nicotinate mitochondrial
- NAM: Nicotinamide
- NAMM: Nicotinamide mitochondrial
- NH3M: Ammonia mitochondrial
- OA: Oxaloacetate
- OACOA: 3-Oxoacyl-CoA
- OSUC: Oxalosuccinate
- T3P2: Glycerone Phosphate
- TYR: L-Tyrosine
Conclusions
Much progress has been made in recent years in this field. We have gone from a proteome map that was constructed by single, focused experiments, to a much more global picture of the peroxisome, in which the organelle is not viewed as an isolated entity but rather a fluid structure that interacts with, or at the very least shares, proteins with numerous other cell compartments, in particular the mitochondria and endoplasmic reticulum. Many of global analyses discussed herein appear to have an inherent under representation of peroxisomal proteins, indicative of a need on the part of the peroxisome community to work to not only adapt existing protocols to capture more of the peroxisomal proteome, but also develop new tools to allow for the analysis of the dynamic nature of the this proteome.
Footnotes
Publisher's Disclaimer: This is a PDF file of an unedited manuscript that has been accepted for publication. As a service to our customers we are providing this early version of the manuscript. The manuscript will undergo copyediting, typesetting, and review of the resulting proof before it is published in its final citable form. Please note that during the production process errors may be discovered which could affect the content, and all legal disclaimers that apply to the journal pertain.
References
- 1.Gould SG, Keller GA, Subramani S. Identification of a peroxisomal targeting signal at the carboxy terminus of firefly luciferase. J Cell Biol. 1987;105:2923–31. doi: 10.1083/jcb.105.6.2923. [DOI] [PMC free article] [PubMed] [Google Scholar]
- 2.Emanuelsson O, Elofsson A, von Heijne G, Cristobal S. In silico prediction of the peroxisomal proteome in fungi, plants and animals. J Mol Biol. 2003;330:443–56. doi: 10.1016/s0022-2836(03)00553-9. [DOI] [PubMed] [Google Scholar]
- 3.Kurochkin IV, Nagashima T, Konagaya A, Schonbach C. Sequence-based discovery of the human and rodent peroxisomal proteome. Appl Bioinformatics. 2005;4:93–104. doi: 10.2165/00822942-200504020-00003. [DOI] [PubMed] [Google Scholar]
- 4.Johnson MS, Johansson JM, Svensson PA, Aberg MA, Eriksson PS, Carlsson LM, Carlsson B. Interaction of scavenger receptor class B type I with peroxisomal targeting receptor Pex5p. Biochem Biophys Res Commun. 2003;312:1325–34. doi: 10.1016/j.bbrc.2003.11.076. [DOI] [PubMed] [Google Scholar]
- 5.Kamada T, Nito K, Hayashi H, Mano S, Hayashi M, Nishimura M. Functional differentiation of peroxisomes revealed by expression profiles of peroxisomal genes in Arabidopsis thaliana. Plant Cell Physiol. 2003;44:1275–89. doi: 10.1093/pcp/pcg173. [DOI] [PubMed] [Google Scholar]
- 6.Reumann S. Specification of the peroxisome targeting signals type 1 and type 2 of plant peroxisomes by bioinformatics analyses. Plant Physiol. 2004;135:783–800. doi: 10.1104/pp.103.035584. [DOI] [PMC free article] [PubMed] [Google Scholar]
- 7.Reumann S, Ma C, Lemke S, Babujee L. AraPerox. A database of putative Arabidopsis proteins from plant peroxisomes. Plant Physiol. 2004;136:2587–608. doi: 10.1104/pp.104.043695. [DOI] [PMC free article] [PubMed] [Google Scholar]
- 8.Schluter A, Fourcade S, Ripp R, Mandel JL, Poch O, Pujol A. The Evolutionary Origin of Peroxisomes: An ER-Peroxisome Connection. Mol Biol Evol. 2006;23:838–845. doi: 10.1093/molbev/msj103. [DOI] [PubMed] [Google Scholar]
- 9.Kumar A, Agarwal S, Heyman JA, Matson S, Heidtman M, Piccirillo S, Umansky L, Drawid A, Jansen R, Liu Y, Cheung KH, Miller P, Gerstein M, Roeder GS, Snyder M. Subcellular localization of the yeast proteome. Genes Dev. 2002;16:707–19. doi: 10.1101/gad.970902. [DOI] [PMC free article] [PubMed] [Google Scholar]
- 10.Huh WK, Falvo JV, Gerke LC, Carroll AS, Howson RW, Weissman JS, O'Shea EK. Global analysis of protein localization in budding yeast. Nature. 2003;425:686–91. doi: 10.1038/nature02026. [DOI] [PubMed] [Google Scholar]
- 11.Natter K, Leitner P, Faschinger A, Wolinski H, McCraith S, Fields S, Kohlwein SD. The spatial organization of lipid synthesis in the yeast Saccharomyces cerevisiae derived from large scale green fluorescent protein tagging and high resolution microscopy. Mol Cell Proteomics. 2005;4:662–72. doi: 10.1074/mcp.M400123-MCP200. [DOI] [PubMed] [Google Scholar]
- 12.Tanaka K, Takai Y. Control of reorganization of the actin cytoskeleton by Rho family small GTP-binding proteins in yeast. Curr Opin Cell Biol. 1998;10:112–6. doi: 10.1016/s0955-0674(98)80093-8. [DOI] [PubMed] [Google Scholar]
- 13.Gavin AC, Bosche M, Krause R, Grandi P, Marzioch M, Bauer A, Schultz J, Rick JM, Michon AM, Cruciat CM, Remor M, Hofert C, Schelder M, Brajenovic M, Ruffner H, Merino A, Klein K, Hudak M, Dickson D, Rudi T, Gnau V, Bauch A, Bastuck S, Huhse B, Leutwein C, Heurtier MA, Copley RR, Edelmann A, Querfurth E, Rybin V, Drewes G, Raida M, Bouwmeester T, Bork P, Seraphin B, Kuster B, Neubauer G, Superti-Furga G. Functional organization of the yeast proteome by systematic analysis of protein complexes. Nature. 2002;415:141–7. doi: 10.1038/415141a. [DOI] [PubMed] [Google Scholar]
- 14.Gavin AC, Aloy P, Grandi P, Krause R, Boesche M, Marzioch M, Rau C, Jensen LJ, Bastuck S, Dumpelfeld B, Edelmann A, Heurtier MA, Hoffman V, Hoefert C, Klein K, Hudak M, Michon AM, Schelder M, Schirle M, Remor M, Rudi T, Hooper S, Bauer A, Bouwmeester T, Casari G, Drewes G, Neubauer G, Rick JM, Kuster B, Bork P, Russell RB, Superti-Furga G. Proteome survey reveals modularity of the yeast cell machinery. Nature. 2006;440:631–6. doi: 10.1038/nature04532. [DOI] [PubMed] [Google Scholar]
- 15.Smith JJ, Marelli M, Christmas RH, Vizeacoumar FJ, Dilworth DJ, Ideker T, Galitski T, Dimitrov K, Rachubinski RA, Aitchison JD. Transcriptome profiling to identify genes involved in peroxisome assembly and function. J Cell Biol. 2002;158:259–71. doi: 10.1083/jcb.200204059. [DOI] [PMC free article] [PubMed] [Google Scholar]
- 16.Ho Y, Gruhler A, Heilbut A, Bader GD, Moore L, Adams SL, Millar A, Taylor P, Bennett K, Boutilier K, Yang L, Wolting C, Donaldson I, Schandorff S, Shewnarane J, Vo M, Taggart J, Goudreault M, Muskat B, Alfarano C, Dewar D, Lin Z, Michalickova K, Willems AR, Sassi H, Nielsen PA, Rasmussen KJ, Andersen JR, Johansen LE, Hansen LH, Jespersen H, Podtelejnikov A, Nielsen E, Crawford J, Poulsen V, Sorensen BD, Matthiesen J, Hendrickson RC, Gleeson F, Pawson T, Moran MF, Durocher D, Mann M, Hogue CW, Figeys D, Tyers M. Systematic identification of protein complexes in Saccharomyces cerevisiae by mass spectrometry. Nature. 2002;415:180–3. doi: 10.1038/415180a. [DOI] [PubMed] [Google Scholar]
- 17.Uetz P, Giot L, Cagney G, Mansfield TA, Judson RS, Knight JR, Lockshon D, Narayan V, Srinivasan M, Pochart P, Qureshi-Emili A, Li Y, Godwin B, Conover D, Kalbfleisch T, Vijayadamodar G, Yang M, Johnston M, Fields S, Rothberg JM. A comprehensive analysis of protein-protein interactions in Saccharomyces cerevisiae. Nature. 2000;403:623–7. doi: 10.1038/35001009. [DOI] [PubMed] [Google Scholar]
- 18.Ito T, Chiba T, Ozawa R, Yoshida M, Hattori M, Sakaki Y. A comprehensive two-hybrid analysis to explore the yeast protein interactome. Proc Natl Acad Sci U S A. 2001;98:4569–74. doi: 10.1073/pnas.061034498. [DOI] [PMC free article] [PubMed] [Google Scholar]
- 19.Niederhoff K, Meindl-Beinker NM, Kerssen D, Perband U, Schafer A, Schliebs W, Kunau WH. Yeast Pex14p possesses two functionally distinct Pex5p and one Pex7p binding sites. J Biol Chem. 2005;280:35571–8. doi: 10.1074/jbc.M502460200. [DOI] [PubMed] [Google Scholar]
- 20.Kumar A, Snyder M. Protein complexes take the bait. Nature. 2002;415:123–4. doi: 10.1038/415123a. [DOI] [PubMed] [Google Scholar]
- 21.Fransen M, Brees C, Ghys K, Amery L, Mannaerts GP, Ladant D, Van Veldhoven PP. Analysis of mammalian peroxin interactions using a non-transcription-based bacterial two-hybrid assay. Mol Cell Proteomics. 2002;1:243–52. doi: 10.1074/mcp.m100025-mcp200. [DOI] [PubMed] [Google Scholar]
- 22.Chang CC, Warren DS, Sacksteder KA, Gould SJ. PEX12 interacts with PEX5 and PEX10 and acts downstream of receptor docking in peroxisomal matrix protein import. J Cell Biol. 1999;147:761–74. doi: 10.1083/jcb.147.4.761. [DOI] [PMC free article] [PubMed] [Google Scholar]
- 23.Fang Y, Morrell JC, Jones JM, Gould SJ. PEX3 functions as a PEX19 docking factor in the import of class I peroxisomal membrane proteins. J Cell Biol. 2004;164:863–75. doi: 10.1083/jcb.200311131. [DOI] [PMC free article] [PubMed] [Google Scholar]
- 24.Hettema EH, Girzalsky W, van Den Berg M, Erdmann R, Distel B. Saccharomyces cerevisiae pex3p and pex19p are required for proper localization and stability of peroxisomal membrane proteins. Embo J. 2000;19:223–33. doi: 10.1093/emboj/19.2.223. [DOI] [PMC free article] [PubMed] [Google Scholar]
- 25.Hogenboom S, Wanders RJ, Waterham HR. Cholesterol biosynthesis is not defective in peroxisome biogenesis defective fibroblasts. Mol Genet Metab. 2003;80:290–5. doi: 10.1016/S1096-7192(03)00143-4. [DOI] [PubMed] [Google Scholar]
- 26.Muntau AC, Roscher AA, Kunau WH, Dodt G. Interaction of PEX3 and PEX19 visualized by fluorescence resonance energy transfer (FRET) Adv Exp Med Biol. 2003;544:221–4. doi: 10.1007/978-1-4419-9072-3_27. [DOI] [PubMed] [Google Scholar]
- 27.Muntau AC, Roscher AA, Kunau WH, Dodt G. The interaction between human PEX3 and PEX19 characterized by fluorescence resonance energy transfer (FRET) analysis. Eur J Cell Biol. 2003;82:333–42. doi: 10.1078/0171-9335-00325. [DOI] [PubMed] [Google Scholar]
- 28.Shibata H, Kashiwayama Y, Imanaka T, Kato H. Domain architecture and activity of human Pex19p, a chaperone-like protein for intracellular trafficking of peroxisomal membrane proteins. J Biol Chem. 2004;279:38486–94. doi: 10.1074/jbc.M402204200. [DOI] [PubMed] [Google Scholar]
- 29.Snyder WB, Faber KN, Wenzel TJ, Koller A, Luers GH, Rangell L, Keller GA, Subramani S. Pex19p interacts with Pex3p and Pex10p and is essential for peroxisome biogenesis in Pichia pastoris. Mol Biol Cell. 1999;10:1745–61. doi: 10.1091/mbc.10.6.1745. [DOI] [PMC free article] [PubMed] [Google Scholar]
- 30.Soukupova M, Sprenger C, Gorgas K, Kunau WH, Dodt G. Identification and characterization of the human peroxin PEX3. Eur J Cell Biol. 1999;78:357–74. doi: 10.1016/S0171-9335(99)80078-8. [DOI] [PubMed] [Google Scholar]
- 31.Suzuki Y, Shimozawa N, Imamura A, Fukuda S, Zhang Z, Orii T, Kondo N. Clinical, biochemical and genetic aspects and neuronal migration in peroxisome biogenesis disorders. J Inherit Metab Dis. 2001;24:151–65. doi: 10.1023/a:1010310816743. [DOI] [PubMed] [Google Scholar]
- 32.Tam YY, Fagarasanu A, Fagarasanu M, Rachubinski RA. Pex3p initiates the formation of a preperoxisomal compartment from a subdomain of the endoplasmic reticulum in Saccharomyces cerevisiae. J Biol Chem. 2005;280:34933–9. doi: 10.1074/jbc.M506208200. [DOI] [PubMed] [Google Scholar]
- 33.Kikuchi M, Hatano N, Yokota S, Shimozawa N, Imanaka T, Taniguchi H. Proteomic analysis of rat liver peroxisome: presence of peroxisome-specific isozyme of Lon protease. J Biol Chem. 2004;279:421–8. doi: 10.1074/jbc.M305623200. [DOI] [PubMed] [Google Scholar]
- 34.Miyauchi K, Yamamoto A, Masaki R, Fujiki Y, Tashiro Y. Microsomal aldehyde dehydrogenase or its cross-reacting protein exists in outer mitochondrial membranes and peroxisomal membranes in rat liver. Cell Struct Funct. 1993;18:427–36. doi: 10.1247/csf.18.427. [DOI] [PubMed] [Google Scholar]
- 35.Schafer H, Nau K, Sickmann A, Erdmann R, Meyer HE. Identification of peroxisomal membrane proteins of Saccharomyces cerevisiae by mass spectrometry. Electrophoresis. 2001;22:2955–68. doi: 10.1002/1522-2683(200108)22:14<2955::AID-ELPS2955>3.0.CO;2-U. [DOI] [PubMed] [Google Scholar]
- 36.Fukao Y, Hayashi M, Nishimura M. Proteomic analysis of leaf peroxisomal proteins in greening cotyledons of Arabidopsis thaliana. Plant Cell Physiol. 2002;43:689–96. doi: 10.1093/pcp/pcf101. [DOI] [PubMed] [Google Scholar]
- 37.Islinger M, Luers GH, Zischka H, Ueffing M, Volkl A. Insights into the membrane proteome of rat liver peroxisomes: microsomal glutathione-S-transferase is shared by both subcellular compartments. Proteomics. 2006;6:804–16. doi: 10.1002/pmic.200401347. [DOI] [PubMed] [Google Scholar]
- 38.Yamaguchi K, Takeuchi Y, Mori H, Nishimura M. Development of Microbody Membrane Proteins during the Transformation of Glyoxysomes to Leaf Peroxisomes in Pumpkin Cotyledons. Plant Cell Physiol. 1995;36:455–464. [Google Scholar]
- 39.Eckert JH, Johnsson N. Pex10p links the ubiquitin conjugating enzyme Pex4p to the protein import machinery of the peroxisome. J Cell Sci. 2003;116:3623–34. doi: 10.1242/jcs.00678. [DOI] [PubMed] [Google Scholar]
- 40.Kragt A, Voorn-Brouwer T, van den Berg M, Distel B. The Saccharomyces cerevisiae peroxisomal import receptor Pex5p is monoubiquitinated in wild type cells. J Biol Chem. 2005;280:7867–74. doi: 10.1074/jbc.M413553200. [DOI] [PubMed] [Google Scholar]
- 41.Platta HW, Girzalsky W, Erdmann R. Ubiquitination of the peroxisomal import receptor Pex5p. Biochem J. 2004;384:37–45. doi: 10.1042/BJ20040572. [DOI] [PMC free article] [PubMed] [Google Scholar]
- 42.Fukao Y, Hayashi M, Hara-Nishimura I, Nishimura M. Novel glyoxysomal protein kinase, GPK1, identified by proteomic analysis of glyoxysomes in etiolated cotyledons of Arabidopsis thaliana. Plant Cell Physiol. 2003;44:1002–12. doi: 10.1093/pcp/pcg145. [DOI] [PubMed] [Google Scholar]
- 43.Yi EC, Marelli M, Lee H, Purvine SO, Aebersold R, Aitchison JD, Goodlett DR. Approaching complete peroxisome characterization by gas-phase fractionation. Electrophoresis. 2002;23:3205–16. doi: 10.1002/1522-2683(200209)23:18<3205::AID-ELPS3205>3.0.CO;2-Y. [DOI] [PubMed] [Google Scholar]
- 44.Ong SE, Mann M. Mass spectrometry-based proteomics turns quantitative. Nat Chem Biol. 2005;1:252–62. doi: 10.1038/nchembio736. [DOI] [PubMed] [Google Scholar]
- 45.Marelli M, Smith JJ, Jung S, Yi E, Nesvizhskii AI, Christmas RH, Saleem RA, Tam YY, Fagarasanu A, Goodlett DR, Aebersold R, Rachubinski RA, Aitchison JD. Quantitative mass spectrometry reveals a role for the GTPase Rho1p in actin organization on the peroxisome membrane. J Cell Biol. 2004;167:1099–112. doi: 10.1083/jcb.200404119. [DOI] [PMC free article] [PubMed] [Google Scholar]
- 46.Ranish JA, Yi EC, Leslie DM, Purvine SO, Goodlett DR, Eng J, Aebersold R. The study of macromolecular complexes by quantitative proteomics. Nat Genet. 2003;33:349–55. doi: 10.1038/ng1101. [DOI] [PubMed] [Google Scholar]
- 47.Gygi SP, Rist B, Gerber SA, Turecek F, Gelb MH, Aebersold R. Quantitative analysis of complex protein mixtures using isotope-coded affinity tags. Nat Biotechnol. 1999;17:994–9. doi: 10.1038/13690. [DOI] [PubMed] [Google Scholar]
- 48.Choe LH, Aggarwal K, Franck Z, Lee KH. A comparison of the consistency of proteome quantitation using two-dimensional electrophoresis and shotgun isobaric tagging in Escherichia coli cells. Electrophoresis. 2005;26:2437–49. doi: 10.1002/elps.200410336. [DOI] [PubMed] [Google Scholar]
- 49.Cong YS, Fan E, Wang E. Simultaneous proteomic profiling of four different growth states of human fibroblasts, using amine-reactive isobaric tagging reagents and tandem mass spectrometry. Mech Ageing Dev. 2006;127:332–43. doi: 10.1016/j.mad.2005.12.005. [DOI] [PubMed] [Google Scholar]
- 50.Koerkamp MG, Rep M, Bussemaker HJ, Hardy GP, Mul A, Piekarska K, Szigyarto CA, De Mattos JM, Tabak HF. Dissection of transient oxidative stress response in Saccharomyces cerevisiae by using DNA microarrays. Mol Biol Cell. 2002;13:2783–94. doi: 10.1091/mbc.E02-02-0075. [DOI] [PMC free article] [PubMed] [Google Scholar]
- 51.Conrads TP, Alving K, Veenstra TD, Belov ME, Anderson GA, Anderson DJ, Lipton MS, Pasa-Tolic L, Udseth HR, Chrisler WB, Thrall BD, Smith RD. Quantitative analysis of bacterial and mammalian proteomes using a combination of cysteine affinity tags and 15N-metabolic labeling. Anal Chem. 2001;73:2132–9. doi: 10.1021/ac001487x. [DOI] [PubMed] [Google Scholar]
- 52.Foster LJ, De Hoog CL, Mann M. Unbiased quantitative proteomics of lipid rafts reveals high specificity for signaling factors. Proc Natl Acad Sci U S A. 2003;100:5813–8. doi: 10.1073/pnas.0631608100. [DOI] [PMC free article] [PubMed] [Google Scholar]
- 53.Ibarrola N, Kalume DE, Gronborg M, Iwahori A, Pandey A. A proteomic approach for quantitation of phosphorylation using stable isotope labeling in cell culture. Anal Chem. 2003;75:6043–9. doi: 10.1021/ac034931f. [DOI] [PubMed] [Google Scholar]
- 54.de Hoog CL, Foster LJ, Mann M. RNA and RNA binding proteins participate in early stages of cell spreading through spreading initiation centers. Cell. 2004;117:649–62. doi: 10.1016/s0092-8674(04)00456-8. [DOI] [PubMed] [Google Scholar]
- 55.Everley PA, Krijgsveld J, Zetter BR, Gygi SP. Quantitative cancer proteomics: stable isotope labeling with amino acids in cell culture (SILAC) as a tool for prostate cancer research. Mol Cell Proteomics. 2004;3:729–35. doi: 10.1074/mcp.M400021-MCP200. [DOI] [PubMed] [Google Scholar]
- 56.Tackett AJ, DeGrasse JA, Sekedat MD, Oeffinger M, Rout MP, Chait BT. I-DIRT, a general method for distinguishing between specific and nonspecific protein interactions. J Proteome Res. 2005;4:1752–6. doi: 10.1021/pr050225e. [DOI] [PubMed] [Google Scholar]
- 57.Luers GH, Hartig R, Mohr H, Hausmann M, Fahimi HD, Cremer C, Volkl A. Immunoisolation of highly purified peroxisomes using magnetic beads and continuous immunomagnetic sorting. Electrophoresis. 1998;19:1205–10. doi: 10.1002/elps.1150190722. [DOI] [PubMed] [Google Scholar]
- 58.Volkl A, Mohr H, Weber G, Fahimi HD. Isolation of rat hepatic peroxisomes by means of immune free flow electrophoresis. Electrophoresis. 1997;18:774–80. doi: 10.1002/elps.1150180519. [DOI] [PubMed] [Google Scholar]
- 59.Volkl A, Mohr H, Weber G, Fahimi HD. Isolation of peroxisome subpopulations from rat liver by means of immune free-flow electrophoresis. Electrophoresis. 1998;19:1140–4. doi: 10.1002/elps.1150190714. [DOI] [PubMed] [Google Scholar]
- 60.Link AJ, Eng J, Schieltz DM, Carmack E, Mize GJ, Morris DR, Garvik BM, Yates JR., 3rd Direct analysis of protein complexes using mass spectrometry. Nat Biotechnol. 1999;17:676–82. doi: 10.1038/10890. [DOI] [PubMed] [Google Scholar]
- 61.Liu T, Qian WJ, Gritsenko MA, Camp DG, 2nd, Monroe ME, Moore RJ, Smith RD. Human plasma N-glycoproteome analysis by immunoaffinity subtraction, hydrazide chemistry, and mass spectrometry. J Proteome Res. 2005;4:2070–80. doi: 10.1021/pr0502065. [DOI] [PMC free article] [PubMed] [Google Scholar]
- 62.Sleat DE, Lackland H, Wang Y, Sohar I, Xiao G, Li H, Lobel P. The human brain mannose 6-phosphate glycoproteome: a complex mixture composed of multiple isoforms of many soluble lysosomal proteins. Proteomics. 2005;5:1520–32. doi: 10.1002/pmic.200401054. [DOI] [PubMed] [Google Scholar]
- 63.Wang L, Li F, Sun W, Wu S, Wang X, Zhang L, Zheng D, Wang J, Gao Y. Concanavalin A-captured glycoproteins in healthy human urine. Mol Cell Proteomics. 2006;5:560–2. doi: 10.1074/mcp.D500013-MCP200. [DOI] [PubMed] [Google Scholar]
- 64.Hannich JT, Lewis A, Kroetz MB, Li SJ, Heide H, Emili A, Hochstrasser M. Defining the SUMO-modified proteome by multiple approaches in Saccharomyces cerevisiae. J Biol Chem. 2005;280:4102–10. doi: 10.1074/jbc.M413209200. [DOI] [PubMed] [Google Scholar]
- 65.Panse VG, Hardeland U, Werner T, Kuster B, Hurt E. A proteome-wide approach identifies sumoylated substrate proteins in yeast. J Biol Chem. 2004;279:41346–51. doi: 10.1074/jbc.M407950200. [DOI] [PubMed] [Google Scholar]
- 66.Wykoff DD, O'Shea EK. Identification of sumoylated proteins by systematic immunoprecipitation of the budding yeast proteome. Mol Cell Proteomics. 2005;4:73–83. doi: 10.1074/mcp.M400166-MCP200. [DOI] [PubMed] [Google Scholar]
- 67.Zhou F, Xue Y, Lu H, Chen G, Yao X. A genome-wide analysis of sumoylation-related biological processes and functions in human nucleus. FEBS Lett. 2005;579:3369–75. doi: 10.1016/j.febslet.2005.04.076. [DOI] [PubMed] [Google Scholar]
- 68.Ptacek J, Devgan G, Michaud G, Zhu H, Zhu X, Fasolo J, Guo H, Jona G, Breitkreutz A, Sopko R, McCartney RR, Schmidt MC, Rachidi N, Lee SJ, Mah AS, Meng L, Stark MJ, Stern DF, De Virgilio C, Tyers M, Andrews B, Gerstein M, Schweitzer B, Predki PF, Snyder M. Global analysis of protein phosphorylation in yeast. Nature. 2005;438:679–84. doi: 10.1038/nature04187. [DOI] [PubMed] [Google Scholar]
- 69.Vener AV, Harms A, Sussman MR, Vierstra RD. Mass spectrometric resolution of reversible protein phosphorylation in photosynthetic membranes of Arabidopsis thaliana. J Biol Chem. 2001;276:6959–66. doi: 10.1074/jbc.M009394200. [DOI] [PubMed] [Google Scholar]
- 70.Wagner V, Gessner G, Heiland I, Kaminski M, Hawat S, Scheffler K, Mittag M. Analysis of the phosphoproteome of Chlamydomonas reinhardtii provides new insights into various cellular pathways. Eukaryot Cell. 2006;5:457–68. doi: 10.1128/EC.5.3.457-468.2006. [DOI] [PMC free article] [PubMed] [Google Scholar]
- 71.Agne B, Meindl NM, Niederhoff K, Einwachter H, Rehling P, Sickmann A, Meyer HE, Girzalsky W, Kunau WH. Pex8p: an intraperoxisomal organizer of the peroxisomal import machinery. Mol Cell. 2003;11:635–46. doi: 10.1016/s1097-2765(03)00062-5. [DOI] [PubMed] [Google Scholar]
- 72.Prinz S, Avila-Campillo I, Aldridge C, Srinivasan A, Dimitrov K, Siegel AF, Galitski T. Control of yeast filamentous-form growth by modules in an integrated molecular network. Genome Res. 2004;14:380–90. doi: 10.1101/gr.2020604. [DOI] [PMC free article] [PubMed] [Google Scholar]