Abstract
Interaction of light with matter is of paramount importance in nature. The most fundamental property of a material in relation to light is its oscillator strength distribution, i.e., how strongly it absorbs light as a function of wavelength. Once the oscillator strength distribution is determined precisely for a wide enough energy range, the optical constants such as absorbance and reflectance as well as a number of other properties of the material, some of which are seemingly unrelated to photoabsorption, can be deduced. Most important of all is the fact that the interaction of matter with fast charged particles can be described by its complete optical spectra [Inokuti, M. (1986) Photochem. Photobiol. 44, 279–285]. Despite their importance, however, the complete optical spectra of volatile liquids including water have never been obtained accurately because of experimental difficulties inherent in vacuum UV spectroscopy. Inelastic x-ray scattering spectroscopy can provide quantitative data equivalent to those from vacuum UV absorption spectra. Herein, we show the complete optical spectrum of liquid water determined by making use of intense monochromatic x-rays supplied by the wiggler line X21 of the National Synchrotron Light Source.
Gaseous water, like many other substances, absorbs strongly in the vacuum UV (VUV) range, and its spectrum has been thoroughly studied (1). The optical properties of condensed phases are, however, generally different from those of isolated molecules (2). Unfortunately, because no VUV window material is available above 12 eV (1 eV = 1.602 × 10⁻¹⁹ J), it is practically impossible to measure VUV spectra of volatile liquids like water. Electron energy loss spectroscopy, which in principle can provide data equivalent to those from absorption spectra, also requires the experiments to be performed in vacuum.
In view of its importance, a series of attempts has been made in the past to overcome the difficulties in obtaining VUV spectra of liquid water (3–6). In those studies, reflectance spectra were measured on water cooled to 1°C through two stages of differential pumping; each stage included a cryopump capable of pumping 80,000 liters of water vapor per second. Despite such efforts, the spectral range was still limited to below 26 eV, and even within this limited energy range, the data in the literature still show considerable discrepancies (5, 6).
Methods
By the use of inelastic x-ray scattering (IXS) spectroscopy, it is possible to overcome the difficulties inherent in VUV spectroscopic study of volatile liquids. Eq. 1 shows the double-differential cross section of IXS (∂2σ/∂Ω∂E), expressed in atomic units (7):
 |
1 |
Here, rj is the coordinate of the electron involved in the transition; Efi is the energy difference between the initial state |i> and the final state |f>; q is the momentum transfer; N is the total number of electrons; and (dσ/dΩ)Th is the Thomson scattering cross section (7). By using the generalized oscillator strength (8) df(q,E)/dE defined by Eq. 2,
 |
2 |
where <… >Ω means spherical average, the cross section for isotropic samples is then expressed by Eq. 3.
 |
3 |
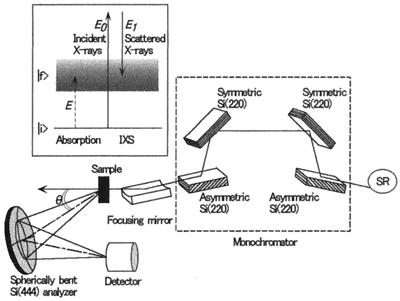
A relevant energy diagram is given in Fig. 1 Inset. The generalized oscillator strength is a normalized quantity determined by the sum rule (2, 8):
 |
4 |
Consequently, from IXS measurements, the generalized oscillator strength can be obtained on an absolute scale as a function of both E and q. This quantity, in turn, is uniquely related to the dielectric response function ɛ(q,E) (9), which determines the interaction of the material with a charged particle. In particular, if the experimental conditions satisfy the approximation qr ≪ 1, then the dipole approximation is justified, and the spatial average of the matrix element in Eq. 2 reduces to (q2/3)|<f|ΣjNrj|i>|2, which is exactly the same matrix element as that for the optical oscillator strength. That is, the optical oscillator strength, which determines the interaction with photons, is a special case of the generalized oscillator strength. Hence, the same spectra as absorption can be obtained with IXS by choosing the experimental conditions appropriately. For localized electrons, such as valence electrons of molecules in condensed phases, as well as core electrons, it is not very difficult to realize the condition qr ≪ 1.
Figure 1.
Schematic diagram of the National Synchrotron Light Source beamline X21. (Inset) This energy diagram demonstrates the equivalence of IXS and VUV absorption. SR, synchrotron radiation.
From the experimental point of view, IXS spectroscopy has several advantages over VUV spectroscopy. First of all, the use of hard x-rays eliminates the necessity of vacuum. Second, a wide spectral range, from zero to several hundred eV, which includes the entire visible-VUV region, can be surveyed with a single experimental setup. Third, the absolute oscillator strength can be obtained by the use of the sum rule in Eq. 4. Fourth, the data reflect the bulk properties of the material and are indifferent to surface effects. In addition, IXS is free from contamination from higher order reflections, which are often serious problems in VUV spectroscopy. Despite all these benefits, the very small scattering cross section of IXS at small q has hindered its use until recently.
In previous work, we have determined the generalized oscillator strength of liquid water for 0.69 ≤ q ≤ 3.59 a.u. by IXS (9) and have substantiated experimentally that IXS of liquid water can provide the same spectra as optical spectroscopy as long as the momentum transferred is less than ≈0.3 a.u (10). Unfortunately, however, low signal-to-noise ratio problems prevented us from obtaining the quantitative optical oscillator strength distribution. Herein, we present the absolute optical oscillator strength distribution of liquid water up to 160 eV derived from IXS spectra with improved signal-to-noise ratio.
The experiment was carried out on beamline X21 at the National Synchrotron Light Source. Fig. 1 shows a schematic of the experimental setup. Monochromatic x-rays irradiate the sample, and the radiation scattered at an angle θ is collected, dispersed with a spherically bent crystal analyzer [Si (444); 1-m radius], and detected with an AMPTEC XR-100T detector. For high/low resolution measurement, a Bragg angle of 87°/78.8° was used, the pass energy of the analyzer being 7,920 eV/8,063 eV. The energy resolution, measured as the full width at half maximum of the elastic line, was 0.5 eV/1.3 eV. Measurements were carried out in high-resolution mode for small energy transfers to resolve the fine structures in the spectrum, and low-resolution mode was used to achieve high signal-to-noise ratio for larger energy transfers where no fine structure is expected. IXS spectra were obtained by scanning the incident x-ray energy. The scattering angle was fixed at 7.5°, which corresponds to a momentum transfer of 0.28 a.u.
After correcting the scattering from cell windows, absorption, double scattering, and the elastic line, the IXS spectrum was normalized by using Eq. 4 to deduce the oscillator strength. In the normalization, as in the previous work (9), the IXS data were least-squares fitted to the function A/EB and extrapolated to infinity after a removal of constant background (≈2% of the peak counts). A value of 8.22 was used for N, which corresponds to the total number of valence electrons (n = 8), plus a small estimated correction (0.22) for Pauli-excluded transitions from the K shell to the already occupied orbitals (ref. 11 and M. Inokuti, personal communication).
Once the optical oscillator strength distribution is obtained for a wide enough energy range, the imaginary as well as the real part of the dielectric function ɛ(0,E) can be calculated by applying the well known Kramers–Kronig relation (12). The dielectric function can then be converted to various forms such as index of refraction and reflectance to make comparisons with data from different sources.
Results and Discussion
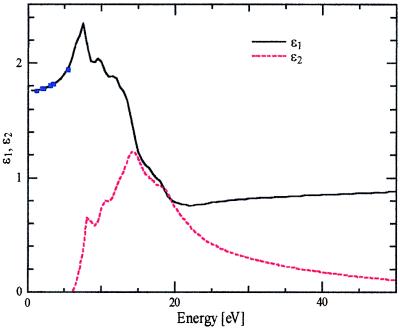
Fig. 2 shows the real and imaginary parts of the dielectric response function of liquid water. Several values calculated from the well documented refractive index of water are indicated in the figure. All of the points fall almost exactly on the observed curve, which endorses the accuracy of the present results.
Figure 2.
Real (ɛ1) and imaginary (ɛ2) parts of the dielectric function of liquid water from the present work. Closed squares:ɛ1 was calculated from the index of refraction.
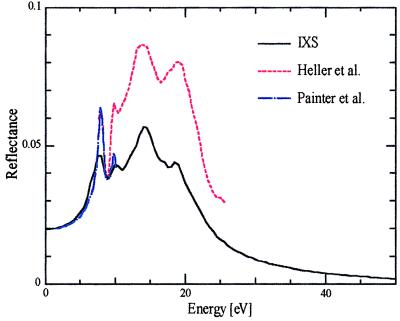
The reflectance spectrum of liquid water calculated from IXS data is shown in Fig. 3 and is compared with the spectra directly observed in the near UV region by Painter et al. (3) and in the VUV region by Heller et al. (6). It is evident that our results coincide very well with the corresponding ones in the visible and near UV region (<7 eV) where optical measurements encounter less difficulty and are considered to be reliable. This agreement again confirms the accuracy of the results obtained in this study. On the other hand, the reflectance spectrum in the VUV region differs significantly from ours. This discrepancy is most likely a result of the distortion of the VUV reflectance spectrum caused by the intense absorption of water vapor. This conjecture is supported by the fact that, under a cooler condition (80 K) where vapor effects are reduced significantly, the VUV reflectance spectra of condensed waters (hexagonal and amorphous ice; ref. 13) are quite similar to the spectrum calculated from the present IXS results.
Figure 3.
Reflectance spectra of liquid water calculated from IXS, reported by Heller et al. (6), and reported by Painter et al. (3).
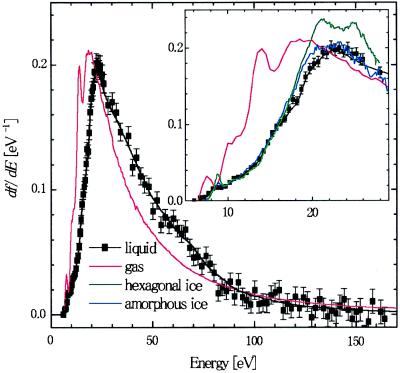
In Fig. 4, the optical oscillator strength of liquid water is shown and compared with that of different phases of water. High-resolution data are shown for energy transfer E < 30 eV, and low-resolution data are shown for E > 30 eV. The ordinate scale (eV−1) is absolute. Except for a small shoulder starting at around 8 eV, the oscillator strength distribution of water increases sharply with increasing energy, reaching a peak at around 22 eV, and then decreases monotonically.
Figure 4.
Oscillator strength distribution of liquid water, gas phase water (15), hexagonal ice (13), and amorphous ice (14). Closed squares and the black solid line represent raw and smoothed IXS data, respectively.
The absolute oscillator strength distribution of two ices is available from a reflection study on hexagonal ice (13) and an electron energy loss spectroscopy study on amorphous ice (14), both up to about 28 eV. They are reproduced in Fig. 4 Inset. For hexagonal ice, a distinct peak at 8.7 eV is observed, followed by several other structures at higher energy. In contrast, these structures are broadened and less well defined in amorphous ice. In fact, the oscillator strength distribution of amorphous ice looks almost the same as that of liquid water. Both the peak energy of the oscillator strength distribution and the magnitude of the peak oscillator strength are nearly identical for the two systems.
On the other hand, the gas phase absorption spectrum is characterized by sharp absorption bands below the ionization threshold (12.6 eV) followed by absorption of the continuum (1). The gas phase data shown in Fig. 4 are taken from electron energy loss spectroscopy measurements with 1-eV resolution (15). Accordingly, structures below the ionization threshold are convolutions of many sharp Rydberg transitions. The oscillator strength distribution reaches a sharp maximum at 14.0 eV, followed by another broader and slightly more intense maximum at 19 eV.
The main difference between the gas phase and liquid phase lies in the energy of maximum oscillator strength, as can be seen in Fig. 4. In the liquid phase, the entire oscillator strength distribution shifts toward higher energy. Such a shift will give rise to a large variance in the values of optical constants and other important properties calculated from the oscillator strength distribution.
A large number of simulations have been made to understand the behavior of charged particles in liquid water (16–20). The basis for all these calculations is the generalized oscillator strength of liquid water over a complete energy and momentum range. Owing to the lack of experimental data, such calculations have to rely on cross sections of liquid water estimated from the gas phase cross-section data with a number of assumptions or extrapolated from the optical data of Heller et al. (6). The complete optical spectrum of liquid water reported in this work, together with the previously measured generalized oscillator strength distributions at higher momentum transfers (9), should improve the reliability of these calculations.
Acknowledgments
H.H. thanks the Japan Society for the Promotion of Science for Postdoctoral Fellowships for Research Abroad.
Abbreviations
- VUV
vacuum UV
- IXS
inelastic x-ray scattering
Footnotes
This paper was submitted directly (Track II) to the PNAS office.
Article published online before print: Proc. Natl. Acad. Sci. USA, 10.1073/pnas.110572097.
Article and publication date are at www.pnas.org/cgi/doi/10.1073/pnas.110572097
References
- 1.Berkowitz J. Photoabsorption, Photoionization, and Photoelectron Spectroscopy. San Diego: Academic; 1979. [Google Scholar]
- 2.Inokuti M. Radiat Eff Defects Solids. 1991;117:143–162. [Google Scholar]
- 3.Painter L R, Birkhoff R D, Arakawa E T. J Chem Phys. 1969;51:243–251. [Google Scholar]
- 4.Kerr G D, Cox J T, Painter L R, Birkhoff R D. Rev Sci Instrum. 1971;42:1418–1422. [Google Scholar]
- 5.Kerr G D, Hamm R N, Williams M W, Birkhoff R D, Painter L R. Phys Rev A At Mol Opt Phys. 1972;5:2523–2527. [Google Scholar]
- 6.Heller J M, Jr, Hamm R N, Birkhoff R D, Painter L R. J Chem Phys. 1974;60:3483–3486. [Google Scholar]
- 7.Schülke W. In: Handbook on Synchrotron Radiation. Brown G S, Moncton D E, editors. Vol. 3. Amsterdam: Elsevier Science; 1991. pp. 565–637. [Google Scholar]
- 8.Inokuti M. Rev Mod Phys. 1971;43:297–347. [Google Scholar]
- 9.Watanabe N, Hayashi H, Udagawa Y. Bull Chem Soc Jpn. 1997;70:719–726. [Google Scholar]
- 10.Hayashi H, Watanabe N, Udagawa Y, Kao C-C. J Chem Phys. 1998;108:823–825. [Google Scholar]
- 11.Dehmer J L, Inokuti M, Saxon R P. Phys Rev A At Mol Opt Phys. 1975;12:102–121. [Google Scholar]
- 12.Williams M W, Arakawa E T, Inagaki T. In: Handbook on Synchrotron Radiation. Ebashi S, Koch M, Rubenstein E, editors. Vol. 4. Amsterdam: Elsevier Science; 1991. pp. 95–145. [Google Scholar]
- 13.Kobayashi K. J Phys Chem. 1983;87:4317–4321. [Google Scholar]
- 14.Daniels J. Opt Commun. 1971;3:240–243. [Google Scholar]
- 15.Chan W F, Cooper G, Brion C E. Chem Phys. 1993;178:387–400. [Google Scholar]
- 16.Kaplan I G, Miterev A M, Sukhonosov V Y. Radiat Phys Chem. 1986;27:83–90. [Google Scholar]
- 17.Pimblott S M, LaVerne J A, Mozumder A. J Phys Chem. 1996;100:8595–8606. [Google Scholar]
- 18.Dingfelder M, Hantke D, Inokuti M, Paretzke H G. Radiat Phys Chem. 1998;53:1–18. [Google Scholar]
- 19.Ritchie R H, Hamm R N, Turner J E, Wright H A, Bolch W E. In: Physical and Chemical Mechanisms in Molecular Radiation Biology. Grass W A, Varma M N, editors. New York: Plenum; 1991. pp. 99–135. [Google Scholar]
- 20.Wilson W E, Nikjoo H. Radiat Environ Biophys. 1999;38:97–104. doi: 10.1007/s004110050144. [DOI] [PubMed] [Google Scholar]


