Abstract
Determining the structure of cartilage collagen fibrils will provide insights into how mutations in collagen genes affect cartilage formation during skeletal morphogenesis and understanding the mechanism of fibril growth. The fibrils are indeterminate in size, heteropolymeric, and highly cross-linked, which make them refractory to analysis by conventional high-resolution structure determination techniques. Electron microscopy has been limited to making simple measurements of fibril diameter and immunolocalizing certain molecules at the fibril surface. Consequently, structural information on the fibrils is limited. In this study we have used scanning transmission electron microscopic mass mapping, analysis of axial stain exclusion pattern, and r-weighted back-projection techniques to determine the intermediate resolution (to ≈4 nm) structure of thin collagen fibrils from embryonic cartilage. The analyses show that the fibrils are constructed from a 10+4 microfibrillar arrangement in which a core of four microfibrils is surrounded by a ring of 10 microfibrils. Accurate mass measurements predict that each microfibril contains five collagen molecules in cross-section. Based on the proportion of collagen II, IX, and XI in the fibrils, the fibril core comprises two microfibrils each of collagen II and collagen XI. Single molecules of collagen IX presumably occur at the fibril surface between the extended N-terminal domains of collagen XI. The 10+4 microfibril structure explains the mechanism of diameter limitation in the narrow fibrils and the absence of narrow collagen fibrils in cartilage lacking collagen XI.
Keywords: chondrodysplasia, collagen, electron microscopy, mass mapping, reconstruction
The ability of cartilage to withstand cycles of compression and relaxation relies on a felt-like extracellular matrix (ECM) of insoluble collagen fibrils within a concentrated solution of proteoglycans and glycoconjugates. The collagen fibrils withstand the swelling pressure exerted on the ECM by the hydrated glycosaminoglycan side chains of the proteoglycans. However, this apparently simple role of the collagen fibrils belies enormous effort over many years to understand fibril structure and function as a means of explaining how mutations in cartilage fibril genes produce developmental defects. In particular, it is perplexing why cartilage has two distinct populations of collagen fibrils; one thin (≈20-nm diameter) and the other thick (≈40-nm diameter). Also, it is a quandary why cartilage fibrils of diameter between 20 and 40 nm do not exist in cartilage; also whereas the thin fibrils are all ≈20 nm in diameter, the thick fibrils have a much broader diameter distribution. In this respect, the thick fibrils are more like fibrils in noncartilagenous tissues, which can range from 30 to 500 nm in diameter (1). We reasoned that determination of the structure of the thin fibrils was an essential first step in understanding cartilage fibril structure and function.
Cartilage fibrils are D-periodic (where D ≈ 67 nm), indeterminate in length, and heterotypic polymers of collagen II, IX, and XI molecules (2–7). Collagen II is the major collagen in cartilage and comprises three α1(II) chains wound into a collagen-typical triple helix. Collagen IX is a fibril-associated collagen with interrupted triple helices and is distributed at regular D-periodic intervals along the fibrils. Collagen IX can also contain a chondroitin sulfate side chain. Collagen XI molecules are heterotrimers of three distinct chains [α1(XI), α2(XI), and α3(XI)] in which the α1(XI) chain has a large N terminus with sequence homology with domains on thrombospondins (8). Of special interest, the α3(XI) chains are a posttranslationally modified variant of α1(II), which occurs in collagen II. Cartilage fibrils vary in the relative proportions of collagen II, IX, and XI depending on stage of development and fibril diameter. The thin fibrils are abundant in embryonic cartilage and contain collagen II, IX, and XI in the approximate molecular ratio of 8:1:1 (2). Furthermore, evidence from immunoelectron microscopy suggests that collagen XI is exclusive to the thin fibrils (3). The thick fibrils are abundant in older tissue and are depleted of collagen IX. In the vitreous humor, which comprises fibrils of collagen II, IX, and V/XI (in which collagen V has structural similarities to collagen XI), collagen IX is lost with age, leading to fibril fusion and collapse of the vitreous humor (9).
Three observations, in particular, prompted us to determine the structure of the thin collagen fibrils in cartilage. The first concerns the cho/cho mouse and human osteochondrodysplasias caused by mutations in the genes for collagen XI; the second concerns collagen fibril assembly in vivo when the gene for collagen II is overexpressed; and the third concerns collagen fibrillogenesis in vitro from collagen II, IX, and XI. Furthermore, the uniform diameter of the thin fibrils indicated to us that the fibril might have a repeating or regular 3D structure, which would facilitate the use of averaging methods in EM. Autosomal recessive chondrodysplasia (cho) in mice affecting cartilage of limbs, ribs, mandibles and trachea is accompanied by absence of thin fibrils and the appearance of thick fibrils exceeding 2 μm in diameter (10). The causative mutation in the cho/cho mouse is localized in the gene encoding the α1(XI) chain of collagen XI (11) and effectively leads to the absence of collagen XI from the extracellular matrix. The absence of thin cartilage fibrils in the cho/cho mouse suggests that collagen XI is either required to initiate the assembly of the thin fibrils or has a primary role in limiting the lateral growth of fibrils. Similar cartilage abnormalities caused by mutations in the genes that encode α1(II) of collagen II and α1(XI) and α2(XI) chains of collagen XI occur in humans with chondrodysplasias of the Stickler/Marshall syndrome types (for review see refs. 12 and 13 and references therein). Garfalo et al. (14) showed that the cartilage of mice overexpressing normal collagen II exhibit thin and thick fibrils but the thick fibrils can exceed 2 μm in diameter (14). The fact that thin (≈20 nm in diameter) fibrils were present despite excess collagen II suggests that the thin fibrils have an invariant structure that is insensitive to the prefibrillar ratio of collagen II/XI. The importance of the molar ratio of collagens II, IX, and XI on fibril diameter has been carefully assessed in vitro (15). In an elegant study, Blaschke et al. (15) showed that mixed populations of thin and thick collagen fibrils were generated when mixtures of purified collagen II and XI were incubated at physiological temperatures. The thin fibrils had a diameter of 21.6 ± 0.3 nm and were therefore closely similar to authentic cartilage thin fibrils. Importantly, thin fibrils were observed only in samples containing collagen XI. The diameters of the “thick” fibrils increased at higher molar ratios of II/XI collagen, consistent with what was observed by Garofalo et al. (14) in mice overexpressing collagen II. Collagen IX appeared to have no role in limiting fibril diameter and was not able to form banded fibrils when incubated in the absence of collagen II/XI.
Results
Determination of the Absolute Lateral Size of Thin Cartilage Fibrils.
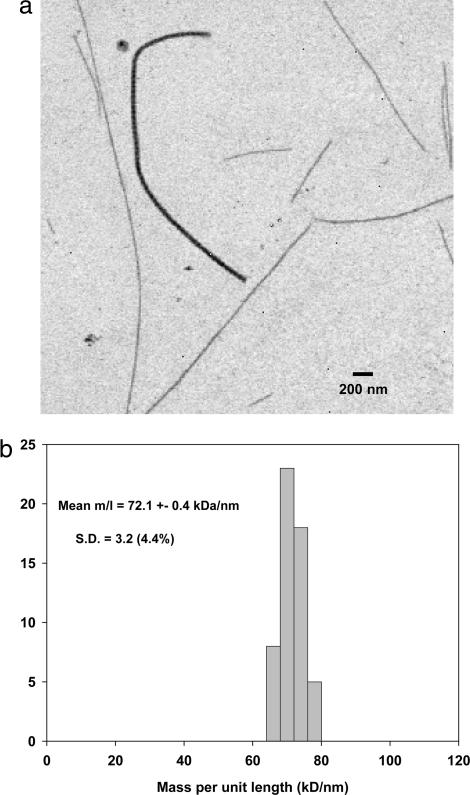
Samples of collagen fibrils dispersed from the 14-d embryonic chick sternum showed two distinct populations of thin and thick fibrils (Fig. 1a). Mass per unit length (M/L) measurements were made on annular dark-field scanning transmission EM (STEM) images of unstained fibrils. The results for the thin fibrils are shown in Fig. 1b. The mean M/L was 72.1 kDa/nm. In contrast, M/L values for the thick fibrils were 6- to 10-fold greater than those of the thin fibril component, ranging from ≈400 to ≈700 kDa/nm (data not shown). Most thin fibrils showed two abrupt (broken) ends and with lengths in the range from 2 to 25 μm but occasionally a tapered (natural) tip was observed. The M/L measurement and published x-ray diffraction data for molecular packing density in cartilage fibrils (16) yields a predicted hydrated diameter of 16.4 nm. Direct measurements of fibrils dried in stain/trehalose gives a value of ≈15 nm (data not shown).
Fig. 1.
STEM data for collagen fibrils from 14-d chick embryonic sternum. (a) Annular dark-field STEM image of unstained fibrils released by mechanical disruption is shown. This represents a typical field of view showing several thin fibrils and a single thick fibril. The thick fibril has a measured M/L of ≈500 kDa/nm compared with ≈70 kDa/nm for the thin fibrils. (b) Histogram shows the M/L distribution of the thin fibril component measured from STEM images similar to that shown.
Determination of the Collagen Molecular Ratio by EM.
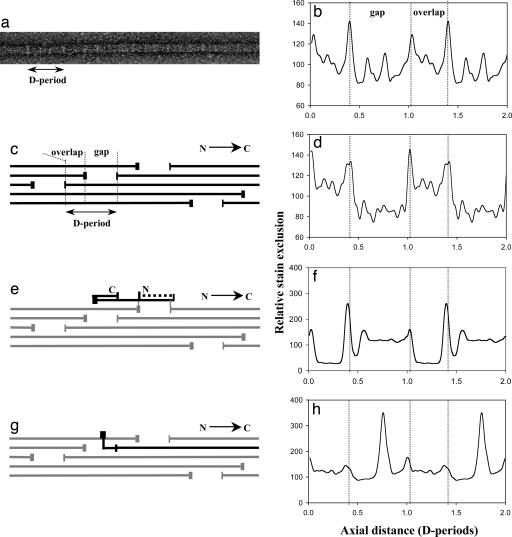
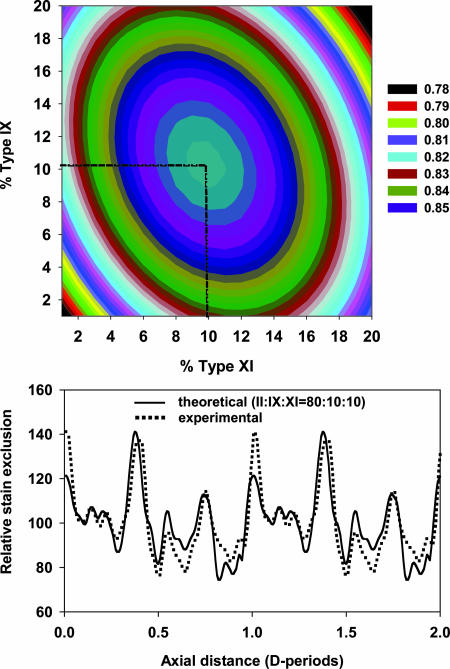
To interpret the M/L data in terms of a structural model it was necessary to know the collagen composition of the fibrils. Cross-linking leading to insolubility of the collagen molecules, coupled with our requirement for knowing the molecular ratio only in the thin fibrils, prohibited the use of biochemical approaches to determine the molecular composition of the thin fibrils. We decided to use analysis of the D-periodic negative stain pattern, as follows. Some fibril samples from the 14-d chick embryonic sternum were negatively stained with 4% uranyl acetate in 1% trehalose (in water) on holey carbon films and imaged by transmission EM (TEM) (Fig. 2a). An average axial stain pattern (Fig. 2b) was obtained from ≈100 D-periods from thin fibrils. This pattern was modeled by using established methods (17). The axial arrangement of collagen II, IX, and XI molecules are shown in Fig. 2 c, e, and g, respectively, and the corresponding theoretical axial stain exclusion patterns (ASEPs) are shown in Fig. 2 d, f, and h, respectively. In this study the COL3 and NC4 domains of type IX were included when generating the theoretical ASEP. A bent back alignment along the fibril axis resulted in an improved match with the experimental data as assessed by an increased correlation coefficient and by visual comparison of the experimental and theoretical stain patterns. A set of 800 theoretical ASEPs were then generated for model heterotypic fibrils of varied composition up to a maximum of 20% collagen IX and 20% collagen XI at 1% intervals. The correlation coefficient was calculated between each of these theoretical ASEPs and the experimental average ASEP of the thin cartilage fibrils. The resultant 2D array is shown as a contour plot in Fig. 3a. The data show a smooth single peak with a maximum correlation coefficient of 0.86 corresponding to a molecular content of 10% collagen IX and 10% collagen XI. Fig. 3b shows the theoretical ASEP for a fibril of composition II/IX/XI = 80:10:10 compared with the experimentally observed ASEP.
Fig. 2.
Experimental and theoretical axial structure data for negatively stained collagen fibrils. (a) TEM image shows a thin fibril from 14-d chick embryonic sternum negatively stained with 4% uranyl acetate/1% trehalose. A single D-period is indicated. Light bands correspond to stain excluding regions. (b) An average ASEP obtained from ≈100 D-periods from fibrils similar to that shown in a is shown. The average ASEP is shown repeated over two D-periods. (c) Representation of the known axial arrangement of type II collagen molecules in the fibril is shown. The triple helix is represented by the horizontal lines, and the telopeptides (extrahelical domains) are indicated by the vertical lines. (d) Shown is the theoretical ASEP based on the known amino acid sequence of type II collagen and the axial arrangement as shown in c. (e) Representation of the axial location of type IX collagen (black) on the type II fibril is shown. The IX–II intermolecular cross-links involve the type II telopeptides and are marked as gray vertical lines. The COL3 domain (indicated by dotted line) and amino-terminal NC4 domain of the type IX molecule have been modeled in bent-back, axially aligned configuration in this preparation. (f) The theoretical ASEP contribution of type IX to the fibril stain pattern based on the axial location and conformation of the type IX molecule shown in e is shown. (g) Representation of the axial location of the type XI molecule (black) on the type II fibril is shown. The main triple helix of the type XI is in an equivalent axial position to the those of the type II molecules. The minor triple helix of the N-propeptides extends into the gap zone; the nontriple domains are shown extended perpendicular to the fibril axis. (h) The theoretical ASEP contribution of the type XI molecules to the fibril stain pattern based on the axial location and conformation of the type XI molecule shown in g is shown. The nontriple helical part of the N-propeptides is predicted to generate a major stain exclusion peak in the gap region.
Fig. 3.
Comparison of theoretical and experimental ASEPs of thin cartilage fibrils. (a) 2D plot shows the correlation coefficient between the experimental ASEP and theoretical ASEPs generated by varying the proportion of type IX and type XI in the model fibril. A maximum value of correlation coefficient is found for theoretical ASEP of a fibril with 10% type IX and 10% type XI (corresponding to a molecular ratio II/IX/XI = 80:10:10). (b) Comparison of the experimental ASEP of thin cartilage fibrils with the theoretical ASEP for a heterotypic fibril of composition II/IX/XI = 80:10:10 is shown.
Possible Microfibril Substructures.
From the M/L data and molecular composition it was possible to predict the number of molecular strands of each collagen type in the thin fibrils. The number of molecular strands is equal to the number of molecules in cross-section at the overlap zone in the fibril (for review see ref. 18). Table 1 shows four models containing the equivalent of 14 five-stranded microfibrils of collagens II and XI. Model 1 with a molecular strand composition of 60, 4, and 10 for collagen II, IX, and XI, respectively, is in closest agreement with experimental data. This model has the equivalent of 12 collagen II microfibrils and 2 collagen XI microfibrils. In this case, the predicted M/L is 69.9 kDa/nm, which agrees well with the experimental value (72.1 kDa/nm). The predicated M/L value is expected to be less than the measured value because of a minimal mass contaminant on the fibrils.
Table 1.
Calculated M/L and molecular composition for a range of fibril models containing the equivalent of 14 five-stranded collagen II and collagen XI microfibrils
| Model | No. of molecular strands |
Molecular content,% |
Fibril M/L, kDa/nm |
|||||||
|---|---|---|---|---|---|---|---|---|---|---|
| NII | NIX | NXI | II | IX | XI | II | IX | XI | Total | |
| 1 | 60 | 4 | 10 | 75 | 12.5 | 12.5 | 52.3 | 6.5 | 11.1 | 69.9 |
| 2 | 65 | 4 | 5 | 80 | 13.3 | 6.7 | 56.7 | 6.5 | 5.6 | 68.8 |
| 3 | 60 | 2 | 10 | 80 | 6.7 | 13.3 | 52.3 | 3.3 | 11.1 | 66.7 |
| 4 | 65 | 2 | 5 | 86.6 | 6.7 | 6.7 | 56.7 | 3.3 | 5.6 | 65.6 |
Decrease in M/L After Trypsin/Chymotrypsin Treatment.
As a further test of the proposed model structures in Table 1 and to establish levels of specifically bound noncollagen components on the surface of the thin fibrils, M/L measurements were made on fibrils after trypsin/chymotrypsin treatment. Fibril preparation were identical to those used for the initial STEM measurements but were exposed to a solution of trypsin/chymotrypsin while anchored on the holey carbon film (see Materials and Methods). The entire surface of the fibrils stretching across the holes was accessible to the proteases. The mean M/L of the treated fibrils was measured as 60.8 kDa/nm (SEM = 0.3 kDa/nm), indicating a mass loss of 11.3 kDa/nm. The predicted mass loss (using model 1 in Table 1) caused by removal of the NC and Col3 domains of type IX collagen and removal of the nontriple helical part of the type XI N-propeptide was calculated as 7.6 kDa/nm. The additional observed loss of 3.7 kDa/nm would then be caused by noncollagen components bound to the fibril surface and released after protease treatment. The corrected M/L for the thin fibril without the bound noncollagen component would then be 68.4 kDa/nm (compared with a predicted value of 69.9 kDa/nm in model 1).
Determination of Lateral Structure by Weighted Back Projection.
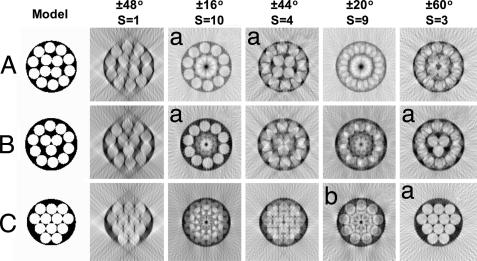
In initial experiments we acquired tilt series of single negatively stained fibrils in the range ±64° with the fibril aligned along the tilt axis. The tomographic reconstruction indicated the presence of a microfibrillar substructure (data not shown). However, the reconstructions showed streaking in the z axis (vertical to the electron microscope grid) caused by restricted tilt range [resulting in the “missing wedge” effect (19)] and deterioration in the image quality with increasing tilt angle (more than ≈45°). The conspicuous presence of microfibrils in the tomograms led us to investigate the use of rotational averaging techniques. Fig. 4 shows a set of predicted weighted back-projection reconstructions of three model microfibril structures. The models differed in the number of inner core and outer shell microfibrils. The results showed that this was a valid experimental approach to obtain reconstructions from projections with a restricted angular range.
Fig. 4.
Simulated r-weighted back projection with rotational symmetry on test models. Shown are test models containing 14 (A), 13 (B), and 12 (C) microfibrils. Computed reconstructions for different angular ranges and rotational symmetry values (S) are as indicated. The angular sampling interval is 4° in all simulations. The simulations show that inappropriate values of S for each model do not generate meaningful reconstructions. The reconstructions with appropriate S values are marked with an a. The outer core of model C is, however, close enough to a 9-fold rotational symmetry to yield an interpretable S = 9 reconstruction (indicated by b).
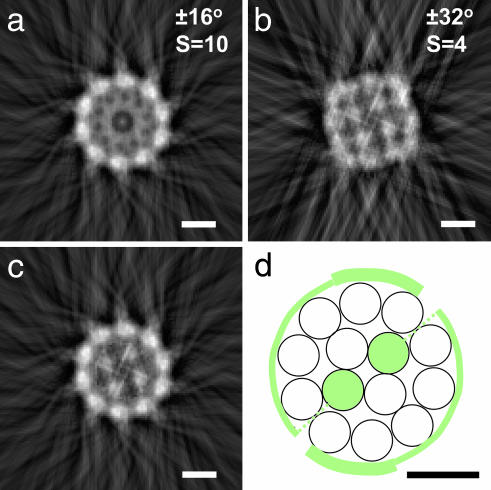
Fig. 5 shows the results of applying these approaches to EM images of cartilage fibrils. Analyses over a range of rotational symmetries (S values) showed that no one single value revealed both the inner core and outer shell structures. However, strong maxima corresponding to individual microfibrils at the fibril surface where obtained when S = 10, suggesting that the fibril surface was constructed from 10 uniformly spaced microfibrils. In contrast, four strong maxima at the fibril core were obtained with an S value of 4, indicative of a core of four uniformly spaced microfibrils.
Fig. 5.
Experimental reconstructions (a–c) of the transverse section of a negatively stained thin cartilage fibril together with proposed model structure (d) are shown. Images a and b were obtained by r-weighted back-projection from angle-limited tilt series using S = 10 and S = 4 rotational symmetry. The transverse reconstructions were averages over 8 nm along the fibril axis. The outer core image in a has been combined with the inner core image in b to generate the composite image in c. The diameter of the fibril was measured as 15 nm and the center-to-center microfibrillar spacings were measured as 3.8 and 3.9 nm for the outer and inner cores, respectively. (d) Schematic model shows the transverse structure of the thin cartilage fibril. This transverse section corresponds to the axial location of the nontriple helical component of the α1(XI) N-propeptide. The structural components are five-stranded microfibrils of collagen type II (open circles) and collagen type XI (green). Each microfibril of type XI collagen would result in one N-propeptide per D-period. The hypothetical circumferential extent of these domains are shown. The dotted lines show the projection of the tilted minor triple helix of the N-propeptides. (Scale bars: 5 nm.)
Determination of Lateral Structure Using Helical Symmetry Methods.
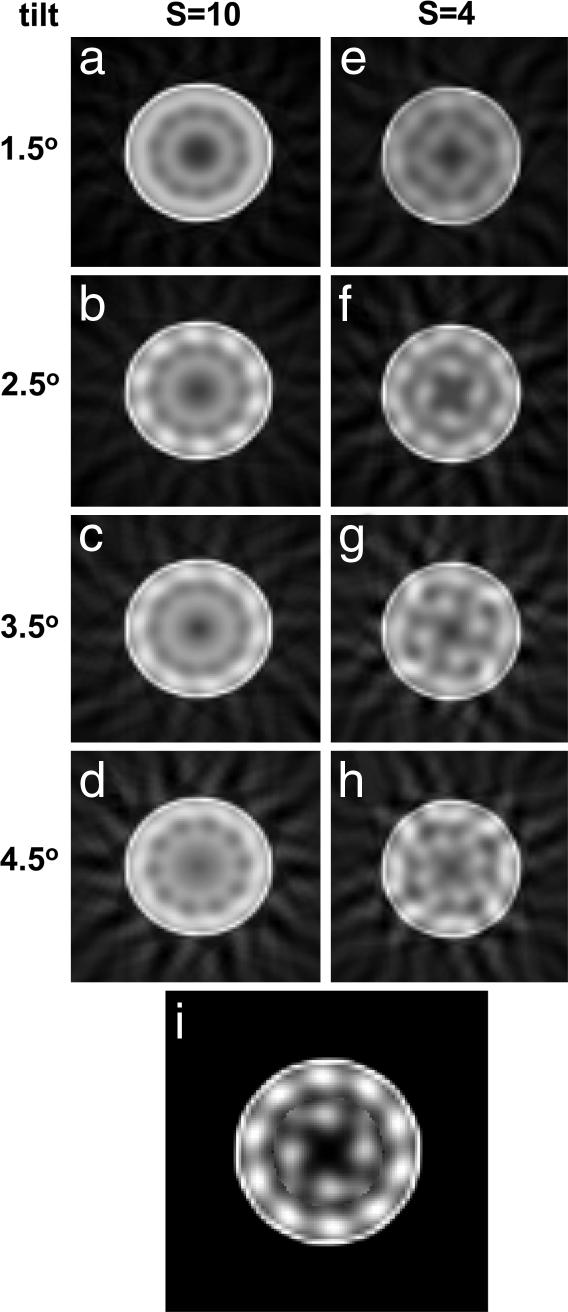
Tilting microfibrils are apparent in EM images of thin cartilage fibrils, indicating a twisted structure. Direct measurements from EM images suggest a tilt of ≈3° (data not shown). Therefore, as an additional method for investigating the microfibrillar substructure, we obtained a series of projections at equal intervals along a single collagen fibril. These were used to generate a weighted back-projection reconstruction for a range of tilts. The results confirmed the presence of an inner core and outer shell of microfibrils (Fig. 6). The best-fit results were obtained for an outer shell of 10 microfibrils tilted at 2.5° and an inner core of four microfibrils tilted between 2.5° and 3.5°.
Fig. 6.
Experimental r-weighted back-projection reconstructions from single zero-tilt images of a negatively stained thin cartilage fibril based on helical and rotational symmetry are shown. (a–d) A set of four reconstructions appropriate for S = 10 and a outer microfibrillar tilt ranging from 1.5° to 4.5° in steps of 1° is shown. The outer microfillar core is apparent in the reconstruction appropriate to a 2.5° tilt. This tilt value was also observed directly in some images of negatively stained fibrils. (e–h) A set of four reconstructions appropriate for S = 4 and an inner microfibrillar tilt ranging from 1.5° to 4.5° is shown. The four-component microfibril structure is most clearly seen in the 3.5° tilt reconstruction. (i) A composite image, combining the outer core of image b with the inner core of image g, is shown.
Simple Structural Model Consistent with Experimental Data.
Fig. 5d shows a simple structural model that incorporates the proposed 10+4 microfibril structure of the thin (15 nm) diameter fibrils in embryonic chick cartilage and the M/L and collagen molecular composition data. The two collagen XI N-propeptides per fibril D-period are of sufficient length (beyond the minor triple helix) to encompass the circumference of the fibril. The microfibrils are shown in a nonregular array as no data are available to indicate the precise packing arrangement or extent of lateral packing order. The simplest case of homotypic microfibrils has been considered; the possibility of heterotypic microfibrils, with, for instance, some microfibrils formed of both collagen II and XI collagens, cannot be excluded. It is not possible to distribute 10 molecules of collagen XI evenly between the four inner-core microfibrils. It has not escaped our attention that the 10 molecules of collagen XI (per D-period) could be evenly distributed between the surface microfibrils. This molecular arrangement does, however, go against immuno-EM data suggesting that the major triple helices of collagen XI molecules are located within the fibril.
Discussion
In the present study we have obtained indications that the thin fibrils in cartilage are constructed from 14 tilted 4-nm-diameter microfibrils in a 10+4 arrangement. Microfibrils from both the outer shell and inner core are tilted by ≈3° to the fibril axis. The results are discussed in the context of a constant tilt model.
The 10+4 model can be compared with the concentric molecular packing model proposed by Blaschke et al. (15) for thin heterotypic fibrils composed of collagen II and XI. Their model was based on the observation of thin fibrils of ≈20-nm diameter (as measured on negatively stained and dehydrated samples) that were reconstituted from mixtures of purified collagen II and XI collagen in the molar ratio 8:1. The fibril model of Blaschke et al. has a ≈2.5-fold greater lateral size (M/L) than that observed for the thin cartilage fibrils of the present study. This greater lateral size leads to six collagen XI N-propeptides (surface-located) per D-period compared with only two in the 10+4 model. The model of Blaschke et al. hypothesized that the major helical domain of collagen XI molecules is tilted with respect to the fibril axis such that the C terminus forms an inner core of the fibril and the N-propeptides were constrained to the fibril surface. This scheme has similarities with our model but we propose that only the minor triple helix of collagen XI projects to the fibril surface. The 10+4 model, combined with the predicted diameter of 16 nm for the hydrated fibril (from the presented M/L data and published x-ray scattering data), gives a fibril circumference of 48 nm. Evidence from structural studies of the N-propeptide of α1(XI) suggests that the nontriple helical domains have a linear extent of ≈24 nm (8). Therefore, in the 10+4 model proposed here the surface-located collagen XI N-propeptides would encompass the circumference of the fibril. These surface components presumably stabilize the fibril diameter by preventing further lateral accretion of collagen molecules. Our prediction for the diameter of the hydrated thin fibrils (16.1 nm) agrees well with the value (16 nm) predicted from x-ray fiber diffraction of lamprey notochord, which is rich in cartilage-like collagen fibrils (20).
The 10+4 microfibril structure is consistent with an assembly mechanism that generates 16-nm-diameter thin cartilage fibrils despite variations in the ratio of ambient collagen II/XI molecules. Evidence from the cho/cho mouse (in which the absence of collagen XI results in loss of thin fibrils) and transgenic mice overexpressing collagen II (in which narrow fibrils persist but the thick fibrils are very thick) shows that the assembly of the thin fibrils is insensitive to the ratio of collagen II/XI, as long as some collagen XI is present. Furthermore, the cartilage of mice heterozygous for a Col11a1 loss-of-function mutation contains a population of thin fibrils, as in the WT control, but also an additional population of thick fibrils (21). This finding suggests to us that microfibrils containing collagen XI are the nucleus for accretion of collagen II microfibrils. We propose that the inner core of 2+2 (II and XI) microfibrils leads the axial growth of the fibril tips. The lateral (diameter) growth of the fibrils is determined by the ring of 10 collagen II microfibrils and the surface-located N-propeptides of collagen XI.
It is generally assumed, based on EM observations of rotary-shadowed thin cartilage fibrils, that the COL3 domain of collagen IX with the attached NC4 domain project radially away from the fibril surface. For example, Vaughan et al. (6) have visualized these domains projecting at various angles from the fibril surface using the spray glycerol/rotary shadowing procedure on fibrils extracted from chick embryonic sternum. The number of these domains visualized per D-period can be estimated from published images of Vaughan et al. as three to four, which is consistent with the present model containing four molecular strands of collagen IX, which predicts four COL3/NC4 domains per fibril D-period. In the present study, however, no projecting COL3/NC4 domains were observed and modeling of the axial stain pattern indicated a folded conformation of the COL3 along the fibril axis.
Evidence from a number of sources has suggested that fibrils containing collagen I are constructed from microfibrils (for example, see ref. 22). Moreover, the microfibrils at the fibril surface are suggested to be titled by ≈17°. In addition, electron tomography of corneal collagen fibrils (containing predominantly collagen I) also showed inner microfibrils with the same tilt (23). Therefore, the pitch of the inner and outer microfibrils must be different. The inner and outer microfibrils in the thin cartilage fibrils also have approximately the same tilt (≈3°), indicative of a near-constant tilt model although at much reduced tilt compared with the type I fibril.
Materials and Methods
Sample Preparation.
Cartilage fibrils were isolated from 14-d chick embryonic sterna. After dissection, the sterna were crushed in liquid nitrogen, and the resulting powder was dispersed in 50 mM Tris·HCl buffer (pH 7.4) containing 50 mM EDTA, 100 mM sucrose, and 150 mM NaCl (24). Fibrils were adsorbed to holey carbon films (hole diameter, 2 μm; Quantifoil, Jena, Germany) washed with buffer followed by ultra-pure water (Purite, Oxon, UK). For STEM the grids were lifted through a floating carbon film and air-dried. Sample grids for TEM were stained with 4% uranyl acetate in 1% aqueous trehalose followed by drying at 70% relative humidity to leave the fibrils embedded in a stable stain/trehalose layer over the holes. Protease treatment of isolated cartilage fibrils was performed on fibrils bound to holey carbon films by using a 2-min exposure to trypsin (1 mg/ml) and chymotrypsin (2.5 mg/ml) in Tris-buffered saline, 50 mM Tris·HCL, 150 mM NaCl, pH 7.4.
Measurement of M/L.
STEM annular dark-field images of unstained fibrils were obtained on a Tecnai 12 TEM/STEM instrument (Electron Optics, Eindhoven, The Netherlands), equipped with a high-angle, dark-field detector and digital scan generator. The instrument was operated at 120 kV and camera length was set to 350 mm, corresponding to an angular collection range of 15–75 milliradians. Images of size 1,024 × 1,024 were acquired at a electron dose of ≈1,000 e/nm2 on the specimen. Mass per unit measurements were made from ADF images of unstained fibrils essentially as described (25) using Semper6 software (Synoptics, Cambridge, UK). Tobacco mosaic virus was used as a standard of M/L (131 kDa/nm). Mass loss curves were generated and used for correction of M/L.
Experimental Determination of the Fibril Axial Negative Stain Pattern.
The average D-periodic negative ASEP was obtained from TEM images of dispersed fibrils as described (17). The instrument was operated at an accelerating voltage of 120 kV, and micrographs were recorded at a nominal magnification of ×20k.
Theoretical Stain Exclusion Patterns.
The basis for the prediction of axial stain patterns of collagen I fibrils was established by Chapman et al. (26) who showed a high correlation between “bulkiness” of amino acid residues with the exclusion of negative stain. Theoretical ASEPs were generated by using this approach for heterotypic fibrils containing collagen types II, IX, and XI as described (17). Briefly, axial contraction factors were compared with the residue spacing in the triple-helical domain of 0.3 and 0.7 and applied to the N- and C-telopeptide domains, respectively, of both collagen II and XI. An axial contraction factor of 0.6 was used for the three globular NC domains of collagen IX. Adjustment was made for the effects of glycosylation of hydroxylysine residues at levels of 50%, 100%, and 50% for collagen II, IX, and XI, respectively, as described (17).
Calculation of Theoretical M/L of a Heterotypic Fibril.
The theoretical M/L of a collagen I fibril has previously been expressed (27) as: M/L = n*(M/5D) kDa/nm, where n is the number of single molecular strands in the fibril, M kDa is the mass of a collagen molecule, and 5D nm is the axial extent of a single molecule in each strand. This expression is also appropriate for the separate contributions of collagen II and XI. In the case of collagen IX, each molecule extends axially over 2D periods, and the contribution of M/L is given by: M/LIX = nIX*(MIX/2D) kDa/nm, where nIX is the number of molecular strands of collagen IX and MIX kDa is the molecular mass of the collagen IX. The molecular masses of processed collagen II, IX, and XI were calculated as 300, 200, and 380 kDa, respectively, with a correction (1–2%) for the estimated glycosylation of hydroxylysine.
Calculation of Effective Hydrated Diameter for Model Fibril.
The effective hydrated diameter of the heterotypic fibril (assuming a circular cross-section) can be calculated from the number of collagen molecules in transverse section if the packing density is known. The mean intermolecular spacing in collagen fibrils of uncompressed human cartilage can be estimated as 1.865 nm from measurements of the equatorial x-ray scattering (16). If the number of triple-helical domains in a transverse section through the fibril = N, then the diameter (Deff nm) of the fibril is then given by: nm (28).
Tilt Series Acquisition.
Tilt series were collected on a Tecnai 12 TEM using an automated procedure (TVIPS, Gauting, Germany). Images (1,024 × 1,024) were recorded on an on-axis cooled CCD camera (TemCam F214A, TVIPS).
Transverse Structure Reconstruction.
The transverse structure of fibrils was computed by r-weighted back projection of projections after reference-free alignment using Semper6.
Acknowledgments
Tobacco mosaic virus was kindly donated by Dr. T. Parr, University of Cambridge, Cambridge, UK. This work was supported by the Wellcome Trust.
Abbreviations
- M/L
mass per unit length
- ASEP
axial stain exclusion pattern
- STEM
scanning transmission EM
- TEM
transmission EM.
Footnotes
The authors declare no conflict of interest.
References
- 1.Parry DAD, Craig AS. In: Ultrastructure of the Connective Tissue Matrix. Ruggeri A, Motta PM, editors. Boston: Martinus Nighoff; 1984. pp. 34–64. [Google Scholar]
- 2.Mendler M, Eich-Bender SG, Vaughan L, Winterhalter KH, Bruckner P. J Cell Biol. 1989;108:191–197. doi: 10.1083/jcb.108.1.191. [DOI] [PMC free article] [PubMed] [Google Scholar]
- 3.Keene DR, Oxford JT, Morris NP. J Histochem Cytochem. 1995;43:967–979. doi: 10.1177/43.10.7560887. [DOI] [PubMed] [Google Scholar]
- 4.Hartmann DJ, Magloire H, Ricard-Blum S, Joffre A, Couble ML, Ville G, Herbage D. Collagen Rel Res. 1983;3:349–357. doi: 10.1016/s0174-173x(83)80016-8. [DOI] [PubMed] [Google Scholar]
- 5.Muller-Glauser W, Humbel B, Glatt M, Strauli P, Winterhalter KH, Bruckner P. J Cell Biol. 1986;102:1931–1939. doi: 10.1083/jcb.102.5.1931. [DOI] [PMC free article] [PubMed] [Google Scholar]
- 6.Vaughan L, Mendler M, Huber S, Bruckner P, Winterhalter KH, Irwin MI, Mayne R. J Cell Biol. 1988;106:991–997. doi: 10.1083/jcb.106.3.991. [DOI] [PMC free article] [PubMed] [Google Scholar]
- 7.Eyre DR. Clin Orthop Relat Res. 2004:S118–22. doi: 10.1097/01.blo.0000144855.48640.b9. [DOI] [PubMed] [Google Scholar]
- 8.Fallahi A, Kroll B, Warner LR, Oxford RJ, Irwin KM, Mercer LM, Shadle SE, Oxford JT. Protein Sci. 2005;14:1526–1537. doi: 10.1110/ps.051363105. [DOI] [PMC free article] [PubMed] [Google Scholar]
- 9.Bishop PN, Holmes DF, Kadler KE, McLeod D, Bos KJ. Invest Ophthalmol Visual Sci. 2004;45:1041–1046. doi: 10.1167/iovs.03-1017. [DOI] [PubMed] [Google Scholar]
- 10.Seegmiller R, Fraser FC, Sheldon H. J Cell Biol. 1971;48:580–593. doi: 10.1083/jcb.48.3.580. [DOI] [PMC free article] [PubMed] [Google Scholar]
- 11.Li Y, Lacerda DA, Warman ML, Beier DR, Yoshioka H, Ninomiya Y, Oxford JT, Morris NP, Andrikopoulos K, Ramirez F, et al. Cell. 1995;80:423–430. doi: 10.1016/0092-8674(95)90492-1. [DOI] [PubMed] [Google Scholar]
- 12.Annunen S, Korkko J, Czarny M, Warman ML, Brunner HG, Kaariainen H, Mulliken JB, Tranebjaerg L, Brooks DG, Cox GF, et al. Am J Hum Genet. 1999;65:974–983. doi: 10.1086/302585. [DOI] [PMC free article] [PubMed] [Google Scholar]
- 13.Korkko J, Cohn DH, Ala-Kokko L, Krakow D, Prockop DJ. Am J Med Genet. 2000;92:95–100. doi: 10.1002/(sici)1096-8628(20000515)92:2<95::aid-ajmg3>3.0.co;2-9. [DOI] [PubMed] [Google Scholar]
- 14.Garofalo S, Metsaranta M, Ellard J, Smith C, Horton W, Vuorio E, de Crombrugghe B. Proc Natl Acad Sci USA. 1993;90:3825–3829. doi: 10.1073/pnas.90.9.3825. [DOI] [PMC free article] [PubMed] [Google Scholar]
- 15.Blaschke UK, Eikenberry EF, Hulmes DJ, Galla HJ, Bruckner P. J Biol Chem. 2000;275:10370–10378. doi: 10.1074/jbc.275.14.10370. [DOI] [PubMed] [Google Scholar]
- 16.Maroudas A, Wachtel E, Grushko G, Katz EP, Weinberg P. Biochim Biophys Acta. 1991;1073:285–294. doi: 10.1016/0304-4165(91)90133-2. [DOI] [PubMed] [Google Scholar]
- 17.Bos KJ, Holmes DF, Kadler KE, McLeod D, Morris NP, Bishop PN. J Mol Biol. 2001;306:1011–1022. doi: 10.1006/jmbi.2000.4429. [DOI] [PubMed] [Google Scholar]
- 18.Kadler KE, Holmes DF, Trotter JA, Chapman JA. Biochem J. 1996;316:1–11. doi: 10.1042/bj3160001. [DOI] [PMC free article] [PubMed] [Google Scholar]
- 19.Baldock C, Gilpin CJ, Koster AJ, Ziese U, Kadler KE, Kielty CM, Holmes DF. J Struct Biol. 2002;138:130–136. doi: 10.1016/s1047-8477(02)00028-x. [DOI] [PubMed] [Google Scholar]
- 20.Eikenberry EF, Childs B, Sheren SB, Parry DA, Craig AS, Brodsky B. J Mol Biol. 1984;176:261–277. doi: 10.1016/0022-2836(84)90424-8. [DOI] [PubMed] [Google Scholar]
- 21.Xu L, Flahiff CM, Waldman BA, Wu D, Olsen BR, Setton LA, Li Y. Arthritis Rheum. 2003;48:2509–2518. doi: 10.1002/art.11233. [DOI] [PubMed] [Google Scholar]
- 22.Raspanti M, Ottani V, Ruggeri A. Int J Biol Macromol. 1989;11:367–371. doi: 10.1016/0141-8130(89)90009-3. [DOI] [PubMed] [Google Scholar]
- 23.Holmes DF, Gilpin CJ, Baldock C, Ziese U, Koster AJ, Kadler KE. Proc Natl Acad Sci USA. 2001;98:7307–7312. doi: 10.1073/pnas.111150598. [DOI] [PMC free article] [PubMed] [Google Scholar]
- 24.Graham HK, Holmes DF, Watson RB, Kadler KE. J Mol Biol. 2000;295:891–902. doi: 10.1006/jmbi.1999.3384. [DOI] [PubMed] [Google Scholar]
- 25.Holmes DF, Graham HK, Trotter JA, Kadler KE. Micron. 2001;32:273–285. doi: 10.1016/s0968-4328(00)00040-8. [DOI] [PubMed] [Google Scholar]
- 26.Chapman JA, Tzaphlidou M, Meek KM, Kadler KE. Electron Microsc Rev. 1990;3:143–182. doi: 10.1016/0892-0354(90)90018-n. [DOI] [PubMed] [Google Scholar]
- 27.Holmes DF, Chapman JA, Prockop DJ, Kadler KE. Proc Natl Acad Sci USA. 1992;89:9855–9859. doi: 10.1073/pnas.89.20.9855. [DOI] [PMC free article] [PubMed] [Google Scholar]
- 28.Chapman JA. Biopolymers. 1989;28:1367–1382. doi: 10.1002/bip.360280803. [DOI] [PubMed] [Google Scholar]


