Abstract
Myxobacterial cells are social; they swarm by gliding on surfaces as they feed cooperatively. When they sense starvation, tens of thousands of cells change their movement pattern from outward spreading to inward concentration and form aggregates that become fruiting bodies. Cells inside fruiting bodies differentiate into round, nonmotile, environmentally resistant spores. Traditionally, cell aggregation has been considered to imply chemotaxis, a long-range cell interaction that shares many features of chemical reaction–diffusion dynamics. The biological evidence, however, suggests that Myxococcus xanthus aggregation is the consequence of direct cell-contact interactions that are different from chemotaxis. To test whether local interactions suffice to explain the formation of fruiting bodies and the differentiation of spores within them, we have simulated the process. In this article, we present a unified 3D model that reproduces in one continuous simulation all the stages of fruiting-body formation that have been experimentally observed: nonsymmetric initial aggregates (traffic jams), streams, formation of toroidal aggregates, hemispherical 3D mounds, and finally sporulation within the fruiting body.
Keywords: aggregation, lattice gas, myxobacteria, pattern formation
One fundamental problem in cell biology is how cells assemble organs and tissues that consist of properly positioned differentiated cells. The decisions to differentiate often depend on local interactions among those cells (1). Although the complex interactions among cells in animal organogenesis have received the most attention, genetic programs for differentiation also are found in bacteria. One of the most accessible systems for the study of development is the delta proteobacterium Myxococcus xanthus. Myxobacteria are found in cultivated soils all over the earth. Their biological success is due to social behavior that resembles that of the cellular slime molds and, to some extent, the development of animals and plants (2).
Two types of mathematical models can be applied to biological problems: continuous models, which use families of differential or integro-differential equations to describe “fields” of interaction, and discrete models, in which space, time, or state may be discrete. Either type may be deterministic or stochastic. Discrete models can describe the behavior of individual cells in a population, and stochastic biological Lattice Gas Cellular Automaton (LGCA) models are versatile, readily designed, and rapidly evaluated. Biological LGCA employ a regular, finite lattice and include a finite set of cell states, an interaction neighborhood, and probabilistic local rules that determine the cells' movements and transitions between states (for a review, see ref. 3).
Our earlier LGCA model, based on simplified point representations for cells and incorporating local cell–cell contact signaling, succeeded in reproducing the streaming and early aggregation phases of myxobacterial development (4, 5). Here, we present a unified 3D stochastic biological LGCA model of fruiting-body formation with extended cell representation. This model adds important components to our previous model (6), such as spores and slime. These new features include C-signal-level-dependent sporulation, passive spore transport, and the effects of slime on gliding motility. The model reproduces in one continuous simulation all the experimentally observed stages of fruiting-body formation: nonsymmetric initial aggregates (traffic jams), streams, formation of toroidal aggregates, hemispherical 3D mounds, and finally sporulation within the fruiting body.
Myxobacteria move by gliding across the surface of soil particles or of agar in the laboratory. In soil they feed on colonies of other bacteria like packs of microbial wolves; myxobacterial cells surround a colony and secrete hydrolytic enzymes that digest the prey. Because myxobacteria compete with many other micropredators in soil, their food supply is often depleted. As they approach nutrient depletion, M. xanthus stop growing and use a quorum sensor to evaluate the local cell density. Given a quorum, tens of thousands of cells undertake an organized, collective effort that culminates in the formation of a spore-filled fruiting body. How is the morphogenesis of a fruiting body programmed? Experiments have suggested several important elements.
Motility.
Myxobacterial cells are elongated, flexible rods with a 7:1 length-to-width ratio: typically 2–12 × 0.7–1.2 μm (7). They have no flagella and are unable to swim. Instead, cells move on surfaces by gliding along their long axis (8). They move in one direction for a while before smoothly reversing their direction of movement (9). Reversals can have a constant period with little variation (10). Two molecular motors, retractile type IV pili at their leading end (S-motility) (11) and jets for secreting a slime gel at the trailing end (A-motility) (12), provide gliding thrust. The slime-secretion engine can be considered a model; additional evidence can be found in ref. 14 (also R. Yu and D.K., unpublished data). Although reversals are not included in the model described here, they are needed for the traveling waves that preceded aggregation. Recently, we have shown that the model produces aggregates and spores even if reversals are included. Reversals of gliding direction requires, in addition to the two motors, the small G protein mglA (13, 14). MglA mutants have been said to hyper-reverse (15), but this is misleading. In fact, they secrete slime from both poles and oscillate rapidly back and forth at very low amplitude. The oscillations are due to statistical fluctuations in secretion, not to changes in polarity (16).
Signaling.
Two modes of cell–cell communication for myxobacterial fruiting-body development are unique. First, they employ diffusible amino acids for quorum-sensing (the A-signal) to certify the presence of enough cells to complete a fruiting body. Quorum sensors in most bacteria are homoserine lactones like AI-1 (17). Second, the cell-surface-bound C-signal is exchanged during contacts between cells. Cells switch from frequent reversal, which results in ripple patterns, to unidirectional streaming when the level of C-signaling rises to a threshold (18). Cells respond to a still higher level of the C-signal by differentiating into spores. Understanding myxobacterial fruiting-body formation provides insight into collective behavior governed by cell-contact C-signaling.
C-Signal.
The C-signal, a 17-kDa cell-surface-associated protein (19), coordinates cell movement during fruiting-body development. C-signal is exchanged when a pair of cells makes end-to-end contact (20); side-by-side and end-by-side contacts do not exchange signal. Biochemical evidence that a cell has received C-signal is the phosphorylation of Fru A, a response regulator (21). Increasing levels of C-signal, encoded by the csgA gene, induce increasing amounts of FruA-P and the different stages of fruiting-body formation (22–24). Expression of csgA is controlled by a feedback loop involving the act operon (25). When development starts, there are few C-signal molecules per cell, and cells making end-to-end contact respond to signal exchange by reversing their direction of gliding (10). Each time C-signal is exchanged, the positive feedback loop increases expression of csgA and elevates the number of signal molecules on signaling cells. After cells have accumulated more C-signal molecules due to positive feedback, they respond not by reversing in response to C-signal exchange but by suppressing reversal and continuing to move in the direction they did before signaling. When the end of one cell nudges the cell ahead of it and the two cells signal each other, the cells move as a chain (18). This chain of many cells moving in the same direction constitutes a stream.
Aggregation.
An aggregate can be nucleated by a stationary traffic jam that involves hundreds of cells (26). When cells moving in opposite directions happen to meet in a small area, they stall at the points of collision if they are prevented from turning by other cells at their sides or behind them. In a submerged culture (27), cells settle on the bottom of the culture dish as domains (the facet pattern) in which the cells align roughly parallel to one another within each domain and different domains have different orientations. Traffic jams form at the intersections of two such domains. Traffic jams also form at the intersections of three ridges of high cell density in submerged agar culture (26). Such jammed cells remain stationary for several hours. Both types of traffic jams serve as nuclei for enlargement by streams. As a stream of cells encounters a traffic jam that the stream is unable to penetrate, the stream turns to glide over or around the traffic jam, treating it simply as an obstruction. The stream of cells must bend as it passes over or around the jam, and the persistence of the bent shape produces a roughly circular orbit. Cells moving in an orbit are thought to continue to C-signal, and more positive feedback raises the C-signal level until this population of cells have reached threshold levels of C-signal for differentiation into spores, which has been observed experimentally (22, 23, 25). When rod cells become spores, they lose the capacity to move on their own (28). Although spores cannot glide, adjacent motile rod-shaped cells push the spores out of their way. The net effect results in displacement of the spores toward the center of the fruiting body, where they accumulate. At the beginning of sporulation the cell density in the center is one-third the density in the outer region (29).
Fruiting-Body Formation.
We have previously demonstrated by simulation that signaling by contact between M. xanthus cells is sufficient to produce hemispherically mounded aggregates (6). When the traffic jam at the center of a mound resolves, those cells join the other streaming and signaling cells in the aggregate, which then becomes a motile toroid of cells. Toroids fit Sager's observation of two distinctive density domains in the fruiting body (29).
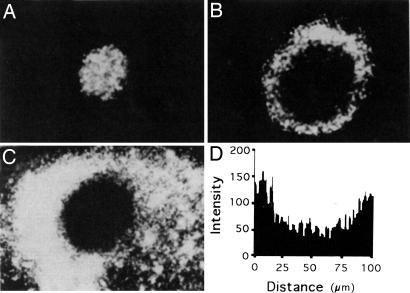
Fig. 1, which shows a wild-type fruiting body after 24 h of development, was obtained by using fluorescence confocal microscopy at its base and at 20 and 6 μm above the base of a fruiting body. Recently, Lux et al. (30) have confirmed Sager's observations by confocal microscopy. Models based on local cell–cell contact signaling have reproduced the streaming and early aggregation phases of myxobacterial development (4, 5). Here, we present an extended model of the fruiting-body formation, which includes slime production, C-signal-level-dependent cell differentiation into spores, and passive spore transport to simulate the complete cycle of the fruiting body formation.
Fig. 1.
3D structure of a nascent fruiting body. (A–C) Fluorescence confocal microscopy of optical sections at 20 μm above the base (A), 6 μg above the base (B), and at the base (C) of a representative wild-type fruiting body after 24 h of development. (D) Quantitative gray-scale intensity scan along a diameter of the confocal section shown in B. Lighter shades correspond to greater fluorescence (greater cell density). [Reproduced with permission from ref. 29. (Copyright 1993, The National Academy of Sciences of the USA).]
Discussion of Simulation Results.
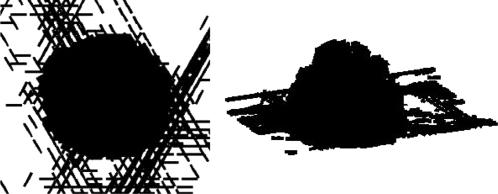
Two early stages of fruiting-body formation, traffic jam or early asymmetric aggregate and motile aggregate, were captured and described in our previous work (6). Our latest simulations obtained by using the model described here demonstrate that the early aggregate, nucleated by a traffic jam, starts rounding up when streaming cells climb over it and descend on the other side. The cells circulate around and climb over the traffic jam and eventually cover the entire surface of the traffic jam. Some of the cells then penetrate the interface between the bottom of the jam and the substrate, lifting the jam up. Some cells in the traffic jam bend and leave, joining the outer domain of the aggregate. The aggregate keeps enlarging, and the nascent fruiting body with a hollow center is soon formed, which serves as the site of spore accumulation. In the experiments, the nascent fruiting body is formed after 24 h of starvation. It is formed after 2,800 time steps in our simulation (Fig. 2), therefore providing an estimate for one simulation time step as 30 sec.
Fig. 2.
Nascent fruiting body, formed after 2,800 time steps (correspond to 24 h in myxobacteria experiments). (Left) Top view. (Right) Side view.
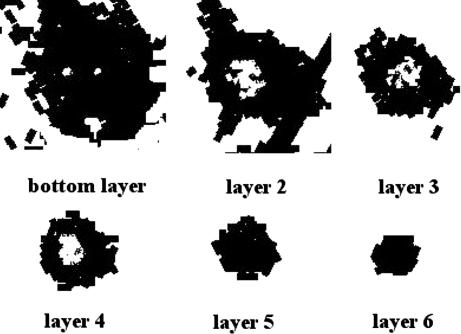
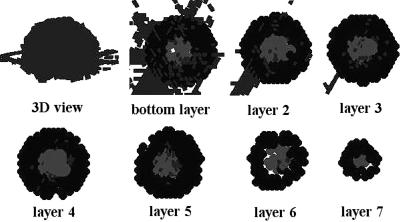
The internal structure of a simulated fruiting body is shown in Fig. 3. The uniform cell density in the top layers (layers 5 and 6) is similar to the structure observed in confocal microscopy at 20 μm above the fruiting-body base (see Fig. 1A). The simulated nascent fruiting body has a hollow center (layers 2, 3, and 4) because of space vacated as a result of the resolution of the traffic jam. This low-density center corresponds to the experimentally observed structure at 6 μm above the base of a fruiting body (see Fig. 1B).
Fig. 3.
The internal structure of a simulated nascent fruiting body. Lighter shades correspond to lower cell densities.
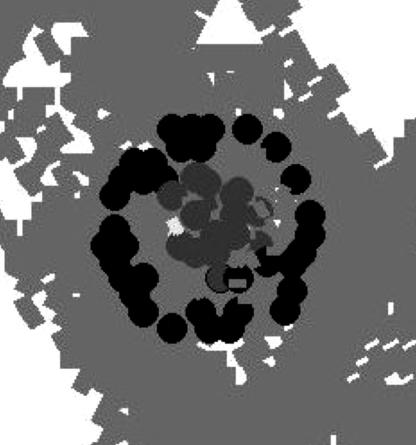
As cells in the high-density outer domain of a nascent body circulate around the hollow center, they make end-to-end contact and transmit the C-signal to one another. Signaling causes the number of C-signal molecules on the surface of the cell to rise. Eventually the C-signal level rises to the threshold for sporulation, and the cells differentiate into spores. The round spores are incapable of moving on their own, but they can be pushed by the neighboring motile rod-shaped cells. In the simulations, outer spores born in the outer domain are passively transported to the inner domain, where they become inner spores. Fig. 4 shows the bottom layer of the fruiting body after 20 time steps (or 10 min after sporulation begins).
Fig. 4.
Bottom level of the aggregate after the start of sporulation (after 2,820 time steps). Darker circles represent the outer spores, whereas lighter circles are inner spores delivered by motile rod-like cells to the inner domain.
Due to the transport of spores from the outer domain and the continuing movement of the rod cells, the density of rod-like cells remains constant. Therefore, spores are produced at a constant rate, as observed in Fig. 5. The spore transport rate also appears to be constant because as the number of cell layers in the outer domain shrinks and with more and more rods differentiating into spores, the cell density in each layer remains constant.
Fig. 5.
Rates of cell differentiation from motile rods to round nonmotile spores.
With cell sporulation occurring nonstop, the fruiting body matures. Fig. 6 shows the simulated fruiting body at 5,800 time steps (which correspond to ≈48 h).
Fig. 6.
Maturing fruiting body at 5,800 time steps (which corresponds to ≈48 h). Both outer and inner domains are closely packed with spores. Inner spores have lighter shades of gray.
This mature fruiting body consists primarily of closely packed outer and inner spores with a few motile rod-like cells that are on their way to sporulation.
Conclusions
A unified 3D LGCA model described here reproduces all the stages of fruiting-body formation that have been experimentally observed: nonsymmetric initial aggregates (traffic jams), streams, formation of toroidal aggregates, hemispherical 3D mounds, and finally sporulation within the fruiting body.
The model tests the sufficiency of the biologically motivated assumptions about fruiting-body formation, including the motility engines and C-signaling. The simulations confirmed that rod-like cells can form streams that deliver hundreds of thousands of cells to growing aggregates. The streaming of rod-like cells was found to be strong enough to lift the mound and to transform it into a sphere.
We demonstrated that the internal structure of a simulated fruiting body qualitatively coincided with the findings of confocal microscopy. In particular, the internal organization of a simulated fruiting body corresponded to the observation of two distinctive domains: a low-density inner domain and a motile, densely packed shell-like outer domain. We also showed that proposed passive spore transport mechanism, provided by circling rod-like cells, results in the delivery of spores to an aggregate's inner area, where they accumulate and form a mature fruiting body.
Because it captures all stages of fruiting body formation, our 3D computational model might serve as a tool for analyzing proposed mechanisms for building multicellular structures dependent on cell contact signaling without chemotaxis. Also, this model should be capable of simulating the competition between normal and cheating mutant cells by varying the cell's motility and ability to accumulate C-signal.
Computational Model.
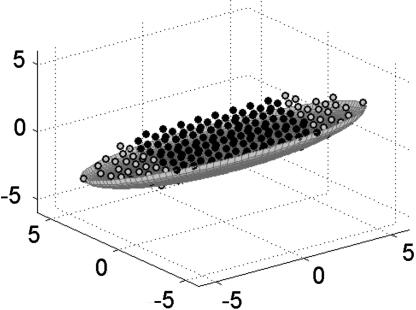
Our 3D biological LGCA model is based on local rules that have been suggested by the experiments with M. xanthus described above. The model deals with cell movement, C-signaling, slime-trail following, and sporulation. The cell body is represented by an array of pixels on a 3D hexagonal lattice that is generated automatically when the geometric shape, orientation, and size of the cell are given. For this study we approximate rod cells as ellipsoids (see Fig. 7) and spores as spheres of the same volume.
Fig. 7.
A single myxobacterial cell body (dark dots) with its signaling poles (light dots) as arrays of pixels on a 3D hexagonal lattice contained in an ellipsoid of particular size. The surface of the cell is indicated by gray coloration.
Each cell has two poles: a head and a tail, whose sizes, as well as cell size itself, can be varied. For the simulations reported here, cells that are 11.0 μm in length and 2.4 μm in diameter were used. On a 3D hexagonal lattice each node has 12 nearest neighbors.
The long axis of each cell has 12 possible orientations (or channels). By an exclusion rule of the model, there can be only one cell center of mass per node per channel. Thus, a maximum 12 cell centers, each occupying a different channel, can occupy a single node on the lattice. Apart from the centers, nodes occupied by the extended cell bodies can overlap. As mentioned above, real myxobacteria are flexible and can turn by bending at small angles. The hexagonal lattice constrains this small turning angle to 60°. Cells are allowed to climb over one another and to glide down the other side to embody the fact that myxobacteria move only by gliding on a surface, as described in Motility. A cell moves to an upper layer only if all neighboring nodes in the current layer are occupied, and it moves preferentially in the direction that maximizes the overlap of its pole area with the slime density in the immediate neighborhood. We do not model slime explicitly but instead use a mathematical measure of the slime density field. The field describes the amount of slime deposited by other cells at each location. A sequence of adjacent lattice sites with large amounts of slime indicates a slime trail. An individual cell responds to the slime field by adjusting its orientation to align with the slime trails.
Cells align with one another as they follow slime trails laid down by other cells. At each time step, we first calculate the probabilities of all possible reorientations of a particular cell as a function of the amount of overlap of its head pole with the slime density field. The field records the total number of slime trails that crossed the node at the previous time step. A cell can turn by 60° in the 3D hexagonal lattice or preserve its current orientation. The probability of choosing orientation (i) is
where β is an alignment parameter, Z is the normalization factor (Z = Σi Pi), and C(i) describes the overlap between the leading pole of the current cell oriented along the i-th direction and slime trails of cells in the neighborhood. Cells are allowed to climb over one another and to glide down the other side. A cell moves up one layer only if all neighboring nodes in the current layer are occupied. This condition embodies the fact that M. xanthus moves only when it is in contact with a surface, as described above.
Also, the poles of a cell are the only C-signaling-sensitive areas. In the model, C-signaling occurs when the end of one cell overlaps with the end of another cell. After each cell–cell interaction, the C-signal level in both cells increases by 1 unit. The threshold level of C-signal serves as a developmental clock. Above a threshold value of accumulated C-signal, a rod cell differentiates into a nonmotile round spore. To preserve the cell volume, we represent a spore as a sphere with the radius of ≈2.3 units (31). We also differentiate between outer-domain spores (or outer spores) and inner-domain spores (or inner spores). An outer spore is a newly differentiated cell born in the outer domain of an aggregate, which is incapable of active movement. They can be transported passively by motile rod-like cells. An inner spore, by contrast, is a completely motionless spore that has been delivered to the aggregate's inner domain. The passive transport of outer spores is modeled as the result of simple mechanical collisions. If the spore center lies on the line corresponding to the long axis of a rod-like cell, the spore is moved in the direction of motion of the rod-like cell. The spore can be also pushed at some angle to the incoming rod-like cell's long axis, depending on the mutual locations of the rod-like cell and spore centers.
Acknowledgments
M.A. and O.S. were partially supported by National Science Foundation Grant IBN-0083653 and National Institutes of Health Grant l-R0l-GM076692-OA under the Interagency Opportunities in Multiscale Modeling in Biomedical, Biological, and Behavioral Systems program NSF 04-6071. Y.J. was supported by Department of Energy Contract W-7405-ENG-36. D.K. was supported by National Institutes of Health Grant GM23441.
Footnotes
The authors declare no conflict of interest.
This article is a PNAS direct submission.
References
- 1.Igoshin OA, Kaiser D, Oster G. Curr Biol. 2004;14:459–462. doi: 10.1016/j.cub.2004.06.007. [DOI] [PubMed] [Google Scholar]
- 2.Amonlirdviman K, Khare NA, Tree DR, Chen WS, Axelrod JD, Tomlin CJ. Science. 2005;307:423–426. doi: 10.1126/science.1105471. [DOI] [PubMed] [Google Scholar]
- 3.Alber MS, Kiskowski MA, Jiang Y, Newman SA. In: Dynamics and Bifurcation of Patterns in Dissipative Systems. Dangelmayr G, Oprea I, editors. Vol 12. Singapore: World Scientific; 2004. pp. 274–291. World Scientific Series on Nonlinear Science. [Google Scholar]
- 4.Alber MS, Kiskowski MA, Jiang Y. Phys Rev Lett. 2005;93 doi: 10.1103/PhysRevLett.93.068102. 068301. [DOI] [PubMed] [Google Scholar]
- 5.Kiskowski MA, Jiang Y, Alber MS. Physical Biol. 2005;1:173–183. doi: 10.1088/1478-3967/1/3/005. [DOI] [PubMed] [Google Scholar]
- 6.Sozinova O, Jiang Y, Kaiser D, Alber M. Proc Natl Acad Sci USA. 2005;102:11308–11312. doi: 10.1073/pnas.0504259102. [DOI] [PMC free article] [PubMed] [Google Scholar]
- 7.Reichenbach H. In: Myxobacteria II. Dworkin M, Kaiser D, editors. Washington, DC: Am Soc Microbiol; 1993. pp. 13–62. [Google Scholar]
- 8.Burchard RP. Annu Rev Microbiol. 1981;35:497–529. doi: 10.1146/annurev.mi.35.100181.002433. [DOI] [PubMed] [Google Scholar]
- 9.Blackhart BD, Zussman DR. Proc Natl Acad Sci USA. 1985;82:8767–8770. doi: 10.1073/pnas.82.24.8767. [DOI] [PMC free article] [PubMed] [Google Scholar]
- 10.Welch R, Kaiser D. Proc Natl Acad Sci USA. 2001;98:14907–14912. doi: 10.1073/pnas.261574598. [DOI] [PMC free article] [PubMed] [Google Scholar]
- 11.Nudleman E, Kaiser D. J Mol Microbiol Biotechnol. 2004;7:52–62. doi: 10.1159/000077869. [DOI] [PubMed] [Google Scholar]
- 12.Wolgemuth C, Hoiczyk E, Kaiser D, Oster G. Curr Biol. 2002;12:369–377. doi: 10.1016/s0960-9822(02)00716-9. [DOI] [PubMed] [Google Scholar]
- 13.Stephens K, Hartzell P, Kaiser D. J Bacteriol. 1989;171:819–830. doi: 10.1128/jb.171.2.819-830.1989. [DOI] [PMC free article] [PubMed] [Google Scholar]
- 14.Kaiser D, Yu R. Cur Opin Microbiol. 2005;8:216–221. doi: 10.1016/j.mib.2005.02.002. [DOI] [PubMed] [Google Scholar]
- 15.Spormann AM, Kaiser D. J Bacteriol. 1999;181:2593–2601. doi: 10.1128/jb.181.8.2593-2601.1999. [DOI] [PMC free article] [PubMed] [Google Scholar]
- 16.Kaiser D. In: Multicellularity and Differentiation Among the Myxobacteria and Their Neighbors. Kaplan H, Whitworth D, editors. Washington, DC: Am Soc Microbiol; 2007. Ch 5, in press. [Google Scholar]
- 17.Surette MG, Miller MB, Bassler BL. Proc Natl Acad Sci USA. 1999;96:1639–1644. doi: 10.1073/pnas.96.4.1639. [DOI] [PMC free article] [PubMed] [Google Scholar]
- 18.Jelsbak L, Sogaard-Andersen L. Proc Natl Acad Sci USA. 2002;99:2032–2037. doi: 10.1073/pnas.042535699. [DOI] [PMC free article] [PubMed] [Google Scholar]
- 19.Lobedanz S, Sogaard-Andersen L. Genes Dev. 2003;17:2151–2161. doi: 10.1101/gad.274203. [DOI] [PMC free article] [PubMed] [Google Scholar]
- 20.Kim SK, Kaiser D. Science. 1990;249:926–928. doi: 10.1126/science.2118274. [DOI] [PubMed] [Google Scholar]
- 21.Ellehauge E, Norregaard-Madsen M, Sogaard-Anderson L. Mol Microbiol. 1998;30:807–813. doi: 10.1046/j.1365-2958.1998.01113.x. [DOI] [PubMed] [Google Scholar]
- 22.Kim SK, Kaiser D. J Bacteriol. 1991;173:1722–1728. doi: 10.1128/jb.173.5.1722-1728.1991. [DOI] [PMC free article] [PubMed] [Google Scholar]
- 23.Li S, Lee BU, Shimkets LJ. Genes Dev. 1992;6:401–410. doi: 10.1101/gad.6.3.401. [DOI] [PubMed] [Google Scholar]
- 24.Kruse T, Lobedanz S, Berthelsen NM, Sogaard-Andersen L. Mol Microbiol. 2001;40:156–168. doi: 10.1046/j.1365-2958.2001.02365.x. [DOI] [PubMed] [Google Scholar]
- 25.Gronewold TM, Kaiser D. Mol Microbiol. 2001;40:744–756. doi: 10.1046/j.1365-2958.2001.02428.x. [DOI] [PubMed] [Google Scholar]
- 26.Kaiser D, Welch R. J Bacteriol. 2004;186:919–927. doi: 10.1128/JB.186.4.919-927.2004. [DOI] [PMC free article] [PubMed] [Google Scholar]
- 27.Kuner JM, Kaiser D. J Bacteriol. 1982;151:458–461. doi: 10.1128/jb.151.1.458-461.1982. [DOI] [PMC free article] [PubMed] [Google Scholar]
- 28.Sager B, Kaiser D. Genes Dev. 1993;7:1645–1653. doi: 10.1101/gad.7.9.1645. [DOI] [PubMed] [Google Scholar]
- 29.Sager B, Kaiser D. Proc Natl Acad Sci USA. 1993;90:3690–3694. doi: 10.1073/pnas.90.8.3690. [DOI] [PMC free article] [PubMed] [Google Scholar]
- 30.Lux R, Li Y, Lu A, Shi W. Biofilms. 2005;1:293–303. [Google Scholar]
- 31.White D. In: Myxobacteria II. Dworkin M, Kaiser D, editors. Washington, DC: Am Soc Microbiol; 1993. pp. 307–332. [Google Scholar]


