Abstract
Sphingolipid metabolites such as sphingosine-1-phosphate (S1P) and ceramide modulate apoptosis during development and in response to stress. In general, ceramide promotes apoptosis, whereas S1P stimulates cell proliferation and protects against apoptosis. S1P is irreversibly degraded by the enzyme S1P lyase (SPL). In this study, we show a crucial role for SPL in mediating cellular responses to stress. SPL expression in HEK293 cells potentiated apoptosis in response to stressful stimuli including DNA damage. This effect seemed to be independent of ceramide generation but required SPL enzymatic activity and the actions of p38 MAP kinase, p53, p53-inducible death domain protein (PIDD), and caspase-2 as shown by molecular and chemical inhibition of each of these targets. Further, SPL expression led to constitutive activation of p38. Endogenous SPL expression was induced by DNA damage in WT cells, whereas SPL knockdown diminished apoptotic responses. Importantly, SPL expression was significantly down-regulated in human colon cancer tissues in comparison with normal adjacent tissues, as determined by quantitative real-time PCR (Q-PCR) and immunohistochemical analysis. Down-regulation of S1P phosphatases was also observed, suggesting that colon cancer cells manifest a block in S1P catabolism. In addition, SPL expression and activity were down-regulated in adenomatous lesions of the Min mouse model of intestinal tumorigenesis. Taken together, these results indicate that endogenous SPL may play a physiological role in stress-induced apoptosis and provide an example of altered SPL expression in a human tumor. Our findings suggest that genetic or epigenetic changes affecting intestinal S1P metabolism may correlate with and potentially contribute to carcinogenesis.
Keywords: intestinal tumorigenesis, Min mouse, sphingolipid, etoposide
Sphingosine-1-phosphate (S1P) is a bioactive sphingolipid metabolite and the final common product of complex sphingolipid metabolism. S1P acts through its cognate G protein-coupled receptors to inhibit apoptosis, regulate lymphocyte trafficking and to promote DNA synthesis, cell proliferation, cell migration, and angiogenesis (1, 2). The SPHK1 gene, which encodes the major sphingosine kinase responsible for S1P synthesis, can act as an oncogene in model systems (3). Further, parenteral administration of S1P-specific antibodies markedly slows human cancer xenograft progression and angiogenesis (4). S1P signaling has been implicated in the development of the drug resistant phenotype in cancer cells (5). Together, these findings strongly support a role for S1P signaling in promoting tumorigenesis and cancer progression. Despite these observations, evidence of genetic changes in human cancer tissues that would directly implicate S1P signaling in these processes is lacking.
S1P is irreversibly degraded by the pyridoxal 5′-phosphate-dependent enzyme, S1P lyase (SPL). SPL is highly conserved throughout evolution, is required for maintenance of physiological levels of S1P and other sphingolipid intermediates and contributes to normal development, reproduction, tissue integrity and stress responses in many species (6). In addition, SPL inhibition was recently shown to prevent lymphocyte trafficking by disrupting S1P gradients in blood and tissues, demonstrating that SPL can have significant effects on S1P signaling (7). Our previous studies have shown that SPL expression promotes apoptosis in human cells (8). However, the downstream mechanisms by which SPL influences apoptosis and the relevance of SPL expression to human disease remain incompletely understood.
In this study, we characterize the role of SPL in stress-induced apoptosis in human cells and define the mechanisms responsible for this phenomenon. These studies provide a link between sphingolipid metabolism and tumor suppressor pathways and implicate SPL as a mediator in the physiological response to DNA damage. Further, we find that SPL is down-regulated in human colorectal carcinomas (CRC) and in Min mouse intestinal adenomas, suggesting that SPL loss of function may correlate with and/or contribute to intestinal carcinogenesis.
Results
SPL Expression Potentiates Apoptosis in Response to Stress.
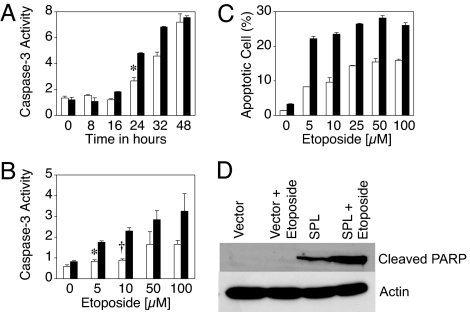
We have reported that SPL expression promotes apoptosis in response to serum deprivation (8). Here, we show that SPL expression in HEK293 cells also promotes apoptosis in response to treatment with staurosporine and etoposide, as shown by increased caspase-3 activity in whole-cell extracts (Fig. 8, which is published as supporting information on the PNAS web site) and other indicators of apoptosis including annexin binding, polyADP-ribose polymerase (PARP) cleavage, nuclear condensation and morphological characteristics (Fig. 1 and Fig. 9C, which is published as supporting information on the PNAS web site). Whereas cells expressing SPL or vector control both activated caspase-3 in a time-dependent fashion after treatment with etoposide, caspase-3 was activated in cells expressing SPL ≈8–16 h earlier than WT cells (Fig. 1). The effect was maximal at 24 h and was evident over a range of etoposide doses.
Fig. 1.
SPL expression potentiates apoptosis in response to DNA damage. (A) Cells expressing SPL (black bars) or vector (white bars) were treated with 100 μM etoposide and harvested at various time points, and apoptosis was quantified by caspase-3 activity in whole-cell extracts. All caspase activity measurements are given in arbitrary units. ∗, P < 0.005, for control versus SPL at 24 h. (B) Cells expressing SPL (black bars) or vector (white bars) were treated with increasing doses of etoposide and harvested at 24 h, and apoptosis was quantified by caspase-3 activity. ∗, P < 0.00006, for control versus SPL at 5 μM etoposide; †, P < 0.0004, for control versus SPL at 10 μM etoposide. (C) Cells were treated as in B, and apoptosis was quantified by annexin-V binding to phosphatidylserine. (D) PARP cleavage was determined by immunoblotting. Each figure is representative of at least three separate experiments.
SPL Catalytic Activity Is Required to Potentiate Apoptosis.
The effect of SPL was compared with that of a catalytically dead mutant SPL containing a lysine to leucine substitution at the predicted cofactor binding lysine residue (8). Cells expressing catalytically inactive SPL showed no differences in survival after etoposide treatment in comparison with vector control cells, whereas cells expressing active SPL demonstrated a marked reduction in survival (Fig. 10A, which is published as supporting information on the PNAS web site). Similarly, whereas active SPL potentiated apoptosis in response to serum deprivation and staurosporine, overexpression of mutant SPL had no effect (Fig. 10 B and C). These results indicate that enzymatic activity of SPL is required for its effects on apoptosis, consistent with the low level of S1P found in cells expressing SPL (Fig. 11, which is published as supporting information on the PNAS web site). In contrast, ceramide levels in etoposide-treated cells are not appreciably or consistently influenced by SPL expression (Table 1, which is published as supporting information on the PNAS web site), suggesting that the effects of SPL on cellular responses to etoposide may be independent of ceramide.
SPL Promotes Apoptosis Through a p53-Dependent Mechanism.
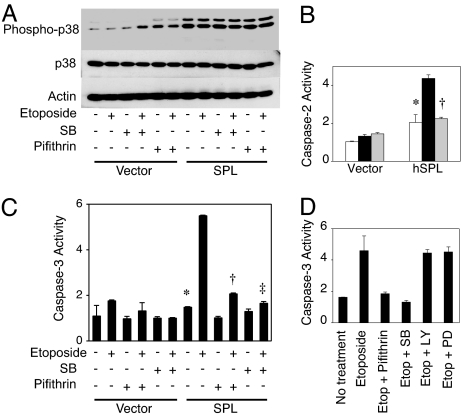
To examine the potential role of p53, a major effector of apoptosis in response to DNA damage, cells expressing SPL or vector control were simultaneously treated with etoposide and pifithrin-α, a chemical inhibitor of p53 transcriptional activity. Pifithrin-α abrogated apoptosis in cells treated with etoposide, as determined by caspase-3 activity in extracts of cells expressing SPL compared with either vector control (Fig. 12A, which is published as supporting information on the PNAS web site; also see Fig. 3B) or mutant SPL (Fig. 10D). To confirm the involvement of p53, cells expressing SPL were transiently transfected with a dominant negative mutant of p53, p53R248W or vector control, followed by etoposide treatment. Expression of p53R248W blocked p53 function, as shown by the lack of induction of the downstream cell cycle regulator p21/WAF1 in response to etoposide (Fig. 12B). In contrast, p21/WAF1 was readily induced by etoposide in vector-transfected cells. Importantly, expression of p53R248W inhibited apoptosis in response to DNA damage in cells expressing SPL (Fig. 12C). Similar results were obtained by using a second p53 dominant negative mutant, p53R175H (data not shown). Taken together, these results indicate that SPL potentiates apoptosis in response to stress through a p53-dependent pathway.
Fig. 3.
SPL expression results in constitutive activation of p38. (A) Cells expressing SPL or vector control were treated with vehicle, pifithrin-α, or SB203580 (SB), alone and in combination with 12.5 μM etoposide, incubated for 24 h, and harvested, and total and phosphorylated p38 were determined in whole-cell extracts by immunoblotting. Actin serves as a loading control. (B) Cells were treated with vehicle (white bars), etoposide (black bars), or etoposide and SB203580 (gray bars) for 24 h and harvested, and caspase-2 activity was determined in whole-cell extracts. Each figure is representative of at least two separate experiments. ∗, P < 0.00005, for SPL untreated versus SPL plus etoposide; †, P < 0.00007, for SPL plus etoposide versus SPL plus etoposide and SB203580. (C) Cells were treated with etoposide with or without p53 and p38 inhibitors and incubated for 24 h, and caspase-3 activity was determined in whole-cell extracts. ∗, P < 0.006, for SPL versus SPL plus etoposide; †, P < 0.10, for SPL plus etoposide versus SPL plus etoposide and pifithrin-α; ‡, P < 0.009, for SPL plus etoposide versus SPL plus etoposide and SB203580. (D) Cells were simultaneously treated with etoposide and SB203580, PI3-kinase inhibitor LY294002 (LY), or MEK inhibitor PD98059 (PD), incubated for 24 h, and harvested, and caspase-3 activity was determined in whole-cell extracts.
SPL Promotes Apoptosis in Response to DNA Damage Through a Pathway Involving p53, p53-Inducible Death Domain Protein (PIDD), and Caspase-2.
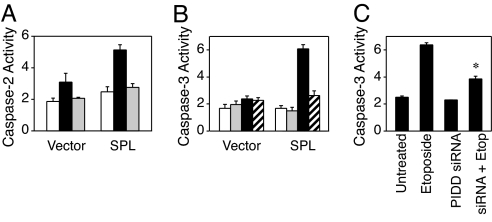
Caspase-2 is an initiator caspase that is activated in response to DNA damage and has been implicated as an early mediator of etoposide- and ceramide-mediated apoptosis (9). Caspase-2 activity was markedly up-regulated in response to etoposide in cells expressing SPL compared with control cells (Fig. 2A). Inhibition of p53 transcriptional activity with pifithrin-α blocked caspase-2 activation in response to etoposide in both SPL and control cells. As shown in Fig. 2B, inhibition of caspase-2 with the caspase-2-specific inhibitor Z-VDVAD-FMK abrogated apoptosis in SPL expressing cells. These results suggest that SPL promotes apoptosis in response to etoposide through activation of caspase-2. Caspase-2 is activated by a protein complex that includes the p53-inducible-death-domain-containing protein PIDD (10, 11). Knockdown of PIDD by using a PIDD-specific siRNA led to inhibition of apoptosis in cells expressing SPL and treated with etoposide (Fig. 2C). Thus, SPL seems to promote apoptosis through a pathway involving the sequential activation of p53, PIDD and caspase-2.
Fig. 2.
SPL potentiates apoptosis through a pathway involving p53, PIDD, and caspase-2. (A) Cells expressing SPL or vector were treated with vehicle (white bars), 12.5 μM etoposide (black bars), or etoposide plus pifithrin-α (gray bars) for 24 h and harvested, and caspase-2 activity was determined in whole-cell extracts by using a caspase-2-specific chromogenic substrate. (B) Cells expressing SPL or vector control were treated with vehicle (white bars), the preferential caspase-2 inhibitor Z-VDVAD-FMK (gray bars), 12.5 μM etoposide (black bars), or etoposide plus caspase-2 inhibitor (hatched bars) for 24 h and harvested, and caspase-3 activity was determined. (C) Cells overexpressing SPL were transfected with PIDD siRNA or mock transfected, followed by etoposide treatment. Apoptosis was then quantified by caspase-3 activity. ∗, P < 0.008, for SPL versus SPL plus PIDD siRNA (both treated with etoposide).
SPL Expression Leads to Constitutive Activation of the Stress Activated MAP Kinase, p38.
SPL expression was recently shown to induce apoptosis in response to the alkylating agent cisplatin through a mechanism involving the stress-activated protein kinase p38 (12). To explore whether p38 plays a role in SPL-mediated stress responses, the expression of both unphosphorylated (inactive) and phosphorylated (active) forms of p38 were examined in the lysates of cells expressing SPL or vector control. As shown in Fig. 3A, p38 was constitutively activated in cells expressing SPL, as demonstrated by the high level of phospho-p38 in the presence and absence of etoposide. However, the level of total p38 was similar in cells expressing SPL and vector control under both conditions. Inhibition of p38 activity by using the specific p38 inhibitor SB203580 completely abrogated the effect of SPL on apoptosis in response to etoposide, as determined by caspase-2 (Fig. 3B) and caspase-3 activity (Fig. 3C). Neither the PI3-kinase inhibitor LY294002 nor the MEK inhibitor PD98059 had any effect on the ability of SPL to promote apoptosis (Fig. 3D). Thus, SPL expression leads to constitutive activation of p38, which is specifically required for downstream caspase activation in response to stress.
Role of Endogenous SPL in Apoptosis.
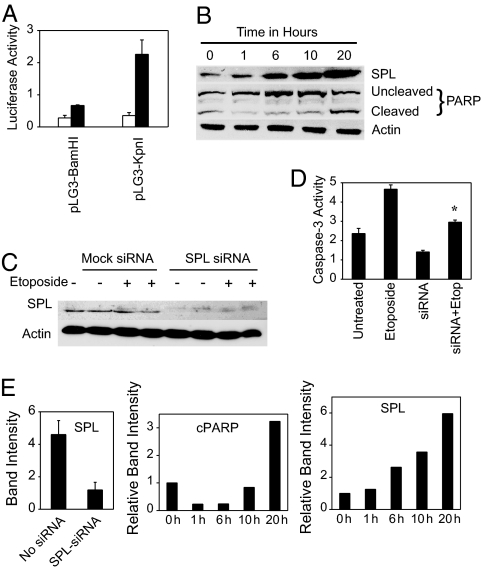
As the above studies were performed by using an SPL expression system, we next addressed the function of the endogenous protein. SPL expression was induced in response to DNA damage, as shown by the activation of two different SPL luciferase reporters and increased abundance of SPL protein in extracts of cells treated with etoposide (Fig. 4A, B, and E). Induction of SPL protein was evident by 6 h after treatment, well before induction of PARP cleavage. SPL protein expression was similarly induced in HeLa cells in response to etoposide (data not shown). To examine the effect of SPL ablation on cells undergoing stress, HEK293 cells were transfected with siRNA against SPL or siRNA control, then treated with etoposide for 48 h and evaluated for apoptosis. As shown in Fig. 4 C and E, siRNA treatment markedly reduced SPL protein expression. Knockdown of SPL diminished apoptosis both at baseline and in response to etoposide, as shown by a reduction in caspase-3 activity (Fig. 4D). These studies highlight the role of endogenous SPL in the physiological response to stress by demonstrating that SPL expression is responsive to DNA damage and required for maximal apoptotic responses.
Fig. 4.
Role of endogenous SPL in apoptosis. (A) HEK293 cells were transiently transfected with SPL reporter constructs pLG3BamHI and pLG3KpnI (containing ≈8 and ≈2 kb of promoter length, respectively) and treated for 24 h with vehicle (white bars) or 12.5 μM etoposide (black bars), and SPL gene expression was determined by luciferase assay. (B) HEK293 cells were treated with 12.5 μM etoposide and harvested at various time points. SPL expression and PARP cleavage were determined in whole-cell extracts by immunoblotting. Actin served as a loading control. (C) HEK293 cells were transfected with SPL siRNA or mock-transfected, then treated with etoposide for 48 h. SPL protein expression was determined in whole-cell extracts. (D) Caspase-3 activity was measured in the same extracts. ∗, P < 0.025, for etoposide-treated versus etoposide-treated plus SPL siRNA. (E) Quantitative analysis of autoradiogram band intensities for SPL and cleaved PARP (cPARP). For the etoposide induction experiment, SPL and cleaved PARP band intensities are given relative to time 0.
The Effect of SPL on Apoptosis Is Not Cell-Specific.
We sought to confirm these observations in independent cell lines. None of the malignant cell lines we have examined to date contain appreciable SPL activity. Therefore, an untagged SPL protein was expressed by using an adenoviral expression system in the MCF7 breast cancer cell line, which has WT p53 and p38. Because MCF7 cells lack active caspase-3, SPL was also expressed in MCF7 cells stably expressing caspase-3 (13). As expected, caspase-3 activity in MCF7 cells was not detectable (Fig. 13A, which is published as supporting information on the PNAS web site). In contrast, MCF7/caspase-3 cells demonstrated a 2-fold activation of caspase-3 in response to etoposide, indicating an active apoptotic response. Importantly, expression of SPL in MCF7/caspase-3 cells elicited a 6-fold increase in caspase-3 activity, independent of etoposide treatment. Similarly, DLD1 colon cancer cells engineered to express functional p53 and forced to express SPL demonstrated increased apoptosis both at baseline and in response to daunorubicin treatment (Fig. 13B). Thus, SPL expression induces apoptosis in cell lines of both malignant and nonmalignant origins.
Down-Regulation of SPL and S1P Phosphatase Expression in Colon Cancer.
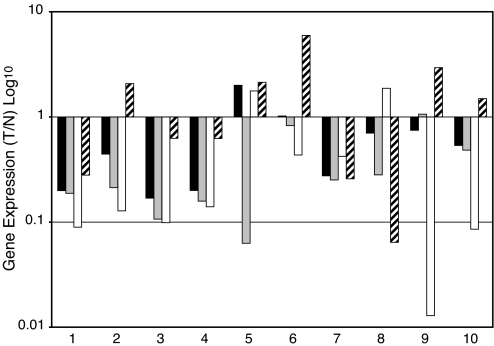
The acquisition of genetic changes leading to defective apoptotic pathways is a common phenomenon in carcinogenesis. Therefore, we considered the possibility that SPL expression might be selected against in human malignancies and, in particular, in colon cancer, because SPL is normally highly expressed and active in intestines and colon, where it serves to metabolize dietary sphingolipids (14). To address this possibility, SPL expression was compared in a series of 10 matched pairs of human CRC and normal adjacent tissue (NAT) from individual patients by using quantitative real-time PCR (Q-PCR). As shown in Fig. 5, SPL (SGPL1) expression was significantly reduced in 8 of 10 CRC samples compared with NAT. In addition, two other genes directly responsible for S1P catabolism, S1P phosphatase 1 and 2 (SGPP1 and SGPP2) were markedly down-regulated in CRC versus NAT. In contrast, SPHK1 was not differentially expressed in tumor versus NAT. These findings suggest that S1P catabolism may be blocked in CRC.
Fig. 5.
Sphingolipid gene expression in colon cancer. Gene expression levels of SPL (black bars), sphingosine phosphate phosphatase SGPP1 (gray bars), and SGPP2 (white bars) and SPHK1 (hatched bars) were compared in matched pairs of tumor (T) versus normal adjacent tissue (N) in 10 different patients by using Q-PCR. Depicted is the relative amount of mRNA in tumor/normal tissue. Statistical significance: SPL, P < 0.035; SGPP1, P < 0.0007; SGPP2, P < 0.012; SPHK1, not significant.
SPL Is Down-Regulated in Intestinal Polyps of the Min Mouse.
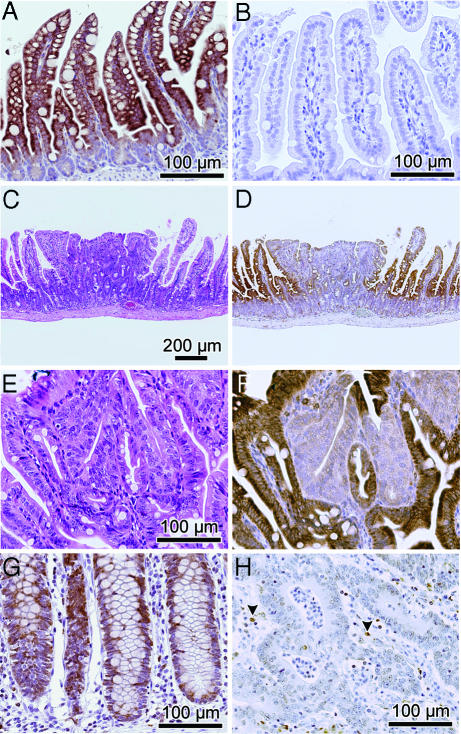
SPL expression was also examined in the Min murine model of colon cancer, which is caused by mutations in the APC gene, also implicated in familial and spontaneous CRC in humans (15, 16). Immunohistochemical analysis was performed by using polyclonal antisera against murine SPL. To establish the specificity of the antisera, the staining pattern of normal murine intestinal mucosa was compared with intestinal mucosa from a recently generated Sgpl1−/− (SPL−/−) knockout mouse (C. Raymond and P. Soriano, personal communication). As shown in Fig. 6A, strong SPL expression was observed in WT intestinal tissues, primarily in mature intestinal epithelial cells. This staining pattern emulates that of a Sgpl1 promoter-driven β-galactosidase reporter in Sgpl−/− mice (17) (data not shown). In sharp contrast, staining was entirely absent in the Sgpl1−/− intestinal tissues (Fig. 6 B). Further, the antisera identifies a single polypeptide band in immunoblots of both murine and human cells and tissues (data not shown). These data establish the specificity of the antisera and confirm that SPL is highly expressed in normal murine intestinal epithelium. SPL expression was then evaluated in early adenomatous lesions and surrounding intestinal tissues of Min mice (Fig. 6C). The entire gastrointestinal tracts of three individual mice were analyzed, in which adenomatous lesions ranged from 6–12 per animal. SPL expression in 28 polyps versus normal adjacent tissues was examined. Importantly, whereas SPL expression was observed throughout normal villi and epithelial cells lining the intestinal lumen, expression in all adenomas was markedly reduced, as shown in the representative adenoma in Fig. 6 C–F. Quantification of image intensity (see Materials and Methods) indicates that the normal tissues express SPL at >2-fold higher levels than polyps (57 ± 6.2 intensity units versus 25 ± 6.5 units, respectively). SPL expression as determined by immunoblotting for SPL protein (Fig. 7A and B) and SPL enzyme activity (Fig. 7C) were both reduced in adenomatous compared with unaffected Min mouse intestinal tissues, confirming that SPL is down-regulated during intestinal tumorigenesis
Fig. 6.
Diminished SPL expression in intestinal tumorigenesis. (A) SPL expression in intestinal villi of a WT mouse. (B) Lack of SPL expression in Sgpl1−/− mouse villi. (C) H&E staining of Min mouse adenoma surrounded by normal villi. (D) SPL down-regulation in adenoma as shown by IHC (immunohistochemistry). (E and F) H&E and IHC demonstrate SPL down-regulation in adenomatous tissue, shown at higher magnification. (G) SPL expression throughout normal human colonic crypts. (H) SPL expression in adjacent colorectal carcinoma. Arrowheads show positively stained inflammatory cells.
Fig. 7.
SPL expression and activity in Min polyps. (A) SPL expression as shown by immunoblotting of extracts from Min mouse polyp and unaffected adjacent intestinal tissue. (B) Immunoblot quantification. (C) SPL enzyme activity in polyp and unaffected adjacent intestinal tissue.
To confirm our Q-PCR results demonstrating SPL down-regulation in human CRC, SPL expression was evaluated by immunohistochemistry in seven available paraffin-embedded samples of CRC and NAT by using the antisera recognizing murine SPL, which cross-reacts with human SPL and, as shown above, is highly specific. As shown in Fig. 6G, SPL expression was evident throughout the normal colonic crypts, whereas expression was markedly reduced in CRC samples from the same patient (Fig. 6H).
Discussion
In this study we demonstrate that SPL expression potentiates apoptosis in response to DNA damage and other stressful stimuli. These findings extend our previous observations defining a role for SPL in the response to serum starvation and are consistent with those of Li et al. (18), who identified SPL in a genetic screen for mutations conferring resistance to cisplatin (8, 18). One difference we noted in our current study is that cells with high SPL activity did not accumulate ceramide in response to DNA damage, whereas we previously found ceramide accumulation to contribute to SPL's effects on cell survival in response to serum deprivation (8). This result may be due to a variety of factors, including differences in timing, methodology of ceramide determination, and involvement of pathways unique to each stress condition.
Several important signaling pathways control apoptosis in response to DNA damage and other stresses. Among these, the p53 signaling pathway may be the most critical, because it is defective in >50% of all human cancers, and its ability to induce apoptosis is considered a fundamental aspect of its tumor suppressor function (19). Our results indicate that SPL expression promotes apoptosis through a cascading mechanism that involves p53, PIDD, and caspase-2. It is interesting to note that caspase-2 has been implicated in mediating apoptosis during development and in response to serum deprivation, staurosporine treatment, etoposide, cisplatin and other stressful stimuli (20–22), conditions in which SPL expression has an effect. It is not clear how SPL expression interacts with the p53 pathway, although we have observed significant changes in the phosphorylation of specific p53 residues previously implicated in mediating the DNA damage response (data not shown).
Cells overexpressing SPL demonstrated constitutive activation of p38, an important member of the MAP kinase family involved in mediating cellular responses to stress, inflammation and treatment with chemotherapeutic agents (23). Abundant studies have implicated a role for p38 in the regulation of apoptosis, with some placing p38 upstream and others downstream of caspases (24). p38 has also been considered a tumor suppressor, consistent with its role in inducing apoptosis in response to cellular stress, as well as its known function as an activator of p53 (25). In our study, inhibition of p38 activity blocked both caspase-2 and caspase-3 activation in response to etoposide, whereas inhibitors of other signaling kinases did not affect the activation of these caspases. This finding suggests that p38 acts upstream of caspase-2 and –3 in the pathway. Interestingly, a recent study demonstrated that caspase-2 activates p38 in a TRAF2-mediated manner (26). These studies indicate that the interplay between caspase-2 and p38 may be more complex, with interactions occurring in both directions.
SPL expression is induced in response to DNA damage, indicating it may play a role in stimulating or amplifying apoptosis in physiological contexts. Interestingly, SPL expression increased apoptosis in MCF7 and DLD1 cells in the absence of cytotoxic agents, and exposure to etoposide did not increase apoptosis over that of SPL expression alone, which speaks to an effect intrinsic to SPL expression. This observation may be explained by the higher level of SPL expression achieved in transient expression systems, especially with the adenovirus-mediated transduction, which is itself a cellular stress. Thus, we do not observe an appreciable difference in baseline apoptosis when we compare HEK293 cells that have integrated copies of pcDNA-SPL in their chromosomes to those with integrated empty vector. Alternatively, SPL may play some role in the regulation of apoptosis even in the absence of stress, potentially via p38 activation.
SPL is highly expressed in normal intestinal and colonic epithelium, where it degrades S1P formed by metabolism of dietary sphingolipids. However, we find that SPL is down-regulated in human CRC and early adenomatous lesions of Min mice. Dietary sphingolipids protect against intestinal tumorigenesis through conversion to growth-inhibitory sphingosines in the intestinal lumen (27–29). However, our finding suggests that sphingolipid metabolism may be blocked in CRC, leading to intracellular S1P accumulation. This notion is consistent with our finding that S1P phosphatases are also underexpressed in CRC. Considering that S1P is a potent mitogen, inducer of COX-2 expression (30), and angiogenic factor, S1P accumulation may promote cell proliferation and could potentially subvert other therapeutic interventions for advanced CRC, such as VEGF blockade.
In summary, our findings show that SPL expression is induced in response to DNA damage and promotes apoptosis through well characterized tumor suppressor pathways. Further, these studies provide a link between SPL expression and human disease and suggest that metabolism of dietary sphingolipids may be blocked in colon cancer, potentially affecting tumorigenicity and/or tumor progression.
Materials and Methods
Materials.
Dimethyl sulfoxide, BSA, and pifithrin-α were from Sigma (St. Louis, MO); S1P was from Matreya, LLC (Pleasant Gap, PA); and SB203580, LY294002, PD98059, and etoposide were from Calbiochem/EMD Biosciences, Inc. (La Jolla, CA).
Mice.
Sgpl1+/− mice in the 129sv/C57BL/6 background (kind gift from P. Soriano, Fred Hutchinson Cancer Research Center, Seattle, WA) were crossbred to derive Sgpl1+/+ and Sgpl1−/− progeny. ApcMin/+ (Min) mice were purchased from The Jackson Laboratory (Bar Harbor, ME). Mice were maintained in the Children's Hospital Oakland Research Institute (CHORI) Animal Facility. All experiments were performed in accordance with CHORI Institutional Animal Care and Use Committee-approved protocols. For intestinal tissue harvest, Sgpl1+/+ and Sgpl1−/− mice were euthanized at 7 days of age and Min mice were euthanized at 79–80 days of age by CO2 inhalation.
Cell Culture, Transfection, and Reagents.
HEK293 cells stably expressing human SPL-GFP fusion protein or mutant SPL-GFP were generated as described (8). MCF7 cells containing caspase-3 and vector control cells were a kind gift of A. G. Porter (Institute of Molecular and Cellular Biology, Proteos, Singapore). DLD1 cells expressing WT p53 were a kind gift of B. Vogelstein (Johns Hopkins Medical Institutions, Baltimore, MD). Cells were propagated in DME H-21 containing 10% FBS at 37°C with 5% CO2. Transient transfection of HEK293 cells was performed by using Lipofectamine 2000 (Invitrogen). Efficiency of cDNA transfections was >70%, demonstrated by simultaneous transfection with a GFP control plasmid. The human SPL gene was cloned in KpnI/XhoI sites of pAdTrack-CMV and was used for virion production. Adenoviruses were propagated in Ad-293 cells (Stratagene), purified by using VivaPure AdenoPack 100 from VivaScience (Hanover, Germany), and used to infect MCF7 and DLD1 cells at a multiplicity of infection of 100.
Caspase and MTT Assays.
Caspase-2 substrate Ac-VDVAD-pNA and caspase-3 substrate Ac-DEVD-pNA were from Biomol (Plymouth Meeting, PA). The cell-permeable caspase-2-specific inhibitor Z-VDVAD-FMK was from Calbiochem/EMD Biosciences, Inc. Caspase and MTT [3-(4,5-dimethylthiazol-2-yl)-2,5-diphenyltetrazolium bromide] assays were performed as described (8). Caspase assays required different incubation times under different conditions. Thus, all caspase activity assays are presented in arbitrary units.
Annexin-Binding Assays.
Phosphatidylserine exposure was determined by annexin binding as described (31).
Immunoblotting.
Antibodies to PARP and p21/WAF1 were from eBioscience (San Diego, CA). Antibodies to actin were from Sigma. Antibodies to p38 and threonine 180 and tyrosine 182 phosphorylated p38 were from Cell Signaling Technologies (Beverly, MA). All primary antibodies were used at 1:1,000 dilution, except actin antibodies, which were at 1:20,000 dilution. Cell lysates were prepared and evaluated by immunoblotting as described (31).
Sphingolipid Quantitation.
Ceramide and S1P levels were quantitated as described (31, 32).
Transcriptional Activation of SPL Reporters.
SPL gene expression in response to etoposide was assessed by using two human SPL luciferase reporter constructs, as described (33).
Sgpl1 and PIDD siRNA.
Cells were incubated overnight in six-well dishes in DME H-21 containing 10% FBS without antibiotics. After 24 h, the medium was replaced with fresh medium containing 100 nM SPL (Sgpl1) siRNA or PIDD siRNA (Dharmacon, Chicago, IL) complexed to either Lipofectamine 2000 (Invitrogen) or Dharmafect 1 (Dharmacon). Control cells were similarly treated with nontargeting siRNA control. Thirty-six hours after transfections, the cells were treated with etoposide or dimethyl sulfoxide (48 h for SPL siRNA experiment and 24 h for PIDD siRNA experiment), and cell lysates were prepared for caspase assays. The efficiency of siRNA uptake was >90%, determined by transfection with siGLO RISC-Free siRNA fluorescent control (Dharmacon).
Gene Expression in CRC.
Total RNA was extracted from matched pairs of frozen CRC and NAT samples by using the RNeasy RNA isolation kit (Qiagen, Valencia, CA). Human tissue samples were thawed and stored in RNAlater-ICE (Ambion, Austin, TX) before homogenization. RNA quantity and purity were determined spectrophotometrically, and integrity was verified by using an Agilent 2100 Bioanalyzer. The level of gene expression was assessed by Q-PCR of reverse-transcribed total RNA, by using a combination of TaqMan and SYBR green-based chemistries for amplicon detection. Statistical analyses were performed for each gene by using a paired t test to compare mean values, where P < 0.05 was considered significant. Control cycle thresholds and relative expression values for two separate experiments are provided in Tables 2 and 3, Fig. 14 (shown graphically), and Supporting Materials and Methods, which are published as supporting information on the PNAS web site.
SPL Immunohistochemistry.
Formalin-fixed and paraffin-embedded murine intestinal tissues, human CRC, and NAT samples were deparaffinized and incubated for 30 min in 3% hydrogen peroxide/methanol to quench endogenous peroxidases. Sections were rinsed in PBS and immunostained with anti-(murine) SPL antisera at 1:200 dilution in 0.5% PBS/ova albumin at 37°C for 1 h after antigen retrieval with citrate buffer (pH 6.0) in a small autoclave set for 125°C for 2 min; slides were cooled for 1 h at room temperature before adding secondary antibody. Secondary antibody was biotinylated anti-rabbit (Vector Laboratories, Burlingame, CA) diluted 1:1,000 in 0.5% PBS/ova albumin and incubated for 30 min at room temperature. Sections were incubated with Elite ABC kit (Vector Laboratories) for 30 min and rinsed in PBS. Detection was with DAB (Vector Laboratories) for 2 min, and counterstaining was in hematoxylin. For additional details, see Supporting Materials and Methods.
Supplementary Material
Acknowledgments
We thank Catherine McDonough for technical assistance, Kenneth Beckman for Q-PCR, Timothy Hla and Ming-Tao Wu for original SPL adenoviral virion production, Carol Prives (Columbia University, New York, NY) for p53 constructs, the University of California, Davis Mouse Biology Program, Mr. Robert J. Munn for digital photomicroscopy, and Betsy Lathrop for expert administrative assistance. This work was supported by National Institutes of Health Grants CA77528 (to J.D.S.) and T32 HL007951 (to Y.Y.T.).
Abbreviations
- MTT
3-(4,5-dimethylthiazol-2-yl)-2,5-diphenyltetrazolium bromide
- PARP
poly-ADP-ribose polymerase
- Q-PCR
quantitative real-time PCR
- S1P
sphingosine-1-phosphate
- SPL
S1P lyase
- CRC
colorectal carcinoma
- PIDD
p53-inducible death domain protein
- NAT
normal adjacent tissue.
Footnotes
The authors declare no conflict of interest.
References
- 1.Milstien S, Spiegel S. Cancer Cell. 2006:148–150. doi: 10.1016/j.ccr.2006.02.025. [DOI] [PubMed] [Google Scholar]
- 2.Ishii I, Fukushima N, Ye X, Chun J. Annu Rev Biochem. 2004;73:321–354. doi: 10.1146/annurev.biochem.73.011303.073731. [DOI] [PubMed] [Google Scholar]
- 3.Xia P, Gamble JR, Wang L, Pitson SM, Moretti PA, Wattenberg BW, D'Andrea RJ, Vadas MA. Curr Biol. 2000;10:1527–1530. doi: 10.1016/s0960-9822(00)00834-4. [DOI] [PubMed] [Google Scholar]
- 4.Visentin B, Vekich J, Sibbald B, Cavalli A, Moreno K, Matteo R, Garland W, Lu Y, Yu S, Hall H, et al. Cancer Cell. 2006;9:225–238. doi: 10.1016/j.ccr.2006.02.023. [DOI] [PubMed] [Google Scholar]
- 5.Akao Y, Banno Y, Nakagawa Y, Hasegawa N, Kim T, Murate T, Igarashi Y, Nozawa Y. Biochem Biophys Res Commun. 2006;342:1284–1290. doi: 10.1016/j.bbrc.2006.02.070. [DOI] [PubMed] [Google Scholar]
- 6.Saba J, Hla T. Circ Res. 2004;94:724–734. doi: 10.1161/01.RES.0000122383.60368.24. [DOI] [PubMed] [Google Scholar]
- 7.Schwab S, Pereira J, Matloubian M, Xu Y, Huang Y, Cyster J. Science. 2005;309:1735–1739. doi: 10.1126/science.1113640. [DOI] [PubMed] [Google Scholar]
- 8.Reiss U, Oskouian B, Zhou J, Gupta V, Sooriyakumaran P, Kelly S, Wang E, Merrill AH, Jr, Saba JD. J Biol Chem. 2004;279:1281–1290. doi: 10.1074/jbc.M309646200. [DOI] [PubMed] [Google Scholar]
- 9.Lin CF, Chen CL, Chang WT, Jan MS, Hsu LJ, Wu RH, Tang MJ, Chang WC, Lin YS. J Biol Chem. 2004;279:40755–40761. doi: 10.1074/jbc.M404726200. [DOI] [PubMed] [Google Scholar]
- 10.Lin Y, Ma W, Benchimol S. Nat Genet. 2000;26:122–127. doi: 10.1038/79102. [DOI] [PubMed] [Google Scholar]
- 11.Tinel A, Tschopp J. Science. 2004;304:843–846. doi: 10.1126/science.1095432. [DOI] [PubMed] [Google Scholar]
- 12.Min J, Van Veldhoven PP, Zhang L, Hanigan MH, Alexander H, Alexander S. Mol Cancer Res. 2005;3:287–296. doi: 10.1158/1541-7786.MCR-04-0197. [DOI] [PubMed] [Google Scholar]
- 13.Janicke R, Sprengart M, Wati M, Porter A. J Biol Chem. 1998;273:9357–9360. doi: 10.1074/jbc.273.16.9357. [DOI] [PubMed] [Google Scholar]
- 14.Ikeda M, Kihara A, Igarashi Y. Biochem Biophys Res Commun. 2004;325:338–343. doi: 10.1016/j.bbrc.2004.10.036. [DOI] [PubMed] [Google Scholar]
- 15.Moser A, Pitot H, Dove W. Science. 1990;247:322–324. doi: 10.1126/science.2296722. [DOI] [PubMed] [Google Scholar]
- 16.Kinzler KW, Vogelstein B. Cell. 1996;87:159–170. doi: 10.1016/s0092-8674(00)81333-1. [DOI] [PubMed] [Google Scholar]
- 17.Chen W, Delrow J, Corrin P, Frazier J, Soriano P. Nat Genet. 2004;36:304–312. doi: 10.1038/ng1306. [DOI] [PubMed] [Google Scholar]
- 18.Li G, Alexander H, Schneider N, Alexander S. Microbiology. 2000;146:2219–2227. doi: 10.1099/00221287-146-9-2219. [DOI] [PubMed] [Google Scholar]
- 19.Schmitt CA, Fridman JS, Yang M, Baranov E, Hoffman RM, Lowe SW. Cancer Cell. 2002;1:289–298. doi: 10.1016/s1535-6108(02)00047-8. [DOI] [PubMed] [Google Scholar]
- 20.Seth R, Yang C, Kaushal V, Shah SV, Kaushal GP. J Biol Chem. 2005;280:31230–31239. doi: 10.1074/jbc.M503305200. [DOI] [PubMed] [Google Scholar]
- 21.Haviv R, Lindenboim L, Yuan J, Stein R. J Neurosci Res. 1998;52:491–497. doi: 10.1002/(SICI)1097-4547(19980601)52:5<491::AID-JNR1>3.0.CO;2-7. [DOI] [PubMed] [Google Scholar]
- 22.Leloup C, Michaelson DM, Fisher A, Hartmann T, Beyreuther K, Stein R. Cell Death Differ. 2000;7:825–833. doi: 10.1038/sj.cdd.4400713. [DOI] [PubMed] [Google Scholar]
- 23.Olson JM, Hallahan AR. Trends Mol Med. 2004;10:125–129. doi: 10.1016/j.molmed.2004.01.007. [DOI] [PubMed] [Google Scholar]
- 24.Zarubin T, Han J. Cell Res. 2005;15:11–18. doi: 10.1038/sj.cr.7290257. [DOI] [PubMed] [Google Scholar]
- 25.Huang C, Ma WY, Maxiner A, Sun Y, Dong Z. J Biol Chem. 1999;274:12229–12235. doi: 10.1074/jbc.274.18.12229. [DOI] [PubMed] [Google Scholar]
- 26.Lamkanfi M, D'Hondt K, Vande Walle L, van Gurp M, Denecker G, Demeulemeester J, Kalai M, Declercq W, Saelens X, Vandenabeele P. J Biol Chem. 2005;280:6923–6932. doi: 10.1074/jbc.M411180200. [DOI] [PubMed] [Google Scholar]
- 27.Berra B, Colombo I, Sottocornola E, Giacosa A. Eur J Cancer Prev. 2002;11:193–197. doi: 10.1097/00008469-200204000-00013. [DOI] [PubMed] [Google Scholar]
- 28.Schmelz EM, Roberts PC, Kustin EM, Lemonnier LA, Sullards MC, Dillehay DL, Merrill AH., Jr Cancer Res. 2001;61:6723–6729. [PubMed] [Google Scholar]
- 29.Duan RD. In Vivo. 2005;19:293–300. [PubMed] [Google Scholar]
- 30.Pettus BJ, Bielawski J, Porcelli AM, Reames DL, Johnson KR, Morrow J, Chalfant CE, Obeid LM, Hannun YA. FASEB J. 2003;17:1411–1421. doi: 10.1096/fj.02-1038com. [DOI] [PubMed] [Google Scholar]
- 31.Jiang Q, Wong J, Fyrst H, Saba JD, Ames BN. Proc Natl Acad Sci USA. 2004;101:17825–17830. doi: 10.1073/pnas.0408340102. [DOI] [PMC free article] [PubMed] [Google Scholar]
- 32.Bandhuvula P, Tam Y, Oskouian B, Saba J. J Biol Chem. 2005;280:33697–33700. doi: 10.1074/jbc.C500294200. [DOI] [PubMed] [Google Scholar]
- 33.Oskouian B, Mendel J, Shocron E, Lee MA, Jr, Fyrst H, Saba JD. J Biol Chem. 2005;280:18403–18410. doi: 10.1074/jbc.M410928200. [DOI] [PubMed] [Google Scholar]
Associated Data
This section collects any data citations, data availability statements, or supplementary materials included in this article.


