Abstract
Reactive astrocytes in neurotrauma, stroke, or neurodegeneration are thought to undergo cellular hypertrophy, based on their morphological appearance revealed by immunohistochemical detection of glial fibrillary acidic protein, vimentin, or nestin, all of them forming intermediate filaments, a part of the cytoskeleton. Here, we used a recently established dye-filling method to reveal the full three-dimensional shape of astrocytes assessing the morphology of reactive astrocytes in two neurotrauma models. Both in the denervated hippocampal region and the lesioned cerebral cortex, reactive astrocytes increased the thickness of their main cellular processes but did not extend to occupy a greater volume of tissue than nonreactive astrocytes. Despite this hypertrophy of glial fibrillary acidic protein-containing cellular processes, interdigitation between adjacent hippocampal astrocytes remained minimal. This work helps to redefine the century-old concept of hypertrophy of reactive astrocytes.
Keywords: astrocyte domains, astrocyte hypertrophy
Once considered to be merely a cellular layer filling the interneuronal space and gluing neurons together (hence the term “glia”), astrocytes are receiving ever-increasing attention. The rising recognition of their importance builds on knowledge of their role in maintaining CNS homeostasis, providing nutrition for neuronal cells, and neurotransmitter recycling. Recently, astrocytes were shown to control the number and function of neuronal synapses (1, 2) and blood flow in the brain (3, 4).
Astrocytes exhibit an intricate bushy or spongiform morphology, and their very fine processes are in close contact with synapses and other components of brain parenchyma (5–8). These fine terminal processes appear postnatally in the final stage of astrocyte maturation. The subsequent elaboration of spongiform processes results in the development of boundaries between neighboring astrocyte domains, thus establishing exclusive territories for individual astrocytes, a phenomenon termed “tiling” (7, 9).
With earlier methods, including immunohistochemical detection of astrocyte markers and impregnation techniques, the extent of overlap between astrocyte territories was not amenable to investigation. However, more recent staining methods, optical imaging techniques, and 3D reconstruction paradigms using dye-filled astrocytes in semifixed tissue allowed the assessment of the boundaries of protoplasmic astrocyte territories in the CA1 area of the uninjured rat hippocampus. Neighboring astrocytes invariably touched each other but showed little interdigitation, basically tiling to form unique domains (8).
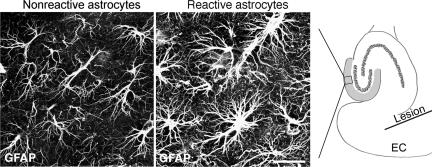
Astrocytes react to many CNS challenges, and reactive astrocytes are a hallmark of many neuropathologies. Reactive astrocytes are characterized by high-level expression of glial fibrillary acidic protein (GFAP), an intermediate filament protein, and by up-regulation of intermediate filaments in the cytoplasm. Antibodies against GFAP, the most frequently used astrocyte marker (10), reveal the cytoskeletal structure but not the true cellular morphology. Reactive astrocytes exhibit striking increases in GFAP immunoreactivity and in the number and length of GFAP-positive processes. These findings have been interpreted as cellular hypertrophy (Fig. 1) (11–17), which might be expected to increase the extent of interdigitation between astrocytes, normally in close contact in the absence of brain injury.
Fig. 1.
Entorhinal cortex lesion triggers reactive gliosis in the hippocampus. Unilateral entorhinal cortex lesion triggers astrocyte activation in the outer and middle molecular layer of the ipsilateral dentate gyrus of the hippocampus (Right, in gray). Antibodies against GFAP visualize bundles of intermediate filaments predominantly found in the soma and the main cellular processes of astrocytes. Four days after unilateral entorhinal cortex lesioning, astrocytes in the molecular layer of the dentate gyrus on the injured side were reactive and all showed greater GFAP immunoreactivity (Center) than the nonreactive astrocytes on the contralateral side (Left). The square in Right denotes the area corresponding to the images in Left and Center. EC, entorhinal cortex. (Scale bar, 25 μm.)
To determine how astrocyte activation affects both the volume of tissue reached by individual cells and the interdigitation between neighboring cells, we used a cell injection and 3D reconstruction technique (7, 8, 18, 19) to assess the morphology of reactive and nonreactive hippocampal and cortical astrocytes in mice. Contrary to the widely accepted notion of hypertrophy of reactive astrocytes, our findings suggest that these cells remain within their unique domains while at the same time increasing the thickness of their main cellular processes.
Results
To assess the morphology of reactive astrocytes, we first subjected adult mice to unilateral entorhinal cortex lesion. This injury partly interrupts the perforant pathway, which innervates the molecular layer in the ipsilateral dentate gyrus of the hippocampus (Fig. 1). Axonal degeneration triggers astrocyte activation, ≈60% synaptic loss, synapse remodeling in the molecular layer, and neurogenesis in the dentate gyrus that is not directly affected by the trauma (19–21). Astrocytes were visualized with antibodies against GFAP 4 days after the insult (Fig. 1), when astrocyte activation and hypertrophy of cellular processes are maximal, as shown by GFAP and glutamine synthase immunoreactivity (19, 22, 23). Astrocytes in the uninjured contralateral dentate gyrus had slender GFAP-positive cellular processes resembling those in noninjured mice. On the lesioned side, astrocyte reactivity was prominent in the outer and middle molecular layers of the dentate gyrus, the area partly denervated by the lesion. Reactive astrocytes appeared to have more main cellular processes containing GFAP intermediate filaments and more intermediate filament bundles than nonreactive astrocytes (Fig. 1).
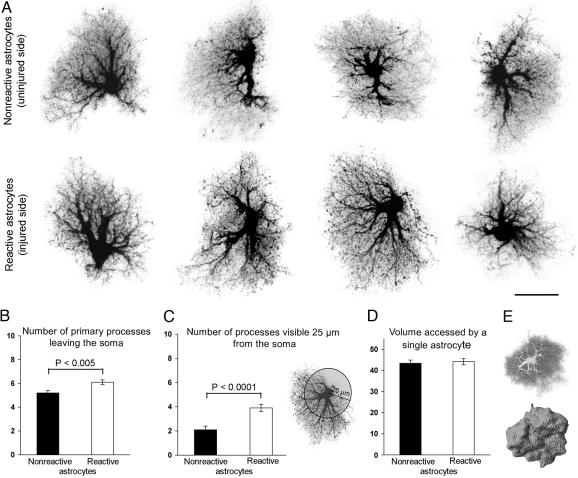
Next, individual astrocytes in the middle and outer molecular layers of the dentate gyrus on the lesioned and contralateral side were loaded with Lucifer yellow or Alexa Fluor 568. Both reactive and nonreactive astrocytes had a bushy morphology with many fine terminal processes protruding from the main cellular processes (Fig. 2A), as did astrocytes in noninjured mice (data not shown). Individual reactive and nonreactive astrocytes varied considerably in shape and appearance. Many astrocytes had one or several cellular processes terminating in glial end-feet surrounding blood vessels.
Fig. 2.
Morphological assessment of reactive and nonreactive astrocytes in the hippocampus. (A) Maximum projections of dye-filled reactive and nonreactive astrocytes in the molecular layer of the dentate gyrus 4 days after entorhinal cortex lesioning. Dye-filling revealed fine spongiform processes in reactive astrocytes comparable with those of nonreactive astrocytes but a greater number of main processes extending from the cell soma of reactive astrocytes. (Scale bar, 25 μm.) (B and C) Quantification of main cellular processes leaving the soma (B) and processes visible 25 μm from the cell soma (C). Thick processes were more numerous in reactive astrocytes than in nonreactive astrocytes. Three-dimensional reconstruction (E) shows that reactive and nonreactive astrocytes access similar volumes of tissue (D; unit y axis 103 μm3). Error bars represent SEM.
The main cellular processes appeared to be thicker in reactive than in nonreactive astrocytes (Fig. 2A). In addition, we found that the number of primary processes leaving the soma was increased in reactive compared with nonreactive astrocytes (6.1 ± 0.2 versus 5.2 ± 0.2; P < 0.005; n = 47 and 44 cells, respectively) (Fig. 2B). On maximum projection images of individual cells, reactive astrocytes also had more main processes extending at least 25 μm from the cell soma than nonreactive astrocytes (3.9 ± 0.3 versus 2.1 ± 0.3; P < 0.0001; n = 47 and 42 cells, respectively) (Fig. 2C).
To determine whether hypertrophy of cellular processes affects the volume of tissue reached by reactive astrocytes, we compared the volume accessed by reactive astrocytes on the injured side with that accessed by nonreactive astrocytes on the uninjured side (Fig. 2 D and E). Single nonreactive and reactive astrocytes accessed similar volumes of tissue (43.4 ± 1.4 versus 44.2 ± 1.5 103 μm3; P = 0.71; range of 26–69 and 30–70 103 μm3; n = 43 and 43 cells, respectively; with α 0.05 and β 0.2, a difference of 10% or higher would be detected) (Fig. 2D). Thus, the increased thickness of cellular processes does not alter the action radius of reactive astrocytes in the hippocampus.
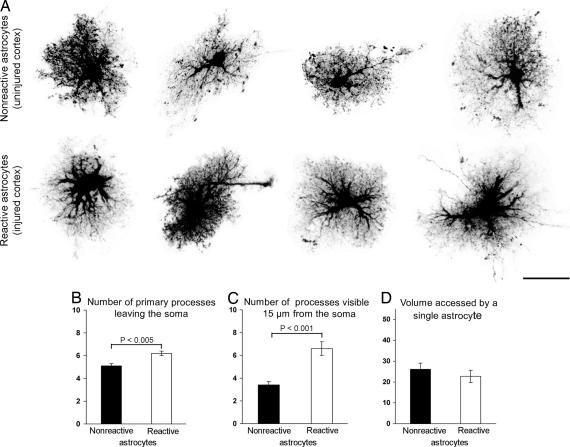
We next investigated whether the lack of cellular hypertrophy seen in reactive astrocytes in the deafferented dentate gyrus was a response shared by astrocytes outside the hippocampus. We assessed the morphological appearance of reactive astrocytes in the cerebral cortex after electrically induced lesioning (24). This injury paradigm induces extensive neuronal death and strong astrocyte activation (Fig. 3C). Four days after the lesion, we studied the morphology of reactive astrocytes in cortical layer I by loading astrocytes 200–800 μm from the injury border with Lucifer yellow. Reactive astrocytes showed strongly GFAP-positive cellular processes in the region surrounding the necrotic area (Fig. 3A), whereas the same region in uninjured mice showed only weakly GFAP-positive astrocytes (Fig. 3B). Examination of reactive astrocytes filled with Lucifer yellow revealed a bushy morphology with many fine terminal processes protruding from the main cellular processes, similar to astrocytes filled in uninjured mice. The main cellular processes appeared to be thicker in reactive than in nonreactive astrocytes (Fig. 4A). The number of primary processes leaving the soma was increased in reactive compared with nonreactive astrocytes (6.2 ± 0.2 versus 5.1 ± 0.3; P < 0.005; n = 25 and 18 cells, respectively) (Fig. 4B). On maximum projection images of individual cells, reactive astrocytes had more main processes extending at least 15 μm from the cell soma than nonreactive astrocytes (6.6 ± 0.6 versus 3.4 ± 0.3; P < 0.001; n = 24 and 18 cells, respectively) (Fig. 4C). As demonstrated above for hippocampal astrocytes, single nonreactive and reactive cortical astrocytes accessed similar volumes of tissue (26.1 ± 2.9 versus 22.7 ± 2.8 103 μm3; P = 0.41; range of 9–50 and 10–56 103 μm3; n = 18 and 20 cells, respectively; with α 0.05 and β 0.2, a difference of 40% or higher would be detected) (Fig. 4D).
Fig. 3.
Electrically induced lesion of the cerebral cortex triggers astrocyte activation in the surrounding tissue. Four days after injury, reactive astrocytes in the cerebral cortex around the lesion show highly increased GFAP immunoreactivity (A and B). (C) Schematic presentation of the injury with the rectangle corresponding to the area shown in A. An asterisk indicates the necrotic area; the dotted line indicates the injury border. CC, corpus callosum. (Scale bar, 100 μm.)
Fig. 4.
Morphological assessment of reactive and nonreactive cortical astrocytes. (A) Maximum projections of dye-filled reactive and nonreactive astrocytes in layer I of cerebral cortex 4 days after cortical lesioning. Dye-filling reveals fine spongiform processes in reactive astrocytes comparable to those of nonreactive astrocytes but a greater number of main processes extending from the cell soma of reactive astrocytes. (Scale bar, 25 μm.) (B and C) Quantification of main cellular processes leaving the soma (B) and processes visible 15 μm from the cell soma (C). Thick processes were more numerous in reactive astrocytes than in nonreactive astrocytes. Three-dimensional reconstruction shows that reactive and nonreactive astrocytes access similar volumes of tissue (D; unit y axis 103 μm3). Error bars represent SEM.
Thus, the increased thickness of astrocyte processes did not increase the astrocyte domains in the deafferented dentate gyrus of the hippocampus or in the electrically lesioned cortex.
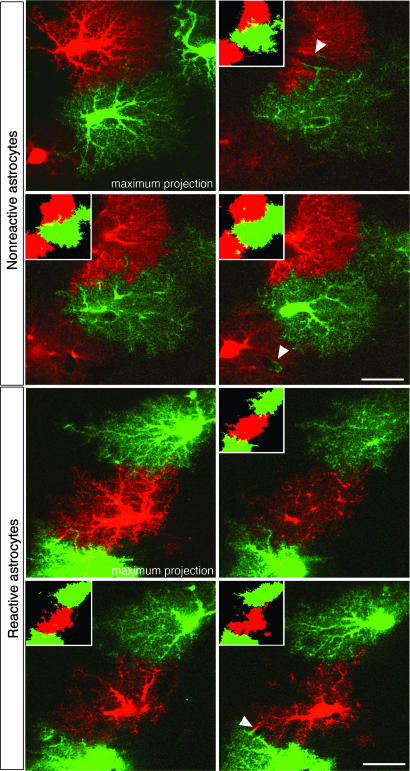
In the adult mammalian brain, the access domain of individual hippocampal astrocytes shows minimal overlap and interdigitation of fine cellular processes between adjacent astrocytes (8, 25). To compare the extent of interdigitation of reactive and nonreactive astrocytes, we injected Lucifer yellow and Alexa Fluor 568 into adjacent astrocytes in the dentate gyrus after unilateral entorhinal cortex lesion and evaluated the overlap between astrocyte territories on optical sections (Fig. 5). Interdigitation was also assessed on 3D images of dye-filled neighboring astrocytes, and the overlap was highlighted in a pseudocolor (Fig. 6A and Movies 1 and 2, which are published as supporting information on the PNAS web site). Quantification of the overlapping domains on series of optical sections showed minimal interdigitation between reactive astrocytes and comparable with that between nonreactive astrocytes (4.5 ± 0.8 versus 3.1 ± 0.6%; ranging from 0.06 to 12.9% for individual astrocytes; n = 20 and 18 cells, respectively). Thus, the hypertrophy of cellular processes upon astrocyte activation in the hippocampus did not affect the extent of overlap between the unique domains of individual astrocytes.
Fig. 5.
Overlap between astrocyte territories assessed by dye-filling of neighboring cells (Lucifer yellow and Alexa Fluor 568). Maximum projections of astrocytes in the molecular layer of the dentate gyrus on the lesioned and contralateral sides show adjacent astrocyte territories (domains) on three optical sections 4 μm apart. Insets show territories with overlapping areas in yellow. The extent of interdigitation between neighboring astrocytes, both reactive and nonreactive, was limited and most prominent around blood vessels (arrowheads). (Scale bar 25 μm.)
Fig. 6.
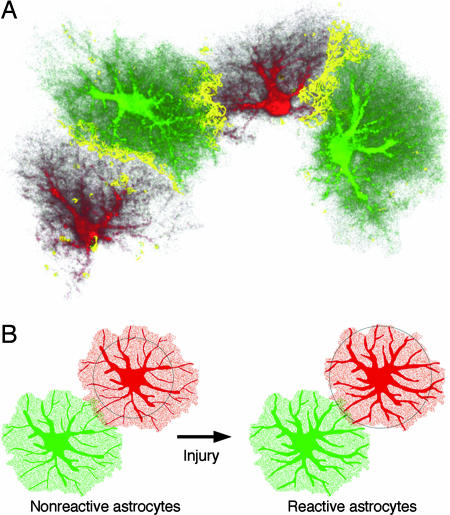
The domains of nonreactive and reactive astrocytes—a concept. (A) Interdigitation of fine cellular processes in a 3D reconstruction of astrocytes in the dentate gyrus. The yellow zone shows the border area where cellular processes of two adjacent astrocytes interdigitate. (B) Reactive astrocytes stay within their domains, but their main cellular processes get thicker, making them visible over a greater distance (illustrated here by the circles).
Discussion
This study shows that astrocytes in the denervated dentate gyrus and lesioned cerebral cortex remain within their domains and that the overlap between individual astrocyte domains in the denervated dentate gyrus remains minimal. Although the main cellular processes of reactive astrocytes containing GFAP intermediate filaments become thicker, the overall size of these cells was similar to that of nonreactive astrocytes. When visualized by antibodies against intermediate filament protein GFAP, these thicker processes appear longer, because they can be followed over greater distances. However, the hypertrophy of cellular processes did not affect the volume of tissue accessed by individual astrocytes via their fine spongiform processes (Fig. 6B) and thus did not result in cellular hypertrophy.
Previously, the volume of tissue accessed by dye-filled nonreactive astrocytes was measured in rat and mouse CA1 stratum radiatum of the hippocampus (8, 25). Our findings suggest that both reactive and nonreactive astrocytes in the molecular layer of the dentate gyrus of the mouse hippocampus, and even more so astrocytes in the cortical layer I, access a smaller volume of tissue than astrocytes in stratum radiatum. Overlap of individual astrocyte domains of nonreactive astrocytes in the stratum radiatum was very limited. In the molecular layer of the dentate gyrus, we found a comparably small extent of interdigitation between processes of neighboring astrocytes. Most importantly, this territorial overlap was minimal in astrocytes reacting to an injury.
Quantification of astrocyte cell density in rat cerebral cortex (26) and calculations of average volume of cortical astrocytes based on the length of GFAP-positive processes (27) indicated a substantial overlap between neighboring astrocyte domains in the rat cortex (28). Our experimental data on cortical astrocytes reacting to electrically induced lesions showed that the volume of tissue accessed by reactive and nonreactive astrocytes was similar, suggesting that the amount of territorial overlap between reactive astrocytes is comparable with that of nonreactive cortical astrocytes. The extent to which this applies to other injuries in the brain or in the spinal cord remains to be established, because the morphological and functional responses of astrocytes may depend on the type of insult.
In the neonatal CNS, the main processes of neighboring immature astrocytes interdigitate extensively; gradually these cells develop fine spongiform processes and assume their mature territories with only a limited overlap (7). Given their similarities with immature astrocytes, reactive astrocytes might be expected to form more extensive interdigitations between the domains of individual astrocytes. However, our data indicate that this is not the case. The limited overlap between both reactive and nonreactive astrocytes suggests that the fine spongiform processes are distributed to access tissue evenly and efficiently. The best way to achieve this may be through contact spacing and pruning of interdigitating processes to establish exclusive astrocyte territories.
Sufficiently stable cellular territories might be necessary for the morphological and functional connection within the astrocyte syncytium and in situations such as axonal degeneration or a direct neurotrauma can be essential for the astrocyte network to carry out functions such as communication across gap junctions or spacial buffering.
In conclusion, our findings suggest that the term “cellular hypertrophy” frequently used to describe morphological changes in reactive astrocytes may be misleading. Instead, reactive astrocytes show hypertrophy of their intermediate filament-rich main cellular processes but seem to remain within their unique “tiled” territories.
Methods
Surgical Procedures.
Unilateral entorhinal cortex lesioning was performed as described (29) in six 5-mo-old females. Electrically induced injury of the cerebral cortex was performed as described (24) in six 10-mo-old female mice. All mice were on a mixed genetic background (C57BL/6, 129Sv, 129Ola) and were maintained in a barrier animal facility.
Anesthetized mice were placed in a stereotactic frame, and a hole was drilled through the skull. For entorhinal cortex lesion, a retractable wire knife (Kopf Instruments, Tujunga, CA) was lowered 1 mm down from the dura +3.6 mm laterally and −0.2 mm posterior to lambda. The wire knife was expanded 2 mm horizontally and then lowered 2 mm twice at +30° and −135° to avoid the hippocampal formation. For electrically induced lesion of the cerebral cortex, a fine-needle electrode was inserted through the skull 2.25 mm laterally at the level of bregma and lowered 1.0 mm (measured from the meningeal level) into the cortex of the right hemisphere. A second electrode was attached to the root of the tail. By using Lesion Maker (Ugo Basile, Comerio, Italy), a direct current of 5 mA was applied for 10 sec. The mice were kept in heated cages until they recovered from anesthesia.
Dye-Filling of Astrocytes.
Cells in fixed tissue were filled with dye by methods adapted from described protocols (30, 31). Four days after lesioning, the mice were deeply anesthetized with Nembutal (10 mg/100 g of body weight) and transcardially perfused with oxygenated Ringer's solution (37°C) (0.79% NaCl/0.038% KCl/0.02% MgCl2·6H2O/0.018% Na2HPO4/0.125% NaHCO3/0.03% CaCl2·2H2O/0.2% dextrose/0.02% xylocaine) and then with 4% paraformaldehyde in PBS (pH 7.4, 37°C) for 10 min. The brain was extracted and postfixed in ice-cold 4% paraformaldehyde for 1 h and cut with a vibratome into 75- to 100-μm-thick slices. The slices were stored in PBS at 4°C until analysis.
The slices were placed under a ×60 water objective (N.A. of 1.4) and observed with an Olympus (Center Valley, PA) BX50WI microscope with infrared differential interference contrast optics. Astrocytes were identified by the shape and size of their somata. Glass micropipettes (o.d., 1.00 mm; i.d., 0.58 mm; resistance, 100–400 MΩ) were pulled on a vertical puller (Kopf Instruments) and backfilled with 5% aqueous Lucifer yellow (Sigma-Aldrich, St. Louis, MO) or 10 mM Alexa Fluor 568 (Molecular Probes, Eugene, OR) in 200 mM KCl. Astrocytes in the outer and middle molecular layer of the dentate gyrus of the hippocampus or in layer I of cerebral cortex were impaled and iontophoretically injected with the respective dye by using 1-sec pulses of negative current (0.5 Hz) for 1–2 min. After several cells were filled, the slices were placed in ice-cold 4% paraformaldehyde overnight and then coverslipped in Gelvatol (32).
Immunohistochemistry.
The slices were placed in ice-cold 4% paraformaldehyde overnight at 4°C. The next day, the slices were repeatedly washed in PBS and permeabilized for 1 h at room temperature in PBS containing 1% BSA, 0.25% Triton X-100, and 3% normal donkey serum, followed by incubation with guinea pig antibodies against GFAP (Sigma-Aldrich; 1:100) for 48 h at 4°C in PBS containing 1% BSA, 0.1% Triton X-100, and 0.3% normal donkey serum. After several washes in PBS, the slices were incubated overnight at 4°C with donkey anti-guinea pig antibodies conjugated with RRX (1:300; Jackson ImmunoResearch, West Grove, PA) and mounted in Gelvatol.
Image Acquisition and Analysis.
Confocal z-series were acquired with a Radiance 2000 laser-scanning confocal microscope system (Bio-Rad, Hercules, CA) attached to a Nikon (Kanagawa, Japan) E600FN microscope and an Olympus FluoView 1000 laser-scanning confocal microscope system attached to an Olympus IX81 microscope, both equipped with a ×60 oil-immersion objective (Plan Apo N.A. of 1.4 and 1.42, respectively). Images were visualized and analyzed with Imaris 4.0.4 (Bitplane, Zurich, Switzerland) and ImageJ (National Institutes of Health, Bethesda, MD). The number of cellular processes leaving the soma was assessed on the stack of optical sections from individual astrocytes. Main cellular processes extending more than 25 or 15 μm from the soma (see Fig. 2C), for hippocampal or cortical astrocytes, respectively, were counted on maximum projections of dye-filled astrocytes. The volume of tissue reached by dye-filled astrocytes was measured on 3D reconstructions of the astrocytes by thresholding the images and then creating a volume of the thresholded voxels (see Fig. 2E). Interdigitation between adjacent hippocampal astrocytes was evaluated on optical sections through adjacent astrocytes filled with different dyes (Lucifer yellow and Alexa Fluor 568). For quantification of overlapping astrocyte domains, each astrocyte territory was manually delineated and pseudocolored, the areas of overlapping territories on optical sections were measured and expressed as a percentage of the total astrocyte area. Interdigitation was also visualized on 3D reconstructed images of dye-filled astrocytes by adding a Gaussian blur filter. The double-colored voxels, indicating areas with neighboring astrocyte processes in close proximity, were then selected and highlighted on the original 3D image.
Supplementary Material
Acknowledgments
U.W. was supported by Swedish Medical Society Grant 16850, Wilhelm och Martina Lundgrens stiftelsen, and Hjärnfonden and Åhlén-stiftelsen; M.P. was supported by Swedish Research Council Grant 11548, the Swedish Stroke Association, ALF Göteborg, Hjärnfonden, Trygg-Hansa, and Torsten och Ragnar Söderbergs stiftelser; and M.H.E. was supported by National Institutes of Health Grants RR004050, NS046068, NS014718, and CA4084314.
Abbreviation
- GFAP
glial fibrillary acidic protein.
Footnotes
The authors declare no conflict of interest.
This article is a PNAS direct submission.
References
- 1.Ullian EM, Sapperstein SK, Christopherson KS, Barres BA. Science. 2001;291:657–661. doi: 10.1126/science.291.5504.657. [DOI] [PubMed] [Google Scholar]
- 2.Christopherson KS, Ullian EM, Stokes CC, Mullowney CE, Hell JW, Agah A, Lawler J, Mosher DF, Bornstein P, Barres BA. Cell. 2005;120:421–433. doi: 10.1016/j.cell.2004.12.020. [DOI] [PubMed] [Google Scholar]
- 3.Mulligan SJ, MacVicar BA. Nature. 2004;431:195–199. doi: 10.1038/nature02827. [DOI] [PubMed] [Google Scholar]
- 4.Zonta M, Angulo MC, Gobbo S, Rosengarten B, Hossmann KA, Pozzan T, Carmignoto G. Nat Neurosci. 2003;6:43–50. doi: 10.1038/nn980. [DOI] [PubMed] [Google Scholar]
- 5.Grosche J, Matyash V, Moller T, Verkhratsky A, Reichenbach A, Kettenmann H. Nat Neurosci. 1999;2:139–143. doi: 10.1038/5692. [DOI] [PubMed] [Google Scholar]
- 6.Kosaka T, Hama K. J Comp Neurol. 1986;249:242–260. doi: 10.1002/cne.902490209. [DOI] [PubMed] [Google Scholar]
- 7.Bushong EA, Martone ME, Ellisman MH. Int J Dev Neurosci. 2004;22:73–86. doi: 10.1016/j.ijdevneu.2003.12.008. [DOI] [PubMed] [Google Scholar]
- 8.Bushong EA, Martone ME, Jones YZ, Ellisman MH. J Neurosci. 2002;22:183–192. doi: 10.1523/JNEUROSCI.22-01-00183.2002. [DOI] [PMC free article] [PubMed] [Google Scholar]
- 9.Haber M, Murai K. Neuron Glia Biol. 2006;2:59–66. doi: 10.1017/S1740925X06000032. [DOI] [PubMed] [Google Scholar]
- 10.Eng LF, Ghirnikar RS, Lee YL. Neurochem Res. 2000;25:1439–1451. doi: 10.1023/a:1007677003387. [DOI] [PubMed] [Google Scholar]
- 11.Kimelberg HK, Norenberg MD. Sci Am. 1989;260:66–72. doi: 10.1038/scientificamerican0489-66. 74, 76. [DOI] [PubMed] [Google Scholar]
- 12.Eddleston M, Mucke L. Neuroscience. 1993;54:15–36. doi: 10.1016/0306-4522(93)90380-X. [DOI] [PMC free article] [PubMed] [Google Scholar]
- 13.Ridet JL, Malhotra SK, Privat A, Gage FH. Trends Neurosci. 1997;20:570–577. doi: 10.1016/s0166-2236(97)01139-9. [DOI] [PubMed] [Google Scholar]
- 14.Fawcett JW, Asher RA. Brain Res Bull. 1999;49:377–391. doi: 10.1016/s0361-9230(99)00072-6. [DOI] [PubMed] [Google Scholar]
- 15.McGraw J, Hiebert GW, Steeves JD. J Neurosci Res. 2001;63:109–115. doi: 10.1002/1097-4547(20010115)63:2<109::AID-JNR1002>3.0.CO;2-J. [DOI] [PubMed] [Google Scholar]
- 16.Silver J, Miller JH. Nat Rev Neurosci. 2004;5:146–156. doi: 10.1038/nrn1326. [DOI] [PubMed] [Google Scholar]
- 17.Sofroniew MV. Neuroscientist. 2005;11:400–407. doi: 10.1177/1073858405278321. [DOI] [PubMed] [Google Scholar]
- 18.Bushong EA, Martone ME, Ellisman MH. J Comp Neurol. 2003;462:241–251. doi: 10.1002/cne.10728. [DOI] [PubMed] [Google Scholar]
- 19.Wilhelmsson U, Li L, Pekna M, Berthold CH, Blom S, Eliasson C, Renner O, Bushong E, Ellisman M, Morgan TE, et al. J Neurosci. 2004;24:5016–5021. doi: 10.1523/JNEUROSCI.0820-04.2004. [DOI] [PMC free article] [PubMed] [Google Scholar]
- 20.Matthews DA, Cotman C, Lynch G. Brain Res. 1976;115:1–21. doi: 10.1016/0006-8993(76)90819-2. [DOI] [PubMed] [Google Scholar]
- 21.Steward O, Vinsant SL. J Comp Neurol. 1983;214:370–386. [Google Scholar]
- 22.Steward O, Torre ER, Phillips LL, Trimmer PA. J Neurosci. 1990;10:2373–2384. doi: 10.1523/JNEUROSCI.10-07-02373.1990. [DOI] [PMC free article] [PubMed] [Google Scholar]
- 23.Rose G, Lynch G, Cotman CW. Brain Res Bull. 1976;1:87–92. doi: 10.1016/0361-9230(76)90052-6. [DOI] [PubMed] [Google Scholar]
- 24.Enge M, Wilhelmsson U, Abramsson A, Stakeberg J, Kuhn R, Betsholtz C, Pekny M. Neurochem Res. 2003;28:271–279. doi: 10.1023/a:1022421001288. [DOI] [PubMed] [Google Scholar]
- 25.Ogata K, Kosaka T. Neuroscience. 2002;113:221–233. doi: 10.1016/s0306-4522(02)00041-6. [DOI] [PubMed] [Google Scholar]
- 26.Distler C, Dreher Z, Stone J. Glia. 1991;4:484–494. doi: 10.1002/glia.440040508. [DOI] [PubMed] [Google Scholar]
- 27.Rohlmann A, Wolff J. In: Gap Junctions in the Nervous System. Spray D, Dermietzel R, editors. New York: Landes; 1996. pp. 175–192. [Google Scholar]
- 28.Chao T, Rickmann M, Wolff J. In: The Tripartite Synapse: Glia in Synaptic Transmission. Volterra A, Magistretti P, Haydon P, editors. New York: Oxford Univ Press; 2002. pp. 3–32. [Google Scholar]
- 29.Stone DJ, Rozovsky I, Morgan TE, Anderson CP, Finch CE. J Neurosci. 1998;18:3180–3185. doi: 10.1523/JNEUROSCI.18-09-03180.1998. [DOI] [PMC free article] [PubMed] [Google Scholar]
- 30.Belichenko PV, Dahlstrom A. J Neurosci Methods. 1995;57:55–61. doi: 10.1016/0165-0270(94)00125-z. [DOI] [PubMed] [Google Scholar]
- 31.Buhl EH. Microsc Res Tech. 1993;24:15–30. doi: 10.1002/jemt.1070240104. [DOI] [PubMed] [Google Scholar]
- 32.Harlow E, Lane D. Antibodies: A Laboratory Manual. Cold Spring Harbor, NY: Cold Spring Harbor Lab Press; 1988. [Google Scholar]
Associated Data
This section collects any data citations, data availability statements, or supplementary materials included in this article.


