Abstract
The role and essentiality of silicon (Si) in plant biology have been debated for >150 years despite numerous reports describing its beneficial properties. To obtain unique insights regarding the effect of Si on plants, we performed a complete transcriptome analysis of both control and powdery mildew-stressed Arabidopsis plants, with or without Si application, using a 44K microarray. Surprisingly, the expression of all but two genes was unaffected by Si in control plants, a result contradicting reports of a possible direct effect of Si as a fertilizer. In contrast, inoculation of plants, treated or not with Si, altered the expression of a set of nearly 4,000 genes. After functional categorization, many of the up-regulated genes were defense-related, whereas a large proportion of down-regulated genes were involved in primary metabolism. Regulated defense genes included R genes, stress-related transcription factors, genes involved in signal transduction, the biosynthesis of stress hormones (SA, JA, ethylene), and the metabolism of reactive oxygen species. In inoculated plants treated with Si, the magnitude of down-regulation was attenuated by >25%, an indication of stress alleviation. Our results demonstrate that Si treatment had no effect on the metabolism of unstressed plants, suggesting a nonessential role for the element but that it has beneficial properties attributable to modulation of a more efficient response to pathogen stress.
Keywords: Erysiphe cichoracearum, microarray, transcriptome
Despite its ubiquity, the element silicon (Si) is generally considered to be biologically unreactive (1). In a few primitive life forms, such as diatoms and Equisetaceae, Si is required for growth and development (2, 3). In plant nutrition, silicon (Si) was not included in the list of elements considered to be essential for plant growth following von Sachs' pioneering work on nutrient solutions (4). This exclusion has been strongly debated in recent years even though the exact benefits conferred by Si remain unexplained. Epstein and Bloom (5) argue that the significance of Si in plants is so common that it should be assigned the status of “quasi-essential.”
Several studies have shown that Si, in the form of uncharged monosilicic acid, is actively absorbed by the root system in a number of plant species at rates comparable with those of major nutrients (6–8). Recently, a silicon transporter was characterized in rice (9). Nevertheless, no study has been able to ascribe a specific role for Si in planta. The most positive and consistent results have been found in alleviation of biotic and abiotic stresses (10). To date, dozens of reports have confirmed the prophylactic effects of Si against plant diseases, most notably powdery mildews and rice blast (11). Originally, this protective role was attributed to the accumulation of silica in the leaves, which was believed to interfere with pathogen penetration into the epidermal cells (12). This hypothesis of a passive role, as a mechanical barrier, has been contradicted by reports of protection against root pathogens and by evidence of resistance being induced by Si in plants challenged by pathogens (13–15). These latest results have exacerbated the confusion surrounding the elusive role of Si in plant biology.
Our general understanding of plant physiology and plant–pathogen interactions has been greatly enhanced by the use of the model plant Arabidopsis thaliana (L.) Heynh (16–19). A. thaliana was shown to take up Si and was subsequently more resistant to the fungal pathogen Erysiphe cichoracearum DC (20). The events leading to this prophylactic role of Si in A. thaliana were similar to those observed in cucumber–powdery mildew and wheat–powdery mildew interactions, thereby confirming that A. thaliana was a suitable model to study the role of Si in plants.
The recent application of high-throughput approaches has been instrumental in deciphering key genes and key defense pathways induced in plants in response to stress (21). In this work, we exploited the latest developments in microarray technologies and the annotation of the Arabidopsis genome (22) to perform a comprehensive analysis of the influence of Si on the Arabidopsis transcriptome. The impact of Si application on gene expression in control or infected Arabidopsis plants was assessed. Genes that were differentially expressed were functionally categorized. The analysis of differential expression of genes involved in primary and secondary metabolism confirms and contradicts some roles attributed to Si that have been the object of debate for nearly 150 years.
Results
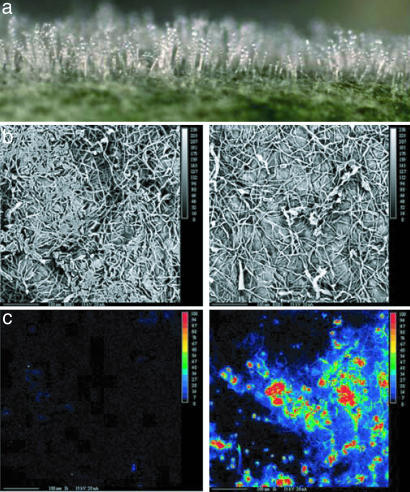
Profuse mycelial development and conidiation typical of E. cichoracearum were readily observable on Si-minus inoculated plants (Fig. 1a). Si treatment of Arabidopsis led to reduced levels of powdery mildew (lower density of mycelium and conidia) infection on leaves (Fig. 1b) and was characterized by strong accumulation of amorphous Si in leaf tissues (Fig. 1c).
Fig. 1.
Si treatment and powdery mildew of Arabidopsis. (a) Powdery mildew colonies of E. cichoracearum on Arabidopsis leaves. (b) Scanning electron microscopy of mycelial mat on control (Left) and Si-treated (Right) leaves. (c) X-ray microanalysis for Si detection in control (Left) and Si-treated (Right) plants; the concentration of Si is indicated by color (see Inset), where red represents the highest concentration of Si and black indicates no Si.
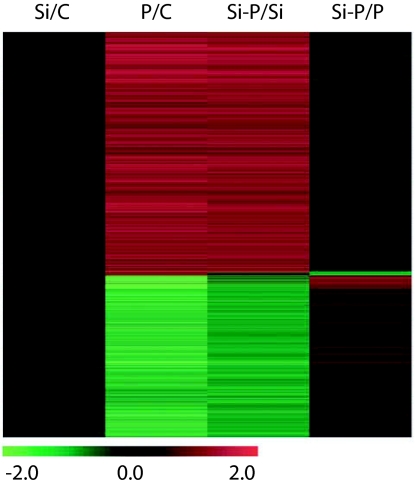
Microarray experiments (GEO accession number GSE5718) yielded remarkably consistent results across replicates and dye-swap in all four comparisons tested (Fig. 6, which is published as supporting information on the PNAS web site). The application of Si to noninoculated plants altered the relative abundance of only 2 of the nearly 40,000 transcripts (28,500 genes and over 10,000 unannotated transcripts) present on the chip (Fig. 2; Si/C). These two genes (At5g22460.1 and At1g21860.1) code, respectively, for an “esterase lipase thioesterase family protein” and a “multicopper oxidase type I family protein.” In contrast, powdery mildew inoculation of plants resulted in the up-regulation of 2,387 genes and the down-regulation of 1,583 genes (Fig. 2; P/C). Upon functional categorization, many of the up-regulated genes were defense-related, whereas a large proportion of down-regulated genes were involved in primary metabolism. A remarkably similar pattern of gene expression was observed upon infection of Si-treated plants (Fig. 2; Si-P/Si). The median increase in gene expression among up-regulated genes was identical (2.3-fold in both P/C and Si-P/Si). Conversely, the median decrease was attenuated by 25% in the presence of Si (2.8-fold in P/C vs. 2.1-fold in Si-P/Si). In the last comparison (Fig. 2; Si-P/P), an expectedly limited set of genes showed a significant change in expression. This subset of genes represents those where the effect of pathogen stress was attenuated the most by Si. Up-regulated genes (92) were notably linked to photosynthesis and energy pathways, whereas down-regulated genes (41) were mostly of unknown function. A complete list of these genes is provided in Table 1, which is published as supporting information on the PNAS web site.
Fig. 2.
Differential gene expression in Arabidopsis leaves after Si treatment and/or pathogen inoculation. The columns represent the contrasts between the treatments: control (C), silicon (Si), E. cichoracearum (P), or a combination of both (Si-P). Each of the 3,970 differentially expressed genes (P < 0.01, ≥1.5-fold change) in at least one contrast is represented by a colored line indicating the mean (n = 6) relative transcript level: green corresponds to a log2 ratio of −2 (down-regulation), and red corresponds to a log2 ratio of 2 (up-regulation).
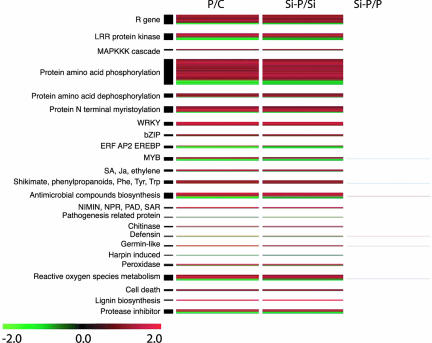
Because the effect of Si was only manifest in the presence of the pathogen, genes associated with plant defense and pathogenesis were analyzed in more detail (Fig. 3). Overall, genes related to plant defense were mostly up-regulated after inoculation. These included R genes, stress-related transcription factors, and genes involved in signal transduction, the biosynthesis of stress hormones (SA, JA, ethylene), the metabolism of reactive oxygen species, the biosynthesis of antimicrobial compound, etc. At the same time, the presence of the pathogen did affect negatively the expression of a number of defense genes belonging to the same classes.
Fig. 3.
Differentially expressed genes in Arabidopsis leaves and related to defense reactions and associated expression profiles. The columns represent some contrasts between the treatments: control (C), silicon (Si), E. cichoracearum (P), or a combination of both (Si-P). Among regulated genes, 616 were classified as plant defense-related. Each one of these genes (P < 0.01, ≥1.5-fold change) in at least one contrast is represented by a colored line indicating the mean relative transcript level (n = 6): green corresponds to a log2 ratio of −2 (down-regulation), and red corresponds to a log2 ratio of 2 (up-regulation).
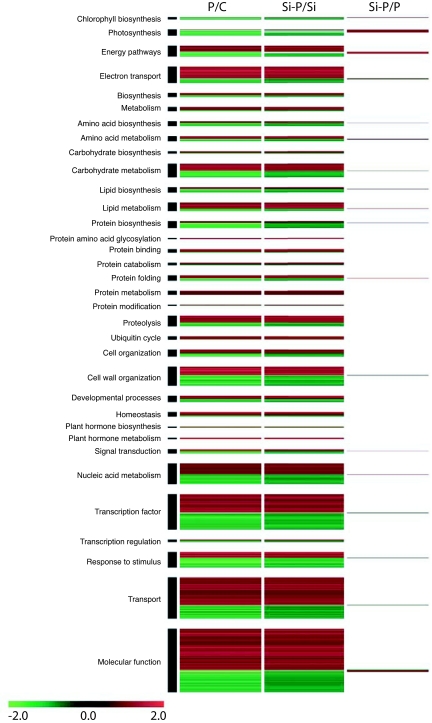
Unsurprisingly, infection of Arabidopsis plants with the biotroph E. cichoracearum impacted many genes involved in primary metabolism. In processes such as photosynthesis and energy pathways (glycolysis, TCA cycle, carbon fixation, pentose phosphate pathways, oxidative phosphorylation), amino acid, carbohydrate and lipid metabolism, and protein biosynthesis, several genes were down-regulated as a direct result of infection. Many of these same genes were less severely affected when plants were treated with Si. Prevalent classes of genes significantly restored by Si included 17 genes involved in photosynthesis and 11 genes involved in energy pathways (Fig. 4).
Fig. 4.
Differentially expressed genes in Arabidopsis leaves related to primary metabolism and cellular processes and associated expression profiles. The columns represent some contrasts between the treatments: control (C), silicon (Si), E. cichoracearum (P), or a combination of both (Si-P). Among regulated genes, 2,089 were classified as related to plant metabolism or cellular processes. Each one of these genes (P < 0.01, ≥1.5-fold change) in at least one contrast is represented by a colored line indicating the mean relative transcript level (n = 6): green corresponds to a log2 ratio of −2 (down-regulation), and red corresponds to a log2 ratio of 2 (up-regulation).
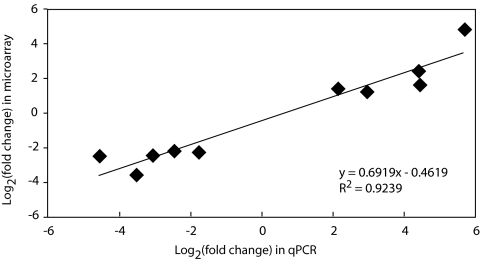
To independently validate the microarray results, quantitative real-time PCR was performed on 10 selected genes that had been significantly altered in the comparisons P/C, Si-P/P, or both. Quantitative PCR and microarray results were linearly correlated (R2 = 0.92) (Fig. 5).
Fig. 5.
Correlation between microarray and quantitative real-time PCR data. Log2 of fold change determined by microarray (y axis) and quantitative real-time PCR (x axis) are plotted for a subset of 10 differentially expressed genes in Arabidopsis leaves.
Discussion
The role of Si in plants has puzzled plant physiologists since it was considered to be nonessential for plant growth. There are several reports on its fertilizing properties (23–25), and some argue that silicon is involved in a large number of structural and dynamic aspects of plant life; its roles are surprisingly diverse if poorly defined (11, 26, 27). In this work, we intended to describe thoroughly the transcriptional changes in plants that could explain the beneficial effects of Si. We analyzed control and powdery mildew-stressed plants using the 44K Arabidopsis microarray (Agilent Technologies) that includes 39,941 features. This study constitutes a complete transcriptome analysis aimed at studying the role of Si in plants.
Our observations of many up- and down-regulated genes in infected Arabidopsis plants confirmed previous reports of altered gene expression in response to biotic stress (28–34). Powdery mildew fungi such as E. cichoracearum are strict biotrophs known to slow down primary plant metabolism as a major symptom (35–38). Accordingly, many genes related to primary metabolism were affected by the presence of the pathogen, a consequence of the pathogen's haustoria diverting the plant's resources for their needs (32, 39). Conversely, the plant reacted to the presence of the pathogen through up-regulation of many genes associated with plant defense mechanisms. Our results are in agreement with innumerable studies of plant–pathogen interactions, because many genes previously reported to play a role in such interactions (32, 40–43) were also identified in this study (Fig. 3). Defense responses did not avert the compatibility of the interaction but were seemingly more efficient in Si-treated plants as reflected by the lower level of infection and the attenuated detrimental effects on primary metabolism. Inoculated plants developed a regular but, most importantly, stressful infection level that induced noticeable transcriptional changes and revealed differences among Si treatments, as was previously denoted with microscopic observations by Ghanmi et al. (20).
Our data lead us to conclude that Si had no significant effect on any but 2 of the ≈40,000 transcripts analyzed when supplied to plants growing under controlled conditions. These results were consistent on all plants tested even though A. thaliana did absorb Si in important amounts as observed here and reported previously (20). In rice, Watanabe et al. (44) concluded that differences in gene expression were not appreciable between Si-treated and nontreated plants in the absence of stress. These observations are in line with the concept that the effect of supplying Si is only manifest when the plant is under some form of stress and that this effect is not latent but only activated upon stress. One could thus speculate that the benefits of Si treatment are mostly indirect in the form of stress alleviation rather than having a direct effect on plant growth as is sometimes proposed (45–47). In addition, the apparent lack of interaction of Si with plant metabolism reinforces the debated hypothesis that Si is not an essential element to plants.
The general alleviation of down-regulation in Si-P/Si is possibly the most compelling result supporting the beneficial properties of Si in stressed plants. Genes in which down-regulation was less severe as a result of Si treatment belonged to key classes of genes involved in primary metabolism. This result is consistent with a reduction in the stress normally imposed by a biotrophic fungus. This is also in line with the consensus that supplying Si will usually delay the onset of disease or reduce its incidence, because the transcriptional response is only different in its intensity and not its nature. It is quite revealing that the same genes were up-regulated to a comparable extent in the P/C and Si-P/Si. Two major conclusions can be drawn from these observations: (i) the role of Si cannot be limited solely to a mechanical barrier because this would require no metabolic changes (e.g., induction of defense responses); and (ii) Si does modulate a more efficient or better synchronized defense response by the plant (this translates into an alleviation of the stress imposed by the pathogen on the primary metabolism).
The first conclusion may resolve a controversy that has been ongoing for many years with respect to the mode of action by which Si reduces disease incidence. Because Si will naturally polymerize in the leaf apoplast, it was originally hypothesized that it created a physical barrier preventing fungal penetration (12). This hypothesis came under scrutiny when reports of root pathogens being controlled by Si and an absence of Si deposition under conditions of saturated humidity contradicted this putative modus operandi of Si (48). Additional evidence that defense reactions were elicited faster in plants treated with Si led some authors to suggest that Si exerted its beneficial role against plant diseases as a modulator of induced resistance (49). Our microarray results confirm that Si-treated plants still react to pathogen inoculation through the up-regulation of defense- and pathogenesis-related genes.
The second conclusion was originally proposed by Fawe et al. (49), who compared the role of Si to that of other known messengers of induced resistance such as salicylic acid or jasmonic acid. In their model, the authors suggested that the soluble fraction of Si acted as a modulator of induced resistance whereby the plants would respond faster or more efficiently to a pathogen attack. This model implies that Si plays a prophylactic role without having a direct effect on metabolism. Both the biological and the transcriptional evidence obtained here in Arabidopsis are supportive of this concept.
In conclusion, our Arabidopsis transcriptome analysis has provided unique insights into the properties of Si in plant biology. The most salient results have revealed that Si alone has apparently no effect on the metabolism of plants growing in a controlled environment (e.g., unstressed), thus confirming its nonessentiality in plant growth; supplying Si alleviates the stress such as one imposed by a pathogen. The way Si modulates this stress response in plants is active or at least not solely limited to a mechanical barrier as previously proposed.
Materials and Methods
Plant Material.
A. thaliana, accession Colombia (Col-0), was used because of its reported compatibility with the powdery mildew fungus E. cichoracearum DC (50). This accession was obtained from the Arabidopsis Biological Resource Center (Ohio State University, Columbus, OH). Seeds were sown in autoclaved Pro-Mix BX potting mix (Premier Horticulture, Rivière-du-Loup, QC, Canada), watered with sterile distilled water (300 ml per pot per week), and placed in a growth chamber (16 h light at 22°C, 8 h dark at 20°C, 60–70% humidity). Thinning to one plant per pot was done after 10 days. From the 11th day onward, A. thaliana plants were submitted to four different treatments (10 pots per treatment): (i) control (C) plants watered with a nutrient solution without soluble silicon, (ii) Si-treated (Si) plants watered with a nutrient solution containing 1.7 mM silicic acid (H4SiO4), (iii) plants inoculated with E. cichoracearum (P) on the 25th day after sowing, and (iv) plants treated with Si and inoculated (Si-P) at day 25. The base nutrient solution was adapted from Tocquin et al. (51). E. cichoracearum (strain UCSC) was obtained from S. Somerville (Stanford University, Palo Alto, CA) and maintained on squash plants Cucurbita maxima cv. Kuta (Park Seed, Greenwood, SC) grown under the same conditions as the A. thaliana plants. Three days before inoculation and to stimulate regeneration of fresh spores, dead fungal structures were removed from the squash leaves by blowing them with air. The inoculation procedure followed that of Adam and Somerville (52), where high-density inoculations were performed by gently touching infected squash leaves to target healthy leaves. Plants were monitored daily for disease development. Rosette leaves from all treatments were harvested when the disease reaction (DR) of inoculated plants not treated with Si had reached a level equivalent to 3 according to the DR scale 0–3 developed by Adam and Somerville (52). Rosette leaves were flash-frozen in liquid nitrogen and stored at −80°C. Scanning electron and x-ray microscopy were performed as described in ref. 20.
Microarray Preparation.
A loop design with complete dye-swap was used as experimental design for comparing plants submitted to four treatments and three biological replicates for a total of 24 Agilent Technologies Arabidopsis 3 microarrays. Total RNA was isolated from homogenized rosette leaves of three randomly selected plants for each treatment (three biological replicates) by using the Agilent Technologies (Mississauga, ON, Canada) Plant RNA Isolation Mini Kit reagent and dissolved in RNase-free H2O to a final concentration of 1.0–2.0 μg/μl. Microarray preparation and scanning services were provided by the “FRSQ-réseau cancer” core genomic facility (Québec, QC, Canada; www.crhdq.ulaval.ca). The quality of all RNA samples was examined by capillary electrophoresis with the Agilent Technologies (Palo Alto, CA) 2100 Bioanalyzer. Fluorescently labeled cDNAs were generated from 15 μg of total RNA in each reaction by using the Agilent Technologies Fluorescent Direct Label Kit and 1 mM Cy3- or Cy5-labeled dCTP (PerkinElmer, Boston, MA). Cy3-labeled cDNA from a specific treatment was mixed with the same amount of Cy5-labeled cDNA from another treatment, and this operation was repeated with a complete dye-swap. Hybridization was performed according to the oligonucleotide microarray hybridization user's manual and In Situ Hybridization Kit Plus (Agilent Technologies). For denaturation of cDNA, a volume of 200 μl of combined Cy3- and Cy5-labeled cDNA targets was kept at 98°C for 3 min and cooled to room temperature. They were mixed with 50 μl of 10× control targets, followed by the addition of 250 μl of 2× hybridization buffer. The 500 μl of reaction mix was applied to each Agilent Technologies 44K Arabidopsis 3 microarray (39,941 features) and hybridized in a hybridization rotation oven at 60°C for 17 h. The slides were disassembled in 6× SSC/0.005% Triton X-102, washed first with 6× SSC/0.005% Triton X-102 for 10 min at room temperature and then with 0.1× SSC/0.005% Triton X-102 for 5 min on ice, and dried by using a nitrogen-filled air gun. The arrays were scanned by using a dual-laser DNA microarray scanner (Agilent Technologies). The data were then extracted from images by using Feature Extraction 7.5 software (Agilent Technologies). A description of the microarray assay in MIAME format is provided as Supporting Text, which is published as supporting information on the PNAS web site.
Data Analysis.
The R 2.3 software and the LIMMA package (53) were used to normalize the microarray data (loess method for within array normalization followed by quantile method for between arrays normalization) and to generate lists of differentially expressed genes according to the fold change and t-test p values. Gene lists were created by initial filtering on confidence at p = 0.01 [using the t-test p value as measure of confidence, and the Benjamini and Hochberg false discovery rate (54) as multiple testing correction], followed by filtering on expression level (1.5-fold change). The complete data set is available through the Gene Expression Omnibus (accession number GSE5718). Selected gene lists (log ratio data) were loaded into Java Tree View 1.0.12 to generate data display.
Quantitative Real-Time PCR.
Differential expression of genes observed with the microarray assay was verified by quantitative real-time PCR with a DNA engine Opticon 2 (Bio-Rad, Hercules, CA).
cDNA was made from 2 μg of total RNA, previously digested by RQ1 RNase-free DNase (Promega, Madison, WI), for each biological replicates using Oligo(dT) (18) and SuperScript III reverse transcriptase (Invitrogen). Ten primer pairs for selected genes (see Table 2, which is published as supporting information on the PNAS web site) were designed with Oligo Explorer software (Gene Link) to amplify ≈300-bp fragments with similar GC and Tm. Sequences were obtained from the Arabidopsis Information Resource (www.arabidopsis.org). PCR amplifications were performed in 25 μl by using the QuantiTect SYBR Green PCR kit (Qiagen, Hilden, Germany) with 2.5 μl of sample cDNA. Each sample of each biological replicate was analyzed twice. The specificity of primer pairs was verified both by gel and melting curve analysis. At2g42600 was identified as a constitutively expressed gene in our microarray experiments and in a previous study (55) and was therefore used as an internal control for normalization. Quantification of the relative changes in gene expression was performed by using the 2−ΔΔCT method (56).
Functional Classification of Significant Genes.
A. thaliana gene annotations, gene ontologies, biochemical pathways, and transcription factors families were downloaded from publicly available databases and repositories [the Arabidopsis Information Resource (TAIR) (www.arabidopsis.org), the Kyoto Encyclopedia of Genes and Genomes (KEGG) (www.genome.jp/kegg), the Arabidopsis thaliana Transcription Factor Database (AtTFDB) (http://arabidopsis.med.ohio-state.edu/AtTFDB), and the Database of Arabidopsis Transcription Factors (DATF) (http://datf.cbi.pku.edu.cn)]. The TAIR annotations (sequenced genes), Gene Ontology annotations, KEGG biochemical pathways, Aracyc pathways, DATF transcription factor families, and AtTFDB transcription factor families were loaded into a MySQL database. A single annotation was assigned to each gene by using sequentially TAIR annotations, GO biological process, KEGG and Aracyc pathways, and Gene Ontology molecular function. The DATF and AtTFDB were used to classify transcription factors. All generated annotations were manually curated.
Supplementary Material
Acknowledgments
We thank G. Smyth (Walter and Eliza Hall Institute of Medical Research, Melbourne, Australia), N. Provart (University of Toronto, Toronto, ON, Canada), A. Labbe (Université Laval), and M.-L. Martin-Magniette (Institut National de la Recherche Agronomique, Paris-Grignon, France) for helpful suggestions on experimental design and data analysis, and S. Somerville (Stanford University, Stanford, CA) for providing the fungal isolate used in this study. This work was supported by a strategic grant from the Natural Sciences and Engineering Research Council of Canada in collaboration with Label-Agro and the Canada Research Chairs Program.
Footnotes
The authors declare no conflict of interest.
This article is a PNAS direct submission.
Data deposition: The data reported in this paper have been deposited in the Gene Expression Omnibus (GEO) database, www.ncbi.nlm.nih.gov/geo (accession no. GSE5718).
References
- 1.Wainwright M. Soc Gen Microbiol Q. 1997;24:83–85. [Google Scholar]
- 2.Hildebrand M, Dahlin K, Volcani BE. Mol Gen Genet. 1998;260:480–486. doi: 10.1007/s004380050920. [DOI] [PubMed] [Google Scholar]
- 3.Kinrade SD, Gillson AME, Knight CTG. J Chem Soc Dalton Trans. 2002:307–39. [Google Scholar]
- 4.von Sachs J. Landwirtscha Vers Stn. 1860;2:219–268. [Google Scholar]
- 5.Epstein E, Bloom AJ. Mineral Nutrition of Plants: Principles and Perspectives. 2nd Ed. Sunderland, MA: Sinauer; 2005. [Google Scholar]
- 6.Liang YC, Si J, Römheld V. New Phytol. 2005;167:797–804. doi: 10.1111/j.1469-8137.2005.01463.x. [DOI] [PubMed] [Google Scholar]
- 7.Mitani N, Ma JF. J Exp Bot. 2005;56:1255–1261. doi: 10.1093/jxb/eri121. [DOI] [PubMed] [Google Scholar]
- 8.Rains DW, Epstein E, Zasoski RJ, Aslam M. Plant Soil. 2006;280:223–228. [Google Scholar]
- 9.Ma JF, Tamai K, Yamaji N, Mitani N, Konishi S, Katsuhara M, Ishiguro M, Murata Y, Yano M. Nature. 2006;440:688–691. doi: 10.1038/nature04590. [DOI] [PubMed] [Google Scholar]
- 10.Epstein E. Annu Rev Plant Physiol Plant Mol Biol. 1999;50:641–664. doi: 10.1146/annurev.arplant.50.1.641. [DOI] [PubMed] [Google Scholar]
- 11.Fauteux F, Rémus-Borel W, Menzies JG, Bélanger RR. FEMS Microbiol Lett. 2005;249:1–6. doi: 10.1016/j.femsle.2005.06.034. [DOI] [PubMed] [Google Scholar]
- 12.Jones LHP, Handreck HA. Adv Agron. 1967;19:107–149. [Google Scholar]
- 13.Chérif M, Asselin A, Bélanger RR. Phytopathology. 1994;84:236–242. [Google Scholar]
- 14.Rémus-Borel W, Menzies JG, Bélanger RR. Physiol Mol Plant Pathol. 2005;66:108–115. [Google Scholar]
- 15.Rodrigues FA, McNally DJ, Datnoff LE, Jones JB, Labbé C, Benhamou N, Menzies JG, Bélanger RR. Phytopathology. 2004;94:177–183. doi: 10.1094/PHYTO.2004.94.2.177. [DOI] [PubMed] [Google Scholar]
- 16.Buell CR. Plant Physiol Biochem. 1998;36:177–186. [Google Scholar]
- 17.Consonni C, Humphry ME, Hartmann HA, Livaja M, Durner J, Westphal L, Vogel J, Lipka V, Kemmerling B, Schulze-Lefert P, et al. Nat Genet. 2006;38:716–720. doi: 10.1038/ng1806. [DOI] [PubMed] [Google Scholar]
- 18.Glazebrook J, Rogers EE, Ausubel FM. Annu Rev Genet. 1997;31:547–569. doi: 10.1146/annurev.genet.31.1.547. [DOI] [PubMed] [Google Scholar]
- 19.Schulze-Lefert P, Vogel J. Trends Plant Sci. 2000;5:343–348. doi: 10.1016/s1360-1385(00)01683-6. [DOI] [PubMed] [Google Scholar]
- 20.Ghanmi D, McNally DJ, Benhamou N, Menzies JG, Bélanger RR. Physiol Mol Plant Pathol. 2004;64:189–199. [Google Scholar]
- 21.Wan J, Dunning M, Bent A. Funct Integr Genomics. 2002;2:259–273. doi: 10.1007/s10142-002-0080-4. [DOI] [PubMed] [Google Scholar]
- 22.Haas B, Wortman J, Ronning C, Hannick L, Smith R, Maiti R, Chan A, Yu C, Farzad M, Wu D, et al. BMC Biol. 2005;3:7. doi: 10.1186/1741-7007-3-7. [DOI] [PMC free article] [PubMed] [Google Scholar]
- 23.Korndörfer GH, Lepsch I. In: Silicon in Agriculture. Datnoff LE, Snyder GH, Korndörfer GH, editors. Amsterdam: Elsevier; 2006. pp. 133–147. [Google Scholar]
- 24.Ma JF, Miyake Y, Takahashi E. In: Silicon in Agriculture. Datnoff LE, Snyder GH, Korndörfer GH, editors. Amsterdam: Elsevier; 2001. pp. 17–39. [Google Scholar]
- 25.Voogt W, Sonneveld C. In: Silicon In Agriculture. Datnoff LE, Snyder GH, Korndörfer GH, editors. Amsterdam: Elsevier; 2001. pp. 115–131. [Google Scholar]
- 26.Epstein E. Proc Natl Acad Sci USA. 1994;91:11–17. doi: 10.1073/pnas.91.1.11. [DOI] [PMC free article] [PubMed] [Google Scholar]
- 27.Richmond KE, Sussman M. Curr Opin Plant Biol. 2003;6:268–272. doi: 10.1016/s1369-5266(03)00041-4. [DOI] [PubMed] [Google Scholar]
- 28.Bruggmann R, Abderhalden O, Reymond P, Dudler R. Plant Mol Biol. 2005;58:247–267. doi: 10.1007/s11103-005-3099-9. [DOI] [PubMed] [Google Scholar]
- 29.Caldo RA, Nettleton D, Wise RP. Plant Cell. 2004;16:2514–2528. doi: 10.1105/tpc.104.023382. [DOI] [PMC free article] [PubMed] [Google Scholar]
- 30.Chen Z, Hartmann H, Wu MJ, Friedman E, Chen JG, Pulley M, Schulze-Lefert P, Panstruga R, Jones A. Plant Mol Biol. 2006;60:583–597. doi: 10.1007/s11103-005-5082-x. [DOI] [PubMed] [Google Scholar]
- 31.Schenk PM, Kazan K, Wilson I, Anderson JP, Richmond T, Somerville SC, Manners JM. Proc Natl Acad Sci USA. 2000;97:11655–11660. doi: 10.1073/pnas.97.21.11655. [DOI] [PMC free article] [PubMed] [Google Scholar]
- 32.Schulze-Lefert P, Panstruga R. Annu Rev Phytopathol. 2003;41:641–667. doi: 10.1146/annurev.phyto.41.061002.083300. [DOI] [PubMed] [Google Scholar]
- 33.Tao Y, Yuan F, Leister RT, Ausubel FM, Katagiri F. Plant Cell. 2000;12:2541–2554. doi: 10.1105/tpc.12.12.2541. [DOI] [PMC free article] [PubMed] [Google Scholar]
- 34.Zimmerli L, Stein M, Lipka V, Schulze-Lefert P, Somerville S. Plant J. 2004;40:633–646. doi: 10.1111/j.1365-313X.2004.02236.x. [DOI] [PubMed] [Google Scholar]
- 35.Koh S, Andre A, Edwards H, Ehrhardt D, Somerville S. Plant J. 2005;44:516–529. doi: 10.1111/j.1365-313X.2005.02545.x. [DOI] [PubMed] [Google Scholar]
- 36.Maleck K, Levine A, Eulgem T, Morgan A, Schmid J, Lawton KA, Dangl JL, Dietrich RA. Nat Genet. 2000;26:403–410. doi: 10.1038/82521. [DOI] [PubMed] [Google Scholar]
- 37.Scott KJ, Smillie RM. Plant Physiol. 1966;41:289–297. doi: 10.1104/pp.41.2.289. [DOI] [PMC free article] [PubMed] [Google Scholar]
- 38.Swarbrick PJ, Schulze-Lefert P, Scholes JD. Plant Cell Environ. 2006;29:1061–1076. doi: 10.1111/j.1365-3040.2005.01472.x. [DOI] [PubMed] [Google Scholar]
- 39.Green JR, Carver TLW, Gurr SJ. In: The Powdery Mildews, A Comprehensive Treatise. Bélanger RR, Bushnell WR, Dik AJ, Carver TL, editors. St Paul, MN: APS Press; 2002. pp. 66–82. [Google Scholar]
- 40.Dangl JL, Jones JDG. Nature. 2001;411:826–833. doi: 10.1038/35081161. [DOI] [PubMed] [Google Scholar]
- 41.Eulgem T. Trends Plants Sci. 2005;10:71–78. doi: 10.1016/j.tplants.2004.12.006. [DOI] [PubMed] [Google Scholar]
- 42.Glazebrook J. Curr Opin Plant Biol. 2001;4:301–308. doi: 10.1016/s1369-5266(00)00177-1. [DOI] [PubMed] [Google Scholar]
- 43.Hutcheson SW. Annu Rev Phytopathol. 1998;36:59–90. doi: 10.1146/annurev.phyto.36.1.59. [DOI] [PubMed] [Google Scholar]
- 44.Watanabe S, Shimoi E, Ohkama N, Hayashi H, Yoneyama T, Yazaki J, Fujii F, Shinbo K, Yamamoto K, Sakata K, et al. Soil Sci Plant Nutr. 2004;50:1273–1276. [Google Scholar]
- 45.Adatia MH, Besford RT. Ann Bot. 1986;58:343–351. [Google Scholar]
- 46.Deren CW, Datnoff LE, Snyder GH, Martin FG. Crop Sci. 1994;34:733–737. [Google Scholar]
- 47.Ma JF, Nishimura K, Takahashi E. Soil Sci Plant Nutr. 1989;35:347–356. [Google Scholar]
- 48.Fawe A, Menzies JG, Chérif M, Bélanger RR. In: Silicon in Agriculture. Datnoff LE, Snyder GH, Korndörfer GH, editors. Amsterdam: Elsevier Science; 2001. pp. 159–169. [Google Scholar]
- 49.Fawe A, Abou-Zaid M, Menzies JG, Bélanger RR. Phytopathology. 1998;88:396–401. doi: 10.1094/PHYTO.1998.88.5.396. [DOI] [PubMed] [Google Scholar]
- 50.Adam L, Ellwood S, Wilson I, Saenz G, Xiao S, Oliver RP, Turner JG, Somerville S. Mol Plant–Microbe Interact. 1999;12:1031–1043. doi: 10.1094/MPMI.1999.12.12.1031. [DOI] [PubMed] [Google Scholar]
- 51.Tocquin P, Corbesier L, Havelange A, Pieltain A, Kurtem E, Bernier G, Perilleux C. BMC Plant Biol. 2003;3:2. doi: 10.1186/1471-2229-3-2. [DOI] [PMC free article] [PubMed] [Google Scholar]
- 52.Adam L, Somerville SC. Plant J. 1996;9:341–356. doi: 10.1046/j.1365-313x.1996.09030341.x. [DOI] [PubMed] [Google Scholar]
- 53.Smyth GK. Stat Appl Genet Mol Biol. 2004;3:3. doi: 10.2202/1544-6115.1027. [DOI] [PubMed] [Google Scholar]
- 54.Benjamini Y, Hochberg Y. J R Stat Soc B. 1995;57:289–300. [Google Scholar]
- 55.Sanchez R, Cejudo FJ. Plant Physiol. 2003;132:949–957. doi: 10.1104/pp.102.019653. [DOI] [PMC free article] [PubMed] [Google Scholar]
- 56.Livak KJ, Schmittgen TD. Methods. 2001;25:402–408. doi: 10.1006/meth.2001.1262. [DOI] [PubMed] [Google Scholar]
Associated Data
This section collects any data citations, data availability statements, or supplementary materials included in this article.


