

Abstract
Aims
To study the effect of an acute increase in the arterial blood pressure on the diameter response of retinal arterioles supplying areas with focal diabetic macular oedema before and after laser photocoagulation, and control arterioles supplying areas without oedema.
Methods
In 17 diabetic patients the diameter response of arterioles after an increase in the arterial blood pressure induced by isometric exercise was studied using the retinal vessel analyser (RVA). In each patient a study arteriole supplying a focal area of macular oedema as well as a control arteriole supplying a retinal area without retinopathy lesions was selected, and the diameter response of these vessels was performed immediately before, and 1 hour and 3 months after focal laser photocoagulation of the focal oedema area.
Results
The diameter response was impaired in both study arterioles and control arterioles before focal laser photocoagulation. The treatment induced regression of the focal retinal oedema, but did not affect the diameter response in the arteriole supplying this area (p = 0.85).
Conclusion
Impairment of the diameter response in small arterioles from diabetic patients does not parallel the regional distribution of retinopathy lesions. Other factors than disturbed autoregulation are probably involved in generating flow disturbances and oedema in diabetic maculopathy.
Keywords: retinal vessels, autoregulation, myogenic response, retinal vessel analyser, diabetic maculopathy
The pathophysiology of diabetic maculopathy is only scarcely known, but evidence suggests that retinal hyperperfusion caused by dilation of retinal arterioles is an early disturbance involved in the disease pathogenesis.1 Under physiological conditions the diameter of retinal arterioles is autoregulated in response to changes in the blood pressure so that the retinal blood perfusion is kept at a balanced level. Autoregulation has previously been shown to be disturbed in diabetic retinopathy,2,3 but these disturbances have not been studied corresponding to the localised areas where retinopathy lesions develop in the early stages of the disease. Thus, it might be expected that the degree of impaired autoregulation in small arterioles would reflect the degree of maculopathy in the localised retinal areas supplied by these arterioles. Additionally, it might be expected that laser photocoagulation improving maculopathy would improve autoregulation in the small arteriole supplying the treated area.
The purpose of the present study was to investigate the relation between autoregulation in small retinal arterioles as measured with the retinal vessel analyser (RVA) and the degree of maculopathy in the focal retinal areas supplied by these arterioles. Furthermore, the response of autoregulation to laser photocoagulation of the focal areas with maculopathy was evaluated.
Materials and methods
Patients
Seventeen patients (16 men, one woman) with macular oedema were studied. The patients were recruited successively from the screening clinic for diabetic retinopathy at our department. Patients were asked to participate if they had focal diabetic macular oedema, defined as hard exudates (HE) and oedema within the macular area requiring focal laser treatment as verified by slit lamp biomicroscopy.4 The areas delimited by the lesions covered an area of less than one disc diameter, and were located more than one disc diameter from the fovea. Furthermore, the arteriole supplying the focal area to be laser treated was matched with a control arteriole of similar size in the same fundus, however, supplying an area without oedema and exudates.
The clinical data of the examined patients are shown in table 1.
Table 1 Clinical data of the examined patients.
| Patient | Age | Sex | Systemic BT (mm Hg) | History of hypertension | Duration of diabetes (years) | Age at diabetes debut | Type of medication | |
|---|---|---|---|---|---|---|---|---|
| 1 | 48 | male | 138 | 86 | yes | 11 | 37 | insulin |
| 2 | 47 | male | 148 | 87 | no | 25 | 22 | insulin |
| 3 | 53 | male | 138 | 88 | yes | 2 | 51 | insulin |
| 4 | 60 | male | 186 | 91 | no | 1 | 59 | oral antidiabetics |
| 5 | 57 | male | 163 | 90 | yes | 6 | 51 | insulin |
| 6 | 39 | male | 141 | 92 | yes | 21 | 18 | insulin |
| 7 | 51 | male | 129 | 75 | yes | 3 | 48 | insulin |
| 8 | 58 | male | 124 | 59 | no | 10 | 48 | oral antidiabetics |
| 9 | 63 | female | 167 | 95 | no | 0 | 63 | oral antidiabetics |
| 10 | 28 | male | 117 | 79 | no | 14 | 14 | insulin |
| 11 | 37 | male | 117 | 79 | no | 30 | 7 | insulin |
| 12 | 55 | male | 149 | 77 | yes | 5 | 50 | insulin |
| 13 | 43 | male | 145 | 92 | no | 12 | 31 | insulin |
| 14 | 27 | male | 150 | 104 | no | 14 | 13 | insulin |
| 15 | 47 | male | 146 | 98 | yes | 4 | 43 | insulin |
| 16 | 57 | male | 168 | 78 | yes | 40 | 17 | insulin |
| 17 | 54 | male | 189 | 98 | yes | 8 | 46 | insulin |
Ophthalmological examination
All patients underwent a routine ophthalmological examination including measurement of best corrected visual acuity (VA) using Snellen's board, pneumotonometry (Nidek NT‐3000, Japan), pupil dilatation with phenylephrine 10% (SAD, Denmark), and tropicamide 1% (Alcon, USA), 60 degree fundus photograph centred on the macular area in both eyes (Canon CF 60Z, Japan).
The diameter response of retinal arterioles
Apparatus
The diameter of retinal vessels was studied using the retinal vessel analyser (RVA, Imedos, Germany). This apparatus consists of a fundus camera (Zeiss FF450) and a video recording unit connected to a computer. The video recording of the ocular fundus is displayed on the computer monitor and is stored on a videotape. During an examination or during a later re‐analysis of a recorded examination, the video sequence is grabbed by the computer and is analysed in real time. The examiner defines a region of interest (ROI) overlying the vessel to be analysed (fig 1). Subsequently, the software (25 times per second) finds the edges of contrast defining the vessel borders at random positions inside the ROI and calculates the vessel diameter in arbitrary units (AU), which approximately correspond to micrometres at the retinal plane. For the study of the influence of blood pressure on retinal vascular diameter average values of the diameter obtained over at least 30 seconds were used.
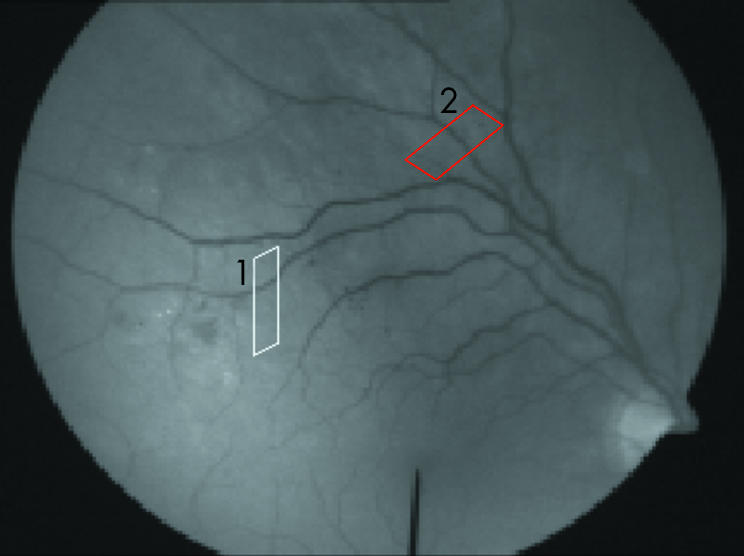
Figure 1 A frame from a video recording during an examination. The parallelograms correspond to the regions of interest overlying the (1) study arteriole (white) and (2) the control vessel (red).
Arterioles
Retinal arterioles were studied in one eye from each patient. The study arteriole was chosen as the main feeding arteriole to the identified area with focal oedema, and the ROI was placed as close to the oedema area as possible. In eight patients a control arteriole leading to a retinal area without retinopathy and with a diameter similar to the study arteriole was suitable for diameter measurements (fig 1). In the remaining nine patients the identified control arteriole could not be used because of the presence of nearby venules, vascular crossings, extensive tortuosity, or of the image being out of focus so that it hindered the diameter measurement.
Examination procedure
The patient was placed in front of the fundus camera and was asked to look at a fixation bar positioned inside its viewing system. The ROI was placed over this study arteriole and so that it was clearly separated from the accompanying venule.
The examination period consisted of two parts. The first (baseline) part was a recording of the vascular diameter for 3 minutes during rest. The second (exercise) part consisted of 3 minutes where the blood pressure was increased by lifting a 1 kg hand weight with the right arm. The exercise was followed by 4 minutes of rest where the blood pressure could return to normal. Subsequently, successive examination periods were carried out in which the weight lifted in the exercise period was increased in 0.5 kg steps to a maximum of 2.5 kg. The experiment was stopped if the patient could not lift a weight for the whole period of 3 minutes, and data from the lifting of the heaviest weight were used for the analysis. Two patients lifted 1.5 kg, three patients 2.0 kg, and the remaining 12 patients lifted 2.5 kg. The blood pressure was measured on the upper left arm using oscillometric technique (Omron M4, Japan). At the beginning of the baseline part, 120 seconds after the beginning of the exercise part, and at the end of the resting period.
Power and confidence intervals
The test‐retest variability of diameter measurements obtained with the RVA was evaluated by comparing baseline diameter measurements from two independent examinations of 51 healthy subjects (18 women and 33 men, age 44 (14) years (mean (SD)). The mean difference between the two measurements was 0.06% (95% CI: −0.92 to 1.04), with a Pearson correlation of 0.99 (95% CI: 0.98 to 0.99]. On the basis of this we used a double sided t test with a power of 70%; 17 patients were required to detect a change of 2% in the vascular diameter. Post hoc it appeared that a variation of 1.4% was observed in the diameter of the control arterioles in the 3 month period between baseline and follow up. This yielded an actual power of 50% for detecting a diameter change of this magnitude at repeated examinations for the 17 patients studied.
Retinal photocoagulation
Retinal photocoagulation was performed through a Mainster contact lens using a Zeiss Visulas 532S frequency doubled argon laser. For all treatments a 300 μm spot size and a pulse duration of 0.1 second were used. The effect of the burns was individually adjusted to produce a definite whitening,5 and varied between 220 mW and 500 mW (mean 368.9 (SD 82.7) mW). The burns were applied in a grid pattern with a spacing corresponding to the size of one burn, and the number of burns varied between six and 30 (mean 16.1 (SD 6.8)) in the treated eyes.
Follow up examination
The diameter response during isometric exercise was determined again 1 hour after retinal photocoagulation. Three months after treatment the diameter response was determined using the same procedure as before treatment.
Analysis of video sequences
Arteriole diameters
For the examination period that included the lifting of the heaviest hand weight the mean of all measurements obtained during the baseline period (180 seconds) was compared to the mean of all measurements obtained between 120 seconds and 150 seconds in the lifting periods, and thus the blood pressures were measured corresponding to the beginning of these periods.6
Transmural pressure
The mean arterial pressure (MAP) was calculated from the diastolic (BPdia) and the systolic (BPsys) blood pressures according to the equation: MAP = ⅔(BPdia) + ⅓(BPsys), and consequently the transmural pressure (TP) in the retinal arterioles was estimated to ⅓MAP − IOP.7 The change in TP during isometric exercise was calculated as ΔTP = 100((TPexercise/TPbaseline) – 1).
Gain factor
The gain factor (G) expresses the relation between changes in blood pressure and the vascular diameter to the power of four according to the following equation: G = 1 − ((TPexercise×d4exercise/TPbaseline×d4baseline) − 1))/(TPexercise − TPbaseline/TPbaseline), d being the mean diameter of the arteriole. If G is negative, the arteriole dilates when the pressure is increased. Positive G values indicate that the arteriole contracts when the pressure is increased. If G is between 0 and 1, the vascular contraction is insufficient to balance blood flow when the blood pressure increases. If G is 1, the decrease in diameter after a given blood pressure rise is balanced so that the blood flow is kept constant. A G larger than 1 means that the contraction is so pronounced that blood flow decreases when the blood pressure is increased.8
Baseline values
The mean baseline value of MAP for the patients was 100.5 (3.2) mm Hg, the mean IOP was 19.5 (1.0) mm Hg, and the mean TP in the retinal arterioles was estimated to be 28.0 (2.9) mm Hg. The mean diameter of the study arterioles was 81.2 (5.3) AU and for the control arterioles 93.1 (5.5) AU. No significant difference was found between the baseline diameter of study and control arterioles (p = 0.18).
Fundus evaluation
The effect of the laser treatment was evaluated by counting the number of HE on the fundus photograph taken immediately before and 3 months after treatment.
Statistical methods
The change in VA and the change in the number of HE between the pre‐laser examination and the follow up examination 3 months after photocoagulation were tested using the sign test.
The change in MAP during isometric exercise, the diameter changes, and the gain factor between the three examinations were tested using the Kruskall‐Wallis test.
The comparison of diameter changes in the study arterioles compared with control arterioles was tested using the Wilcoxon signed rank test. The difference between the baseline diameter of the study vessel before and after photocoagulation was evaluated using the one sample t test.
The dependency of age on the gain factor was tested by calculation of the Spearman correlation for age and G for study and control vessels respectively.
Results
The development over time is shown in table 2 for all subjects, whereas the differences between study and control vessels are shown in table 3.
Table 2 Changes in MAP, diameter, and gain factor at the three examinations for all study vessels. (n = 17). Values are mean (SEM).
| MAP change during isometric exercise (%) | Study vessels (all subjects) | ||
|---|---|---|---|
| Diameter response (%) | Gain factor | ||
| Pretreatment | 21 (3) | −0.92 (0.66) | 0.02 (0.20) |
| After treatment | 22 (3) | −0.95 (0.87) | 0.01 (0.27) |
| 3 month follow up | 22 (3) | 0.48 (0.94) | −0.58 (0.29) |
| p Value | 0.97 | 0.85 | 0.63 |
Table 3 Changes in diameter and gain factor for study and control vessels (n = 8). Values are mean (SEM).
| Study vessels | Control vessels | p Value | |||
|---|---|---|---|---|---|
| Diameter response (%) | Gain factor | Diameter response (%) | Gain factor | ||
| Pretreatment | −1.19 (0.96) | −0.40 (0.19) | −1.31 (1.25) | −0.40 (0.22) | 0.38 |
| After treatment | −1.26 (1.33) | −0.42 (0.54) | −0.32 (1.63) | −0.75 (0.56) | 0.38 |
| 3 month follow up | −1.08 (0.86) | −0.44 (0.34) | −0.61 (1.48) | −0.62 (0.40) | 0.55 |
At the baseline examination retinal autoregulation was absent (the gain factor was not significantly different from zero) in both study arterioles and in control arterioles. There was no significant correlation between the gain factor and age for the study and control vessel, respectively, r2study = 0.3 (95% CI : −0.91 to 0.22) and r2control = 0.2 (95% CI: −0.88 to 0.37).
Three months after treatment there was no significant change in VA (p = 1.0), but the treatment had induced a significant regression of the HE (from 15.6 (3.2) to 1.6 (0.6), p<0.0001) in the area supplied by the study arteriole. Additionally, a non‐significant (p = 0.25) constriction of the baseline diameter of 1.3% had occurred, which was due to a marked response in three of the patients. However, there was no change in the diameter response of either the study vessels or the control vessels, either immediately or 3 months after focal laser treatment.
Discussion
Several previous studies have shown that autoregulation of the retinal blood flow is disturbed in diabetic patients. These studies have mainly aimed at estimating the blood flow through the total retina or through larger areas of the retinal vascular system.1,2,3 However, these approaches have not estimated the flow corresponding to individual microcirculatory units where diabetic retinopathy lesions tend to develop. Thus, if diabetic retinopathy develops as a result of disturbed autoregulation, a correlation should be expected to exist between the autoregulatory response in small retinal arterioles supplying individual microcirculatory units and the degree of retinopathy in the focal retinal areas supplied by these arterioles. Likewise, it might be expected that treatment intervention aimed at reducing the severity of retinopathy would be accompanied by an improvement in the autoregulatory response in the arteriole supplying the treated retinal areas.
However, so far the testing of this working hypothesis has been hampered by a lack of suitable methods for measuring blood flow in the small calibre retinal arterioles supplying individual microcirculatory units. The two main determining factors for regulating blood flow are the arteriovenous pressure difference and the resistance of the vessel. Pressure measurements in human retinal arterioles in vivo are not possible, but the arteriovenous pressure difference can be controlled during examination of the eye since this difference only depends on systemic factors. Consequently, an assessment of changes in retinal blood flow can be done alone by measuring changes in the resistance of the vessels, a task that has recently become feasible with the advent of the retinal vessel analyser (RVA). Using this apparatus it is possible to study diameter changes of retinal blood vessels with a precision of 1% when the calibre is as small as 60 μm.9 Furthermore, continuous measurements over several minutes are possible, which enables the study of the diameter response after controlled rapid changes in the systemic blood pressure.
Using this method we designed a study of pressure autoregulation in small retinal arterioles supplying focal areas with diabetic maculopathy and control areas without retinopathy, as well as the response of pressure autoregulation to laser treatment of the maculopathy lesions. The results argue against the existence of a relation between impaired autoregulation and the development of focal diabetic retinopathy lesions. Firstly, pressure autoregulation was absent both in arterioles supplying focal areas with maculopathy and in control areas with no retinopathy, thus indicating that pressure autoregulation did not make the difference for the development of retinopathy lesions in these areas. The finding was independent of age indicating that the previously found age related reduction in pressure autoregulation did not influence the conclusions.6 It is possible that the impaired autoregulation had lasted longer in the arterioles supplying maculopathy areas, but the morphological appearance of the fundus was followed with regular fundus photography for more than 1½ years after the end of the study. During this period one patient developed clinically significant macular oedema requiring treatment, but none of the patients developed retinopathy lesions specifically in the localised retinal area supplied by the control arteriole. If the impaired autoregulation had been the cause of the development of retinopathy there could have been expected to be a development of retinopathy occurring in these control microcirculatory units.
Secondly, focal laser treatment resulted in regression of retinopathy lesions, but no improvement in the diameter response in the arterioles supplying the treated areas. Previous studies have shown that retinal arterioles constrict after laser photocoagulation,10 thereby reducing the hydrostatic pressure in the capillary bed with a consequent resolution of macular oedema, a finding which was confirmed in the present study, although the constriction found was not significant. Thus, it is highly conceivable that the laser treatment had induced regression of the lesions through another mechanism than by modifying pressure autoregulation. We conclude that impaired pressure autoregulation cannot fully explain the development of diabetic retinopathy lesions. Rather, it seems that impaired autoregulation may worsen retinopathy that has developed primarily as a result of a disturbance of a different tone regulation mechanism. Possible candidates for such a mechanism might be vasomotion or changes in the function of the vascular endothelium.11,12
In conclusion, the study has found impaired autoregulation both in small retinal arterioles supplying focal areas with diabetic macular oedema and control arterioles supplying areas without retinopathy. Focal laser treatment of the focal maculopathy areas induced regression of hard exudates, but no change in autoregulation. Prospective studies are needed in order to assess the temporal relation between the development of impaired autoregulation and retinopathy lesions in focal retinal areas. Furthermore, the role for the development of diabetic retinopathy of other tone regulation mechanisms than autoregulation is needed.
Abbreviations
AU - arbitrary units
HE - hard exudates
MAP - arterial pressure
ROI - region of interest
RVA - retinal vessel analyser
TP - transmural pressure
VA - visual acuity
Footnotes
Grant support: Danish Diabetes Association, The Association “Værn om Synet,” The VELUX Foundation, The Danish Medical Research Council.
Competing interests: none declared
Ethics approval: All examinations were approved by the local committee for scientific ethics, Den videnskabsetiske Komité for Århus Amt, Lyseng Allé 1, 8270 Højbjerg, Denmark.
References
- 1.Grunwald J E, DuPont J, Riva C E. Retinal haemodynamics in patients with early diabetes mellitus. Br J Ophthalmol 199680327–331. [DOI] [PMC free article] [PubMed] [Google Scholar]
- 2.Dumskyj M J, Kohner E M. Retinal blood flow regulation in diabetes mellitus: impaired autoregulation and No detectable effect of autonomic neuropathy using laser doppler velocimetry, computer assisted image analysis, and isometric exercise. Microvasc Res 199957353–356. [DOI] [PubMed] [Google Scholar]
- 3.Sinclair S H, Grunwald J E, Riva C E.et al Retinal vascular autoregulation in diabetes mellitus. Ophthalmology 198289748–750. [DOI] [PubMed] [Google Scholar]
- 4.Early Treatment Diabetic Retinopathy Study Research Group Focal photocoagulation treatment of diabetic macular edema. Relationship of treatment effect to fluorescein angiographic and other retinal characteristics at baseline. ETDRS report No 19. Arch Ophthalmol 19951131144–1155. [PubMed] [Google Scholar]
- 5.Early Treatment Diabetic Retinopathy Study Research Group Photocoagulation for diabetic macular edema. Arch Ophthalmol. 1985;103: 1796–806, Early Treatment Diabetic Retinopathy Study report No 1. [PubMed]
- 6.Jeppesen P, Gregersen P A, Bek T. The age‐dependent decrease in the myogenic response of retinal arterioles as studied with the retinal vessel analyzer. Graefes Arch Clin Exp Ophthalmol 2004242914–919. [DOI] [PubMed] [Google Scholar]
- 7.Glucksberg M R, Dunn R. Direct measurement of retinal microvascular pressures in the live, anesthetized cat. Microvasc Res 199345158–165. [DOI] [PubMed] [Google Scholar]
- 8.Osol G, Halpern W. Myogenic properties of cerebral blood vessels from normotensive and hypertensive rats. Am J Physiol 1985249H914–H921. [DOI] [PubMed] [Google Scholar]
- 9.Vilser W, Nagel E, Fuhrmann G.et al Retinale gefässanalyse—Neue möglichkeiten zur untersuchungen von netzhautgefässen. In: Schimdt KG, Pillunat LE, eds. Fortbildung Glaukom. Stuttgart, Germany, ENKE im Georg Thieme Verlag 200073–91.
- 10.Gottfredsdottir M S, Stefansson E, Jonasson F.et al Retinal vasoconstriction after laser treatment for diabetic macular edema. Am J Ophthalmol 199311564–67. [DOI] [PubMed] [Google Scholar]
- 11.Paniagua O A, Bryant M B, Panza J A. Role of endothelial nitric oxide in shear stress‐induced vasodilation of human microvasculature: diminished activity in hypertensive and hypercholesterolemic patients. Circulation 20011031752–1758. [DOI] [PubMed] [Google Scholar]
- 12.Schmetterer L, Polak K. Role of nitric oxide in the control of ocular blood flow. Prog Retin Eye Res 200120823–847. [DOI] [PubMed] [Google Scholar]