Abstract
Background
Array comparative genomic hybridisation (CGH) is a powerful method for the genetic analysis of lesional and normal tissues to identify genomic imbalances associated with malignancies. However, the use of this technique with DNA extracted from archival formalin fixed, paraffin embedded (FFPE) tissue specimens, the most widely available resource for retrospective studies, is subject to quantitative and qualitative limitations. In this report, the suitability and integrity of the DNA extracted from FFPE MCF7 breast cancer cells fixed for different periods of time for array CGH applications were examined.
Results
Using our established cDNA microarray protocol in conjunction with whole genome amplification methods, the genetic profiles of freshly harvested MCF7 cells and their matched FFPE counterparts were analysed. Congruent profiles between FFPE MCF7 cells and their fresh counterpart and between amplified and non‐amplified FFPE MCF7 cells were observed. Our results demonstrate that formalin fixation of <20 hours has no significant adverse effect on the integrity of DNA for array CGH studies.
Conclusions
Our findings attest to the fidelity of our array CGH methods to effectively examine material recovered from FFPE tissue specimens for microarray applications. This in turn has great potential to identify novel diagnostic and prognostic markers for human disease.
Keywords: microarray, CGH, formalin fixed paraffin embedded (FFPE), whole genome amplification
Chromosomal CGH was first introduced by Kallioniemi et al,1 and has revolutionised cytogenetic studies over the past decade. The precept of chromosomal CGH is competitive hybridisation of equal amounts of test and normal genomic DNA onto metaphase chromosome spreads. Subsequent quantitative analysis delineates chromosomal aberration (gain or loss). A major limitation of this method, however, is its restricted resolution of 10–20 Mb.2
This problem was overcome by the introduction of array CGH, in which a collection of mapped and annotated genomic clones replace metaphase chromosomes,3 allowing for higher resolution and identification of clones harbouring potential oncogenes and tumour supressor genes. The investigation of the clinical significance of such biomarkers requires comcommitant study of patient history and clinical follow up data. Formalin fixed, paraffin embedded (FFPE) tissue samples are a suitable source for such retrospective studies, but there is a valid concern about the coupling of array CGH with the use of FFPE specimens, because of the variable degree of DNA degradation and the oxidative and crosslinkage effect of formalin. Another limitation of such studies is the small quantity of DNA obtained from often miniscule microdissected FFPE lesions. Several whole genome amplification (WGA) methods have been developed to address the issue of DNA quantity,4 including an improved degenerate oligonucleotide primed (DOP)‐PCR5,6 and SCOMP (single cell comparative genomic hybridisation).7,8 In this paper, the quality of DNA obtained from FFPE cells subjected to different fixation times was examined, the fidelity of DOP‐PCR and SCOMP on FFPE specimens was investigated, and the overall suitability of DNA obtained from FFPE tissue for array CGH studies was assessed.
MATERIALS AND METHODS
Cell line and sample preparation
MCF7 breast cancer cells were cultured in appropriate medium and harvested using trypsin. The pellet was washed and mixed with drops of 3% agar (warmed to 45°C). Formalin fixation was carried out for 30 minutes, 20 hours, and 1 week, respectively, followed by paraffin embedding of the cell suspension. Sections (5 μm thick) were cut from the resulting block. A breast cancer and matched normal tissue block was identified by SJD from the files of the Department of Pathology with approval from the research ethics board of the University Health Network. DNA from all FFPE sources was extracted using the QIAmp DNA Mini Kit (Qiagen, Canada) according to the manufacturer's instructions.
DOP‐PCR
DOP‐PCR amplification was carried out using 200 ng of test and human placenta reference DNA according to Huang et al.5 DNA was subsequently purified using the QIAquick PCR Purification Kit (Qiagen, Canada) according to the manufacturer's instructions.
SCOMP
Test and human placenta reference DNA (100 ng each) were each subjected to MseI (New England Biolabs) digestion in three separate reactions. For each reaction, adaptor formation and ligation were carried out according to Stoecklein et al.8
Array CGH
Test DNA and human placenta reference DNA (1 μg each; Sigma) were labelled by random priming with Cy3 and Cy5 fluorescent nucleotides respectively. The labelling was carried out in four separate reactions and mixed with hybridisation buffer (DIG Easy Hyb; Roche). The labelled products were hybridised onto Human 1.7 K duplicate spot cDNA arrays (cell line) or 19 K single spot cDNA arrays (human tissue sample) (Clinical Genomics Center, UHN; www.microarray.ca) overnight at 37°C. Images were captured using a GenePix 4000A scanner and analysed using GenePix Pro 3.0 software (Axon Instruments, USA).
Quantitative PCR
Quantitative real time PCR (Q‐PCR) was conducted using the 2X Quantitect SYBR Green PCR kit (Qiagen, Canada), the ABI Prism 7700 sequence detection system and primer Express (Applied Biosystems, CA). For each sample, the reactions were performed in duplicate for both the reference (interferon‐γ ; IFNG) and target (topoisomerase‐II‐α; TOP2A) genes.
Data analysis
The array data were analysed using ArrayNorm software (http://genome.tugraz.at/Software/SoftwareIndex.html) to graphically illustrate the similarities between the MCF7 profiles. The normalised data were plotted on the x and y axes, and the correlation coefficient values were calculated by the software to measure the statistical significance of the x and y association.
Analysis of the microarray data was performed using Normalise Suite software.9 Array data were matched to the appropriate “genelist” file corresponding to the type of array used in the experiment. Data were subsequently normalised by the software and the differences in intensities for the two labels and potential systematic biases in data were corrected for by “simple local” normalisation, whereby a corrective factor based on overall mean array intensity from each subgrid is applied locally to the genes on the array.
RESULTS
Array CGH: comparison of fresh and FFPE MCF7 cells
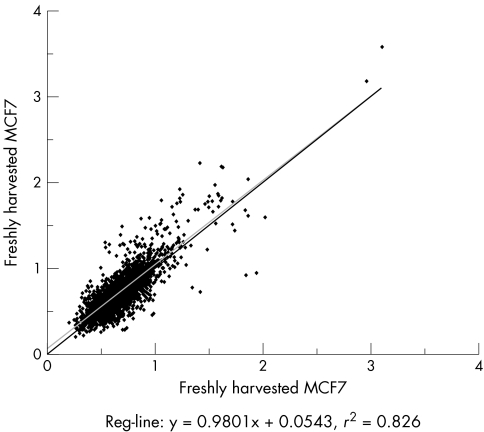
A freshly harvested MCF7 cell suspension was placed in 3% agar and fixed with 10% buffered formalin for periods of 30 minutes, 20 hours, and 1 week respectively, and subsequently embedded in paraffin. The typical fixation time for routinely processed clinical samples is within this range.10 The quality of DNA extracted from freshly harvested and FFPE MCF7 cells was visualised by gel electrophoresis. There were no differences in the size and intensity of DNA bands corresponding to fresh cells and those extracted from FFPE cells treated in formalin for 30 minutes and 20 hours respectively. Cells subjected to 1 week of formalin fixation however, exhibited highly fragmented DNA and extensive loss of high molecular weight DNA. Large scale genomic analysis was performed using 1.7 K human arrays in duplicate on DNA extracted from fresh and matched FFPE cells. The overall similarity of the array profiles and copy number changes were then measured with emphasis on amplification on chromosomes 17q and 20q which have been well described in the MCF7 cell line.11,12,13,14,15,16 The presence of known regions of amplification in MCF7 was examined and confirmed. They include amplification of TOPO2A and nuclear receptor co‐activator 3 (NCOA3) on 17q21–q22 and 20q12–13 respectively. Replicate samples of fresh MCF7 were analysed and showed a high degree of reproducibility (fig 1).
Figure 1 Comparison of two identical array experiments using freshly harvested MCF7 showing 83% similarity.
Array data were analysed using ArrayNorm software to graphically illustrate the similarities between the profiles. Array results obtained from FFPE cells with 30 minute and 20 hour fixation times were respectively 87% and 85% concordant with data obtained from freshly harvested MCF7 cells (fig 2A,B). Array data from FFPE MCF7 cells fixed for 1 week in formalin showed no similarity to their fresh counterparts, producing a correlation coefficient of –0.4 (fig 2C).
Figure 2 Comparison of array CGH data. Regression graphs and correlation coefficient values generated by ArrayNorm software. Freshly harvested MCF7 and FFPE MCF7: (A) 30 minutes fixation time, data are plotted on the x and y axes, respectively, showing 87% similarity; (B) 20 hours fixation time, data are plotted on the x and y axes, respectively, showing 85% similarity; (C) 1 week fixation time, data are plotted on the x and y axes, respectively, showing no similarity.
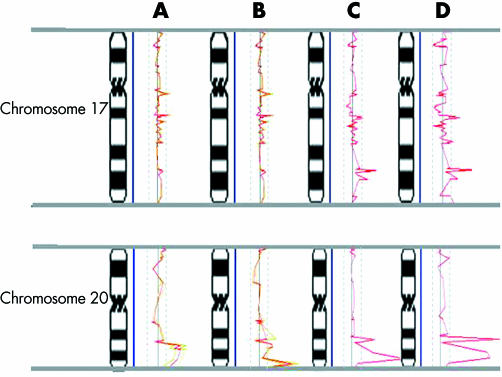
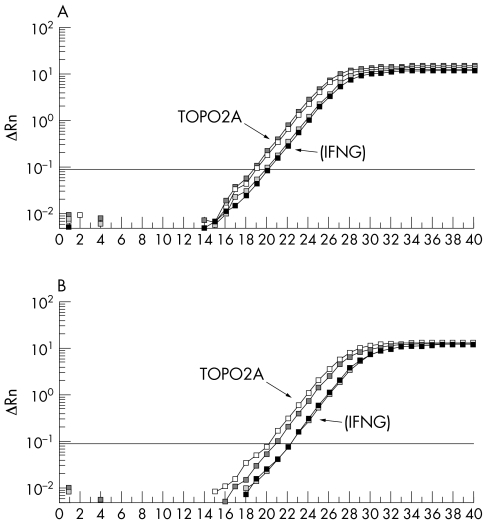
Subsequently, data from array CGH were normalised using Normalise Suite software and analysed to plot the profiles of individual chromosomes. Cutoffs for alterations (1.2 and 0.8 for amplification and deletion respectively) were based on two standard deviations from the mean. The CGH profile of FFPE MCF7 DNA (with 20 hour formalin fixation) was similar to the profile generated by non‐fixed MCF7 DNA (fig 3A). However, 1 week fixation of the cells in formalin generated low quality labelling and a poor CGH profile compared with the above profiles. Validation of the data obtained from array CGH was performed by Q‐PCR (fig 4).
Figure 3 Comparison of CGH profiles of chromosomes 17 and 20 in MCF7. (A) Comparison of the array CGH profiles of freshly harvested MCF7 and its FFPE counterpart. The profiles were generated by Normalize Suite software and superimposed to facilitate comparison. For each profile, the vertical line in the middle represents a ratio of 1.0. Thresholds are marked by dotted lines. Array data from fresh and FFPE MCF7 cells are represented in green and the average is shown in red. Note the similarity of the overlaid profiles. (B) Array CGH data from DOP‐PCR amplified MCF7 and DOP‐PCR amplified FFPE MCF7 (both shown in green) are superimposed and exhibit a similar pattern. The average is shown in red. Array CGH profiles of SCOMP amplified MCF7 (C) and SCOMP amplified FFPE MCF7 (D) show the same trend. Slight discordance was observed when comparing the profiles that may be due to experimental and array variation as shown in fig 1.
Figure 4 Quantitative PCR analysis of topoisomerase II‐α (TOPO2A) in MCF7 (A) and in FFPE MCF7 (B). The relative fluorescence intensity for the test and control gene products of duplicate reactions was determined with the sequence detector software and the values were plotted on a log scale against the number of PCR cycles. Both graphs validate the amplification of the TOPO2A gene compared with the control gene, gamma interferon (IFNG).
Fidelity of WGA on FFPE samples
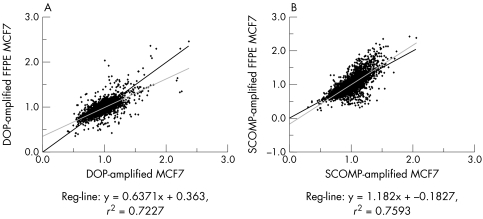
Freshly harvested and matched FFPE (with 20 hours of formalin fixation) MCF7 DNA was subjected to DOP‐PCR and SCOMP. The amplification efficiency of DNA from fixed cells was compared with that of unfixed cells by taking into account the size and fluorescent intensity of the bands and the overall amplified DNA quality when analysed by agarose gel electrophoresis. No differences were observed in size and intensity of the bands between the fixed and unfixed cells. This indicated that formalin fixation alone did not seem to interfere with DOP‐PCR or with SCOMP amplification. To validate this finding for the entire genome, amplified MCF7 DNA (both fresh and FFPE) was subjected to array CGH (fig 3B,C). The profile obtained from DOP amplified fresh MCF7 was 72% similar to that procured from DOP amplified FFPE MCF7 (fig 5A). Genomic amplification by SCOMP produced a regression graph with a correlation of 76% between SCOMP amplified data of fresh and matched FFPE MCF7 (fig 5B). Amplification of the TOPO2A and NCOA3 genes was confirmed by both DOP‐PCR and SCOMP methods of WGA.
Figure 5 Comparison of whole genome amplified array CGH data by ArrayNorm software. (A) DOP‐PCR amplified MCF7 and DOP‐PCR amplified FFPE MCF7 data are plotted on the x and y axes, respectively, showing 72% similarity. (B) SCOMP amplified MCF7 and FFPE MCF7 data are plotted on the x and y axes, respectively, showing 76% similarity.
This methodology was also tested on an archival breast cancer specimen with corresponding normal tissue. Cutoffs were based on three standard deviations from the mean as the standard deviation on the 19 K arrays was much lower. The profiles of SCOMP amplified and non‐amplified sections were almost identical, and more importantly, the same regions of amplification were clearly distinguished (fig 6).
Figure 6 Formalin fixed paraffin embedded breast cancer sample. An overlay of the two profiles generated from a breast cancer case without amplification (black spots) and with SCOMP‐amplification (grey spots) shows identical profiles with common regions of amplification highlighted at 1q, 7q11–21 and 16q12. Array CGH profiles were plotted using the ratio versus the list of ordered spots to identify regions of amplification and deletion for each tumour/normal pair. The horizontal dashed lines indicate three standard deviations from the mean.
DISCUSSION
Identification of genomic markers in human disease is a complicated challenge. CGH allows the study of such complex malignancies by measuring genomic aberrations of tumour DNA relative to normal genomic DNA in a single experiment. The widespread use of this technique with frozen tissues is well documented, but obtaining such samples for studies is difficult. In contrast, archival tissue samples are widely available and allow the coupling of molecular biology studies with clinical data. Therefore, they remain the favoured choice for retrospective studies. Archival tissue samples, however, are preserved using fixatives such as formalin, the most widely used reagent.9,17 In array CGH, the low quantity and poor quality of DNA obtained from FFPE tissue samples often inhibit the success of such studies. Several factors influence the quality of nucleotides and proteins of preserved specimens, including fixation time, storage condition, and the passage of time.10,18,19,20 For molecular studies, the fixation time is one of the major factors determining the quality of DNA.10,21
Previous studies on the qualitative assessment of FFPE DNA employ a range of molecular biology techniques to investigate the genomic profile of DNA and to validate the findings using the same archival material.22,23 Other reports include comparative studies with the aim of investigating different fixatives and their relative effect on DNA.10,20,24,25,26 In this report, the suitability of the DNA obtained from FFPE samples with different fixation times in formalin for array CGH was investigated.
A substantial decrease in the quality of DNA obtained from MCF7 cells subjected to formalin fixation for 1 week was observed. This was noted by an increase in the degree of DNA fragmentation and the loss of high molecular weight DNA. Conversely, CGH profiles generated from FFPE MCF7 fixed for 20 hours were similar to that of freshly harvested MCF7. Slight discordance between profiles was detected that may be due to experimental and array variation. This was noted by comparing two identical array CGH profiles of freshly harvested MCF7 producing a correlation of 83% (fig 1). Taken together the overall similarities of the profiles indicate that formalin fixation up to 20 hours did not affect the suitability of extracted DNA for array CGH studies. The overall concordance of the amplified CGH profiles was slightly higher using SCOMP compared with DOP‐PCR. This may be due to the inherent differences in these two procedures. The basis of DOP‐PCR is the random annealing of degenerate primers to the template. The use of thousands of different primers poses a potential concern regarding the equal binding efficiency of the primers onto the template. In SCOMP, however, a single primer is used to bind the MseI digested fragments in an adaptor ligation mediated fashion.
In conclusion, we investigated the application of array CGH and WGA methods for the study of archival FFPE tissue samples. Our results indicate that limited periods of formalin fixation preserve the integrity of DNA for array CGH studies. We also demonstrate the utility of WGA methods to amplify FFPE material to provide sufficient DNA quantity for array CGH studies using a simple protocol. Development of strategies to effectively examine material recovered from FFPE tissue specimens for microarray applications has great potential for the discovery of signature genetic profiles and diagnostic and prognostic markers for human disease.
TAKE HOME MESSAGES
Array comparative genomic hybridisation (CGH) is a powerful method to identify genomic imbalances associated with malignancies, but use of this technique with DNA extracted from archival formalin fixed, paraffin embedded (FFPE) tissue specimens is associated with some technical problems.
The genetic profiles of freshly harvested MCF7 cells and their matched FFPE counterparts were analysed, and it was demonstrated that formalin fixation of <20 hours has no significant adverse effect on the integrity of DNA for array CGH studies.
Development of strategies to effectively examine material recovered from FFPE tissue specimens for microarray applications has great potential for the discovery of signature genetic profiles and diagnostic and prognostic markers for human disease.
ACKNOWLEDGEMENTS
The authors thank Drs J Squire and M Tsao for their valuable comments on the manuscript. This work was supported by grants from the Cancer Research Society Inc., The Sir Jules Thorn Charitable Trust, and the Canadian Breast Cancer Research Alliance.
Abbreviations
CGH - comparative genomic hybridisation
DOP - degenerate oligonucleotide primed
FFPE - formalin fixed, paraffin embedded
Q‐PCR - quantitative real time PCR
SCOMP - single cell comparative genomic hybridisation
WGA - whole genome amplification
References
- 1.Kallioniemi A, Kallioniemi O P, Sudar D.et al Comparative genomic hybridization for molecular cytogenetic analysis of solid tumors. Science 1992258818–821. [DOI] [PubMed] [Google Scholar]
- 2.Albertson D G. Profiling breast cancer by array CGH. Breast Cancer Res Treat 200378289–298. [DOI] [PubMed] [Google Scholar]
- 3.Pinkel D, Segraves R, Sudar D.et al Quantitative high resolution analysis of DNA copy number variation in breast cancer using comparative genomic hybridization to DNA microarrays. Nat Genet 199820207–211. [DOI] [PubMed] [Google Scholar]
- 4.Hughes S, Arneson N, Done S.et al The use of Whole genome amplification in the study of human disease. Prog Biophys Mol Biol 200588173–189. [DOI] [PubMed] [Google Scholar]
- 5.Huang Q, Schantz S P, Rao P H.et al Improving degenerate oligonucleotide primed PCR‐comparative genomic hybridization for analysis of DNA copy number changes in tumors. Genes Chromosomes Cancer 200028395–403. [PubMed] [Google Scholar]
- 6.Daigo Y, Chin S F, Gorringe K L.et al Degenerate oligonucleotide primed‐polymerase chain reaction‐based array comparative genomic hybridization for extensive amplicon profiling of breast cancers : a new approach for the molecular analysis of paraffin‐embedded cancer tissue. Am J Pathol 20011581623–1631. [DOI] [PMC free article] [PubMed] [Google Scholar]
- 7.Klein C A, Schmidt‐Kittler O, Schardt J A.et al Comparative genomic hybridization, loss of heterozygosity, and dna sequence analysis of single cells. Proc Natl Acad Sci USA 1999964494–4499. [DOI] [PMC free article] [PubMed] [Google Scholar]
- 8.Stoecklein N H, Erbersdobler A, Schmidt‐Kittler O.et al SCOMP is superior to degenerated oligonucleotide primed‐polymerase chain reaction for global amplification of minute amounts of DNA from microdissected archival tissue samples. Am J Pathol 200216143–51. [DOI] [PMC free article] [PubMed] [Google Scholar]
- 9.Beheshti B, Braude I, Marrano P.et al Chromosomal localization of DNA amplifications in neuroblastoma tumors using cdna microarray comparative genomic hybridization. Neoplasia 2003553–62. [DOI] [PMC free article] [PubMed] [Google Scholar]
- 10.Srinivasan M, Sedmak D, Jewell S. Effect of fixatives and tissue processing on the content and integrity of nucleic acids. Am J Pathol 20021611961–1971. [DOI] [PMC free article] [PubMed] [Google Scholar]
- 11.Barlund M, Tirkkonen M, Forozan F.et al Increased copy number at 17q22–q24 by CGH in breast cancer is due to high‐level amplification of two separate regions. Genes Chromosomes Cancer 199720372–376. [DOI] [PubMed] [Google Scholar]
- 12.Barlund M, Monni O, Kononen J.et al Multiple genes at 17q23 undergo amplification and overexpression in breast cancer. Cancer Res 2000605340–5344. [PubMed] [Google Scholar]
- 13.Forozan F, Mahlamaki E H, Monni O.et al Comparative genomic hybridization analysis of 38 breast cancer cell lines: a basis for interpreting complementary DNA microarray data. Cancer Res 2000604519–4525. [PubMed] [Google Scholar]
- 14.Kytola S, Rummukainen J, Nordgren A.et al Chromosomal alterations in 15 breast cancer cell lines by comparative genomic hybridization and spectral karyotyping. Genes Chromosomes Cancer 200028308–317. [DOI] [PubMed] [Google Scholar]
- 15.Glaeser M, Floetotto T, Hanstein B.et al Gene amplification and expression of the steroid receptor coactivator SRC3 (AIB1) in sporadic breast and endometrial carcinomas. Horm Metab Res 200133121–126. [DOI] [PubMed] [Google Scholar]
- 16.Volik S, Zhao S, Chin K.et al End‐Sequence profiling: sequence‐based analysis of aberrant genomes. Proc Natl Acad Sci USA 20031007696–7701. [DOI] [PMC free article] [PubMed] [Google Scholar]
- 17.Hostein I, Coindre J M, Derre J.et al Comparative genomic hybridization study of paraffin‐embedded dedifferentiated liposarcoma fixed with Holland Bouin's fluid. Diagn Mol Pathol 200312166–173. [DOI] [PubMed] [Google Scholar]
- 18.Alaibac M, Filotico R, Giannella C.et al The effect of fixation type on DNA extracted from paraffin‐embedded tissue for PCR studies in dermatopathology. Dermatology 1997195105–107. [DOI] [PubMed] [Google Scholar]
- 19.B Bonin S, Petrera F, Niccolini B.et al PCR analysis in archival postmortem tissues. Mol Pathol 200356184–186. [DOI] [PMC free article] [PubMed] [Google Scholar]
- 20.Zsikla V, Baumann M, Cathomas G. Effect of buffered formalin on amplification of DNA from paraffin wax embedded small biopsies using real‐time PCR. J Clin Pathol 200457654–656. [DOI] [PMC free article] [PubMed] [Google Scholar]
- 21.Foss R D, Guha‐Thakurta N, Conran R M.et al Effects of fixative and fixation time on the extraction and polymerase chain reaction amplification of RNA from paraffin‐embedded tissue. comparison of two housekeeping gene mRNA controls. Diagn Mol Pathol 19943148–155. [DOI] [PubMed] [Google Scholar]
- 22.Burger P C, Minn A Y, Smith J S.et al Losses of chromosomal Arms 1p and 19q in the diagnosis of oligodendroglioma. A study of paraffin‐embedded sections. Mod Pathol 200114842–853. [DOI] [PubMed] [Google Scholar]
- 23.Paris P L, Albertson D G, Alers J C.et al High‐resolution analysis of paraffin‐embedded and formalin‐fixed prostate tumors using comparative genomic hybridization to genomic microarrays. Am J Pathol 2003162763–770. [DOI] [PMC free article] [PubMed] [Google Scholar]
- 24.Kosel S, Grasbon‐Frodl E M, Arima K.et al Inter‐laboratory comparison of DNA preservation in archival paraffin‐embedded human brain tissue from participating centres on four continents. Neurogenetics 20013163–170. [DOI] [PubMed] [Google Scholar]
- 25.Ahrens K, Braylan R, Almasri N.et al IgH PCR of Zinc formalin‐fixed, paraffin‐embedded non‐lymphomatous gastric samples produces artifactual “clonal” bands not observed in paired tissues unexposed to zinc formalin. J Mol Diagn 20024159–163. [DOI] [PMC free article] [PubMed] [Google Scholar]
- 26.Gillespie J W, Best C J, Bichsel V E.et al Evaluation of non‐formalin tissue fixation for molecular profiling studies. Am J Pathol 2002160449–457. [DOI] [PMC free article] [PubMed] [Google Scholar]


